Market Momentum: Your Weekly Financial Forecast & Market Prep
Issue 37 / What to expect March 17, 2025 thru March 21, 2025
In This Issue
Market-On-Close: All of last week’s market-moving news and macro context in under 5 minutes + futures-at-a-glance
The Latest Investor Sentiment Readings
Institutional Support & Resistance Levels For Major Indices: Exactly where to look for support and resistance this week in SPY, QQQ, IWM & DIA
Institutional Activity By Sector: Institutional order flow by sector including the top institutionally-backed names in those sectors. We break it all down and provide the key insights and take-aways you need to navigate institutional positioning this week.
Top Institutional Order Flow In Individual Names: All of the largest sweeps and blocks on lit exchanges and hidden dark pools
Moneyflow Charts for: SPY, QQQ, NVDA, IVV
Investments In Focus: Bull vs Bear arguments for K, LRCX, TD
Top Institutionally-Backed Gainers & Losers: An explosive watchlist for day traders seeking high-volatility
Normalized Performance By Thematics YTD (Sector, Industry, Factor, Energy, Metals, Currencies, and more): which corners of the markets are beating benchmarks, which ones are overlooked and which ones are over-crowded
Key Econ Events and Earnings On-Deck For This Week

Market-On-Close
US Market Weekly Analysis: Correction Territory Amid Trade Policy Uncertainty
Market Performance Assessment
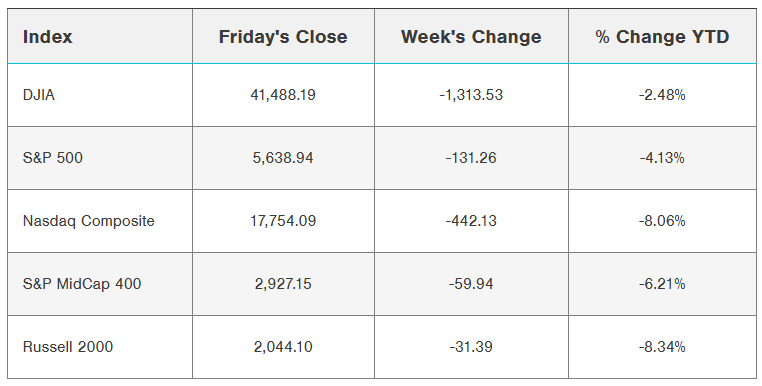
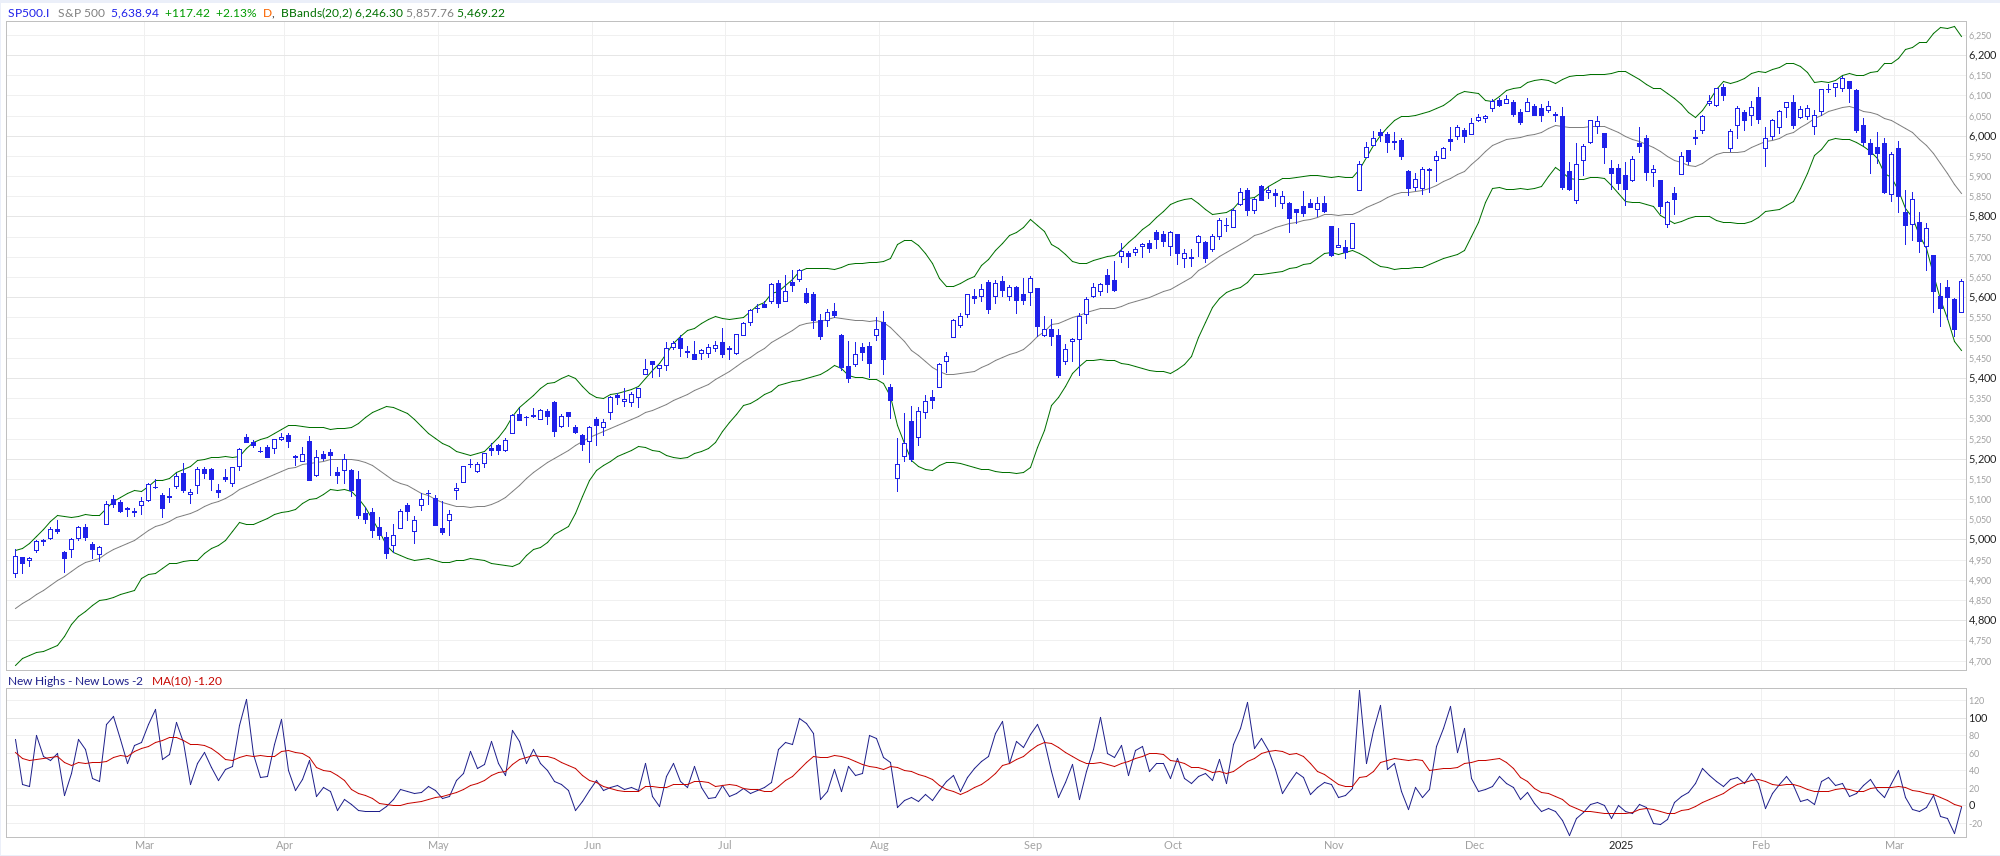
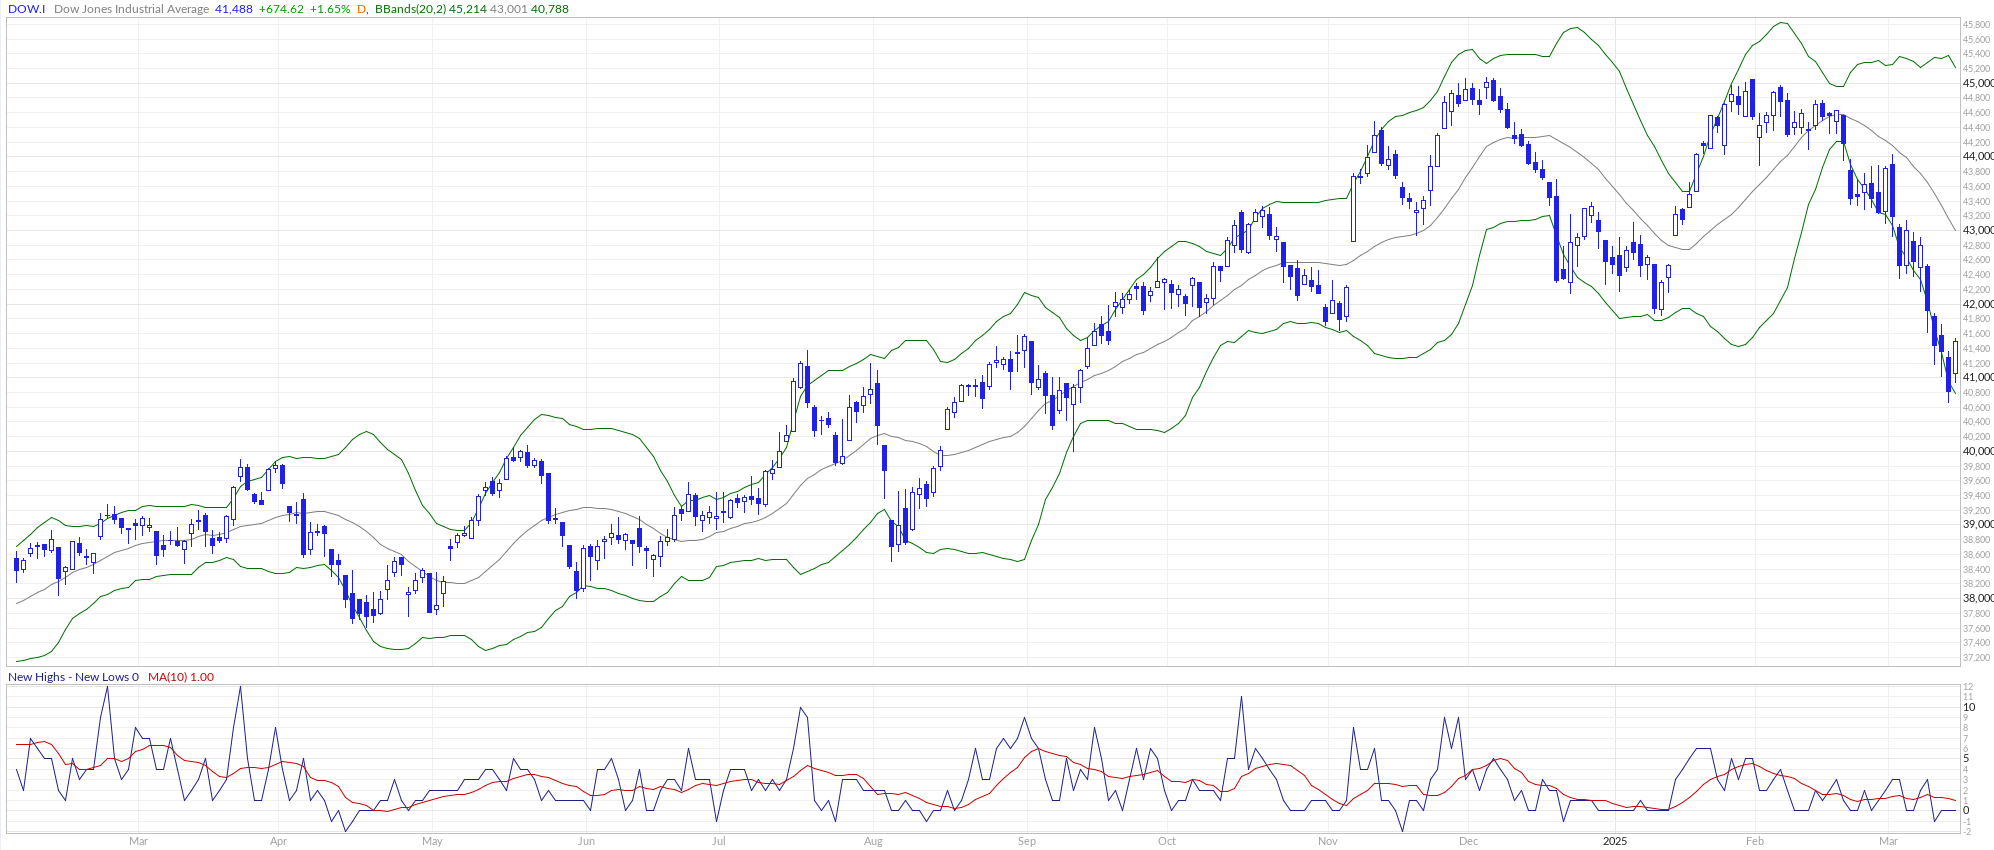
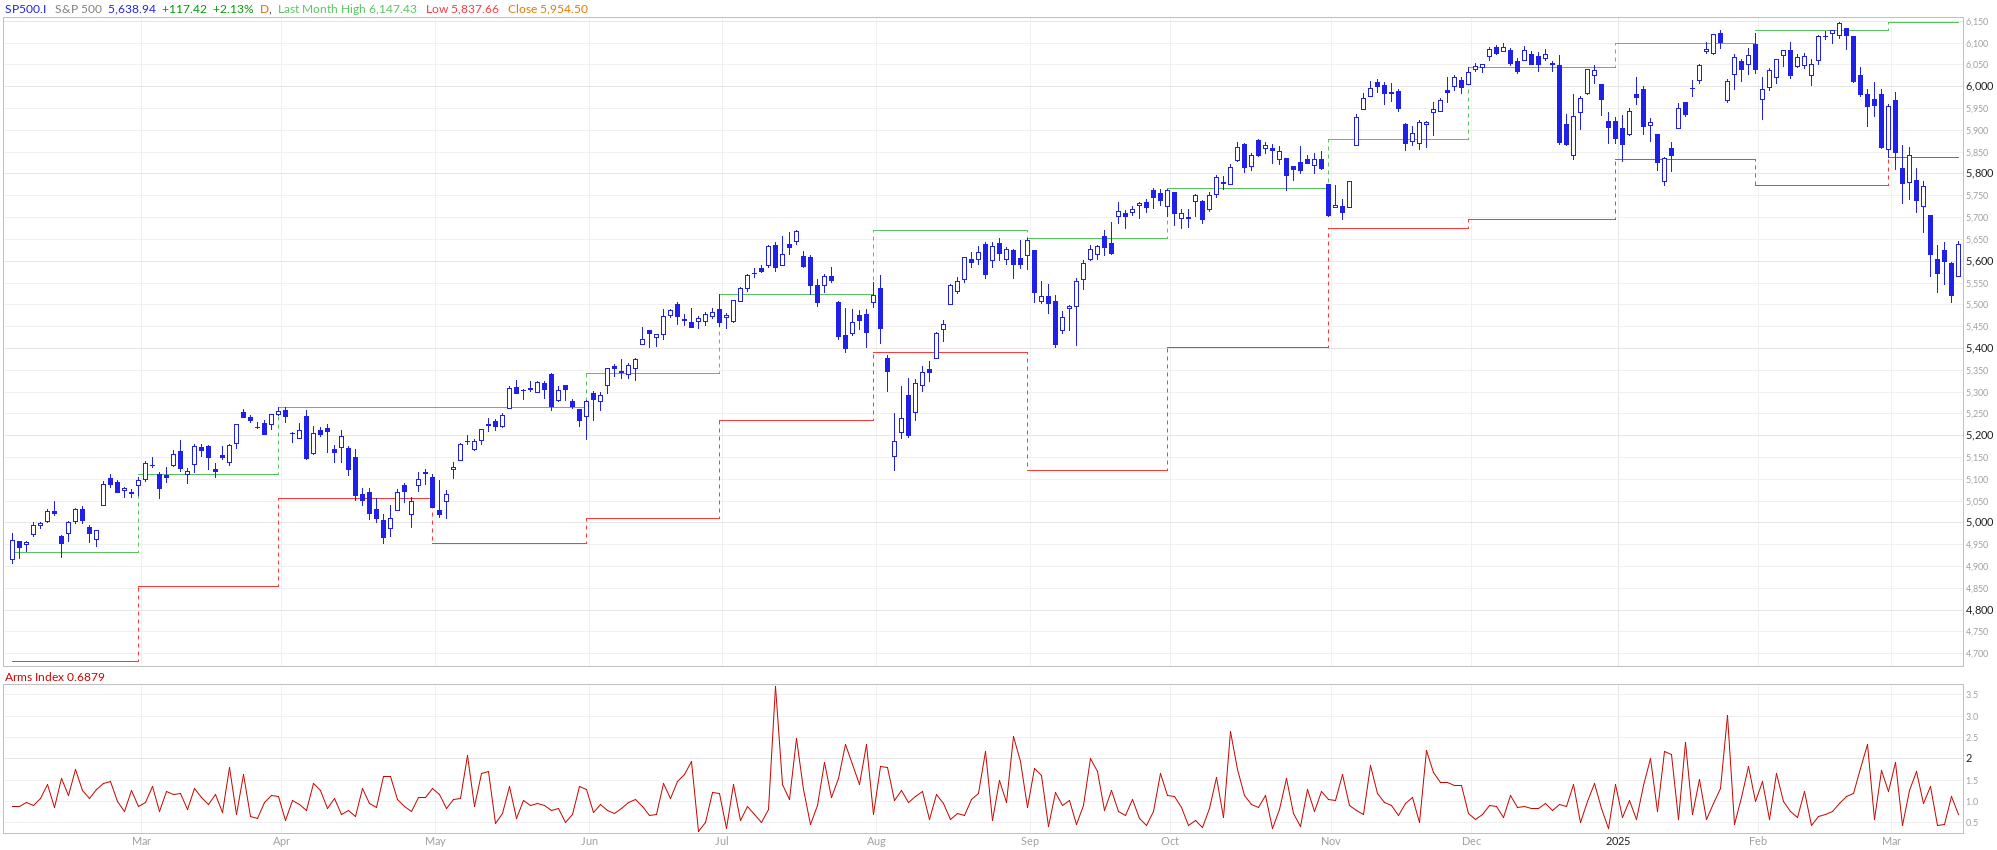
The week concluded with U.S. equity markets experiencing their fourth consecutive negative weekly performance, with the S&P 500 briefly entering correction territory, defined as a 10.5% drawdown from recent peaks—the first such correction since October 2023. Despite Friday's relief rally, the index closed down 2.3% for the week. The Dow Jones Industrial Average underperformed with a 3.07% decline, while transportation stocks demonstrated particular weakness, declining more than 6% as airlines issued downward guidance revisions.

Monday's session initiated substantial downward pressure with the S&P 500 declining nearly 3%, effectively negating the previous Friday's late-session recovery and decisively breaching the 200-day moving average. Large-capitalization technology stocks, which have been primary market drivers since 2023, led the decline with the NYSE FANG+ index contracting approximately 5%.
Tuesday's market dynamics shifted toward sector rotation rather than broad-based selling, with select large-capitalization technology and artificial intelligence companies demonstrating relative strength following Oracle's positive demand commentary. However, weakness simultaneously emerged in consumer-oriented equities as multiple airlines reduced forward guidance ahead of scheduled investor conferences, and retailers expressed cautious outlooks.
Wednesday produced mixed trading patterns despite inflation metrics registering below consensus expectations. By Thursday, market conditions deteriorated significantly with broad-based declines across asset classes, pushing the S&P 500 fully into correction territory at 10.5% below recent highs.
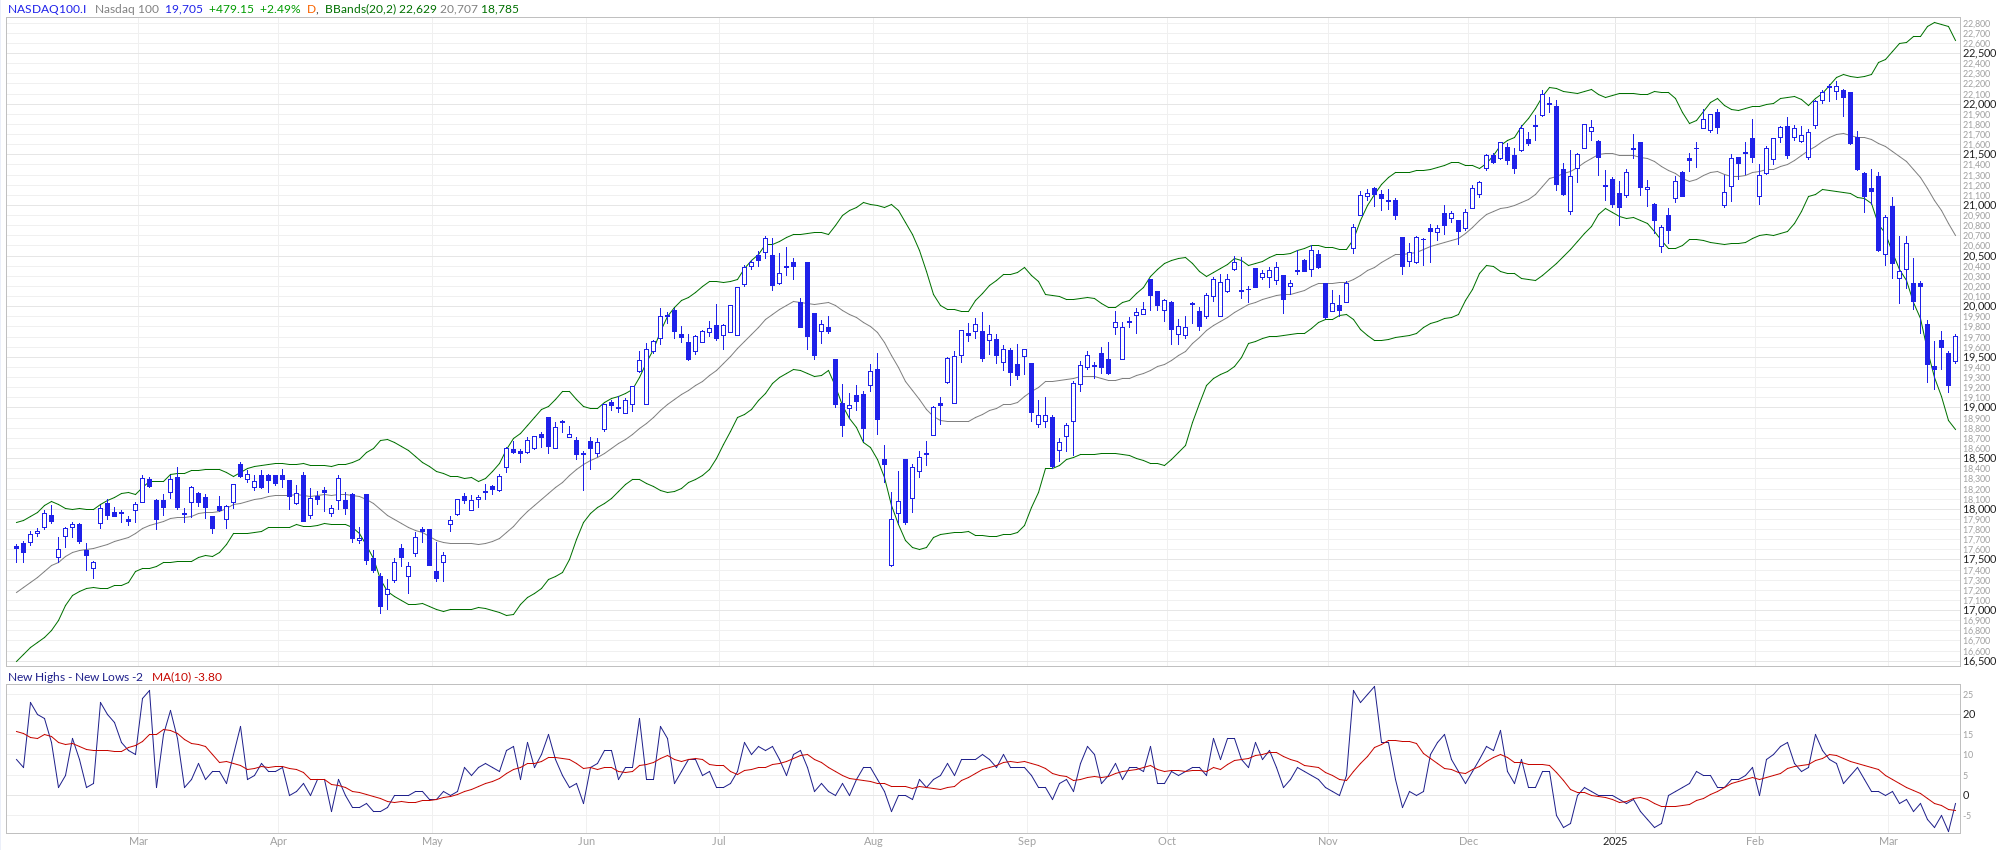
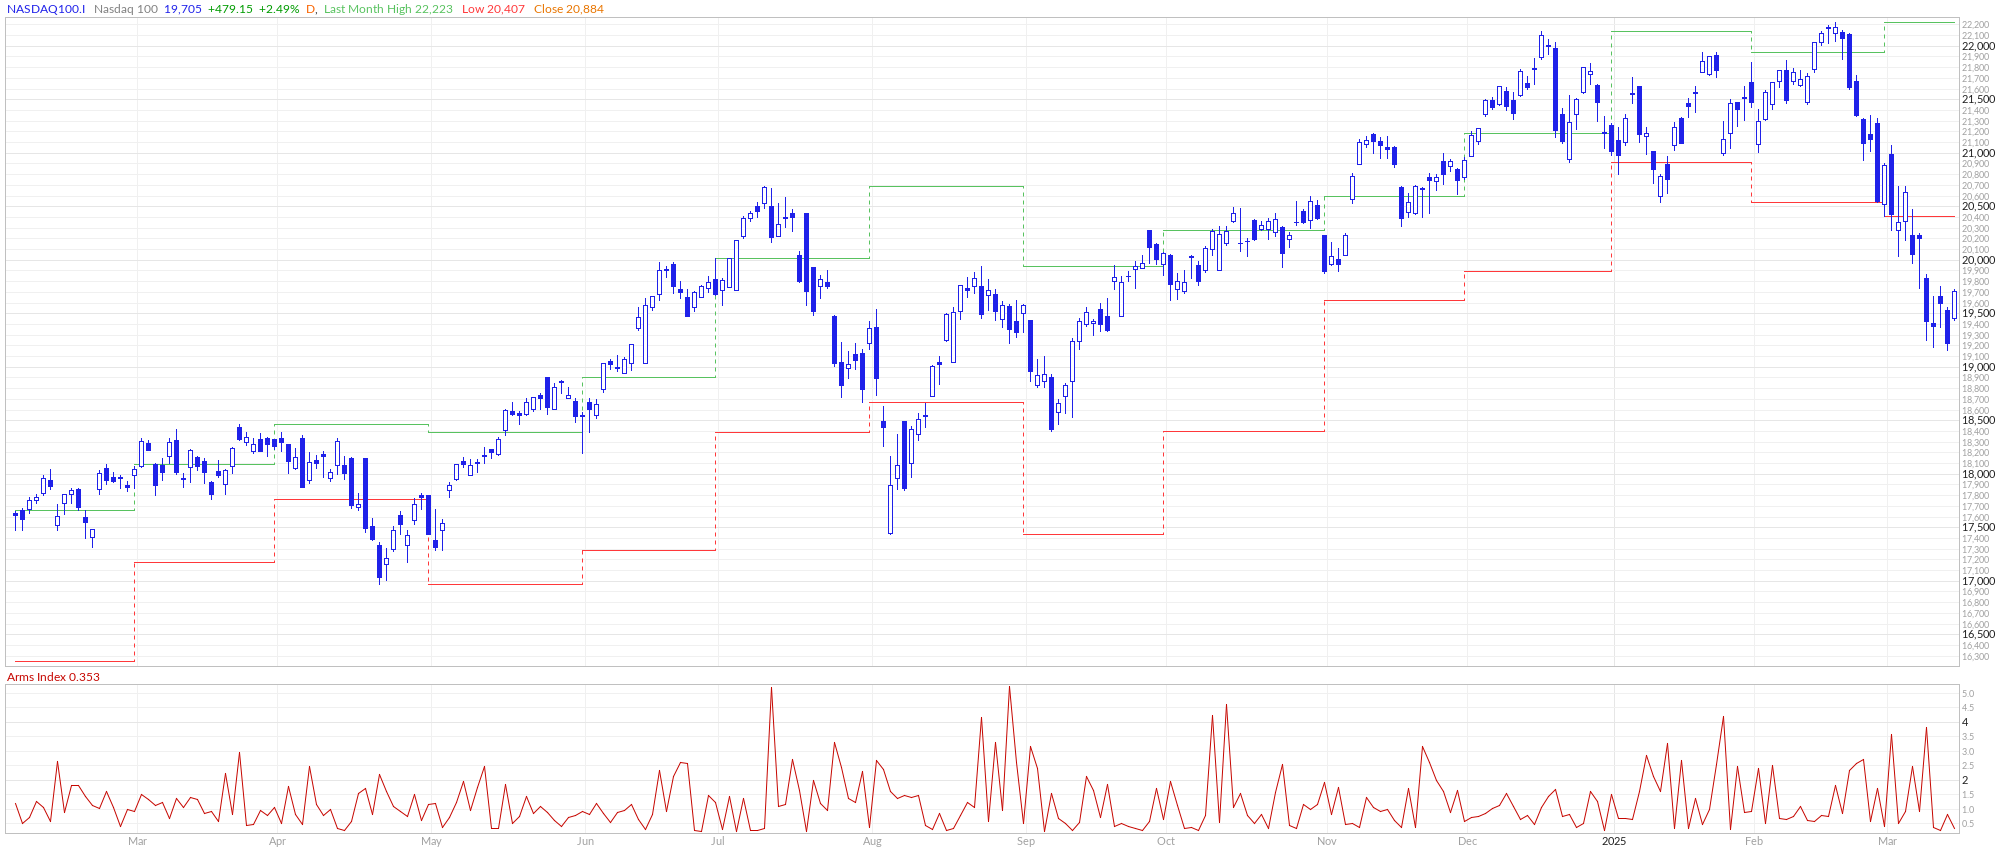
Friday finally produced the technical rebound that various indicators had been suggesting was imminent. The Relative Strength Index had declined below 30 for the first time since October 2023, while the VIX futures curve had inverted into backwardation—both historically reliable signals of oversold conditions. The S&P 500 appreciated 2.13%, the Dow Jones Industrial Average gained 1.65%, and the Nasdaq Composite outperformed with a 2.49% advance.

Despite Friday's recovery, every major U.S. equity index has now entered negative territory for 2025, with the S&P 500 down 4.4% year-to-date, representing approximately $5 trillion in eroded market capitalization since February's peak. This correction represents a significant reversal after nearly two years of extraordinary market appreciation.
Trade Policy Implications and Tariff Dynamics
The predominant catalyst for market volatility remains the escalation of trade tensions and tariff implementation. Tuesday's announcement of 25% tariffs on Canadian and Mexican imports, combined with the doubling of Chinese tariffs from 10% to 20%, generated significant uncertainty regarding global supply chains and corporate profitability. The administration further reinforced its protectionist stance by reiterating the April 2 deadline for implementing reciprocal tariffs on additional foreign nations.
The mid-week period witnessed predictable retaliatory measures from trading partners. The European Union implemented tariffs on $28.3 billion of U.S. exports, including agricultural products such as soybeans, beef, and poultry. Canada responded with 25% counter-tariffs on approximately $20.8 billion of U.S. products spanning computers to sporting goods. China subsequently announced retaliatory tariffs on roughly $22 billion of U.S. goods, with particular focus on agricultural exports.
This escalating sequence of reciprocal trade barriers has generated substantial concern regarding potential disruption to global commerce and economic growth trajectories. Several corporate executives have begun citing "uncertainty" as justification for downward guidance revisions. This phenomenon warrants close monitoring for potential expansion into a broader pre-announcement trend as first-quarter earnings season approaches.
The administration appears committed to its trade agenda despite market volatility. References to a "period of transition" for the U.S. economy suggest an acknowledgment of near-term disruption in pursuit of longer-term policy objectives. The critical analytical questions center on the duration and magnitude of this transitional period.
Inflation Metrics and Monetary Policy Outlook
Wednesday's Consumer Price Index data, which would typically represent the focal point of market analysis, was largely overshadowed by trade policy developments. Nevertheless, the metrics demonstrated continued disinflationary progress. Headline CPI increased 0.2% month-over-month and 2.8% year-over-year, both marginally below consensus expectations and significantly reduced from January's readings of 0.5% and 3.0%, respectively.
Core CPI moderated to 0.3% month-over-month and 3.1% year-over-year, again below forecasts and January's elevated readings of 0.4% and 3.3%. Importantly, both goods and services components showed disinflationary momentum.
In the goods category, new vehicle prices unexpectedly declined 0.1% despite the potential for tariff-related price increases, while used vehicle prices moderated substantially. Services inflation demonstrated cooling shelter costs at 0.3% versus the previous 0.4%, while transportation services declined 0.8% as airline prices contracted 4%. Motor vehicle insurance, which has been a persistent inflationary component, moderated to a 0.3% increase from the previous month's 2% surge.
The Producer Price Index data released Thursday reinforced the disinflationary trend, with the headline figure flat month-over-month and the core component actually declining 0.1%. Notably, approximately two-thirds of the increase in the final demand index was attributable to egg prices, representing a highly concentrated rather than broad-based inflationary pressure.
Market participants largely discounted the improving inflation metrics for two primary reasons: expectations for Federal Reserve policy accommodation have shifted dramatically amid the evolving economic uncertainty, and certain Personal Consumption Expenditures components within these reports (notably medical insurance and portfolio management fees) did not demonstrate commensurate disinflationary progress.
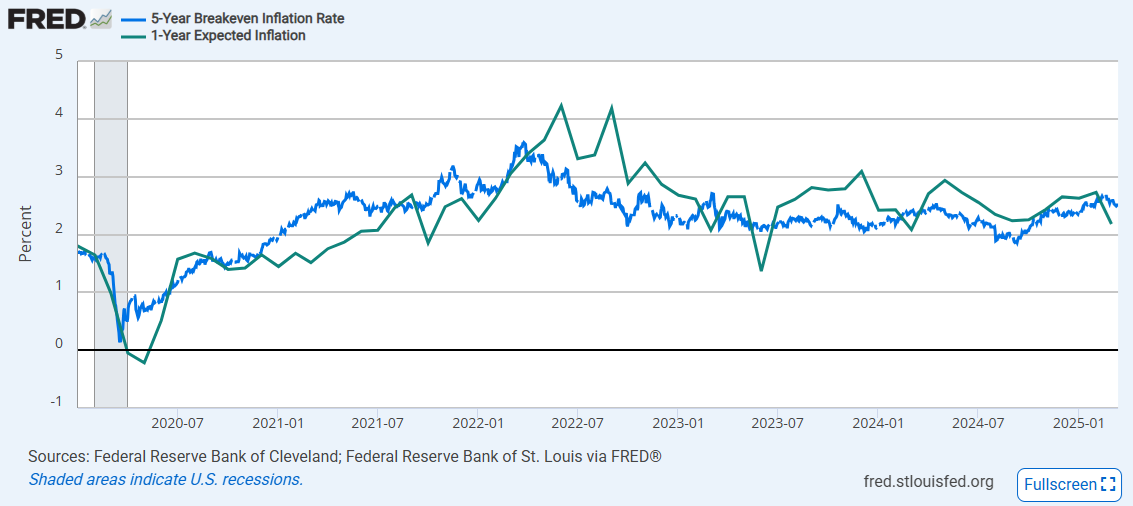
The most problematic development for monetary policy appeared in Friday's University of Michigan consumer survey. Consumer sentiment declined for the third consecutive month, effectively reversing all improvements from the latter half of 2024. More concerning, inflation expectations increased substantially—one-year expectations advanced to 4.9% from 4.3%, while five-year expectations rose to 3.9% from 3.5%. This trend is particularly notable as it occurred despite declining oil prices, which typically correlate strongly with inflation expectations.
The Federal Open Market Committee convenes next week (March 18-19), though monetary policy has diminished in relative importance amid the current market focus on trade policy. Rate cut expectations have been dramatically recalibrated, with markets now pricing 1-2 reductions for 2025 compared to 6+ cuts anticipated in January. The committee is universally expected to maintain current policy rates, with Chair Powell likely to maintain consistent messaging regarding the solid economic foundation, acknowledgment of increased uncertainty, continued monitoring of inflation trends, and a deliberate approach to policy adjustments.
The forthcoming Summary of Economic Projections will provide updated forecasts, though substantial deviation from the previous dot plot indication of two rate cuts this year appears unlikely. Commentary regarding the timeline for reducing quantitative tightening, currently anticipated around mid-year, remains a potential variable of interest.
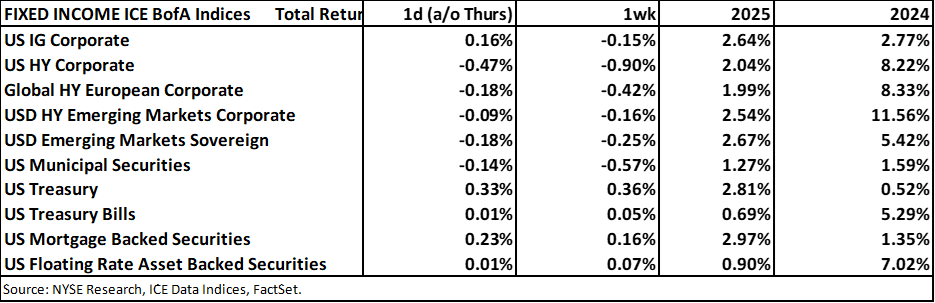
Fixed Income Market Dynamics
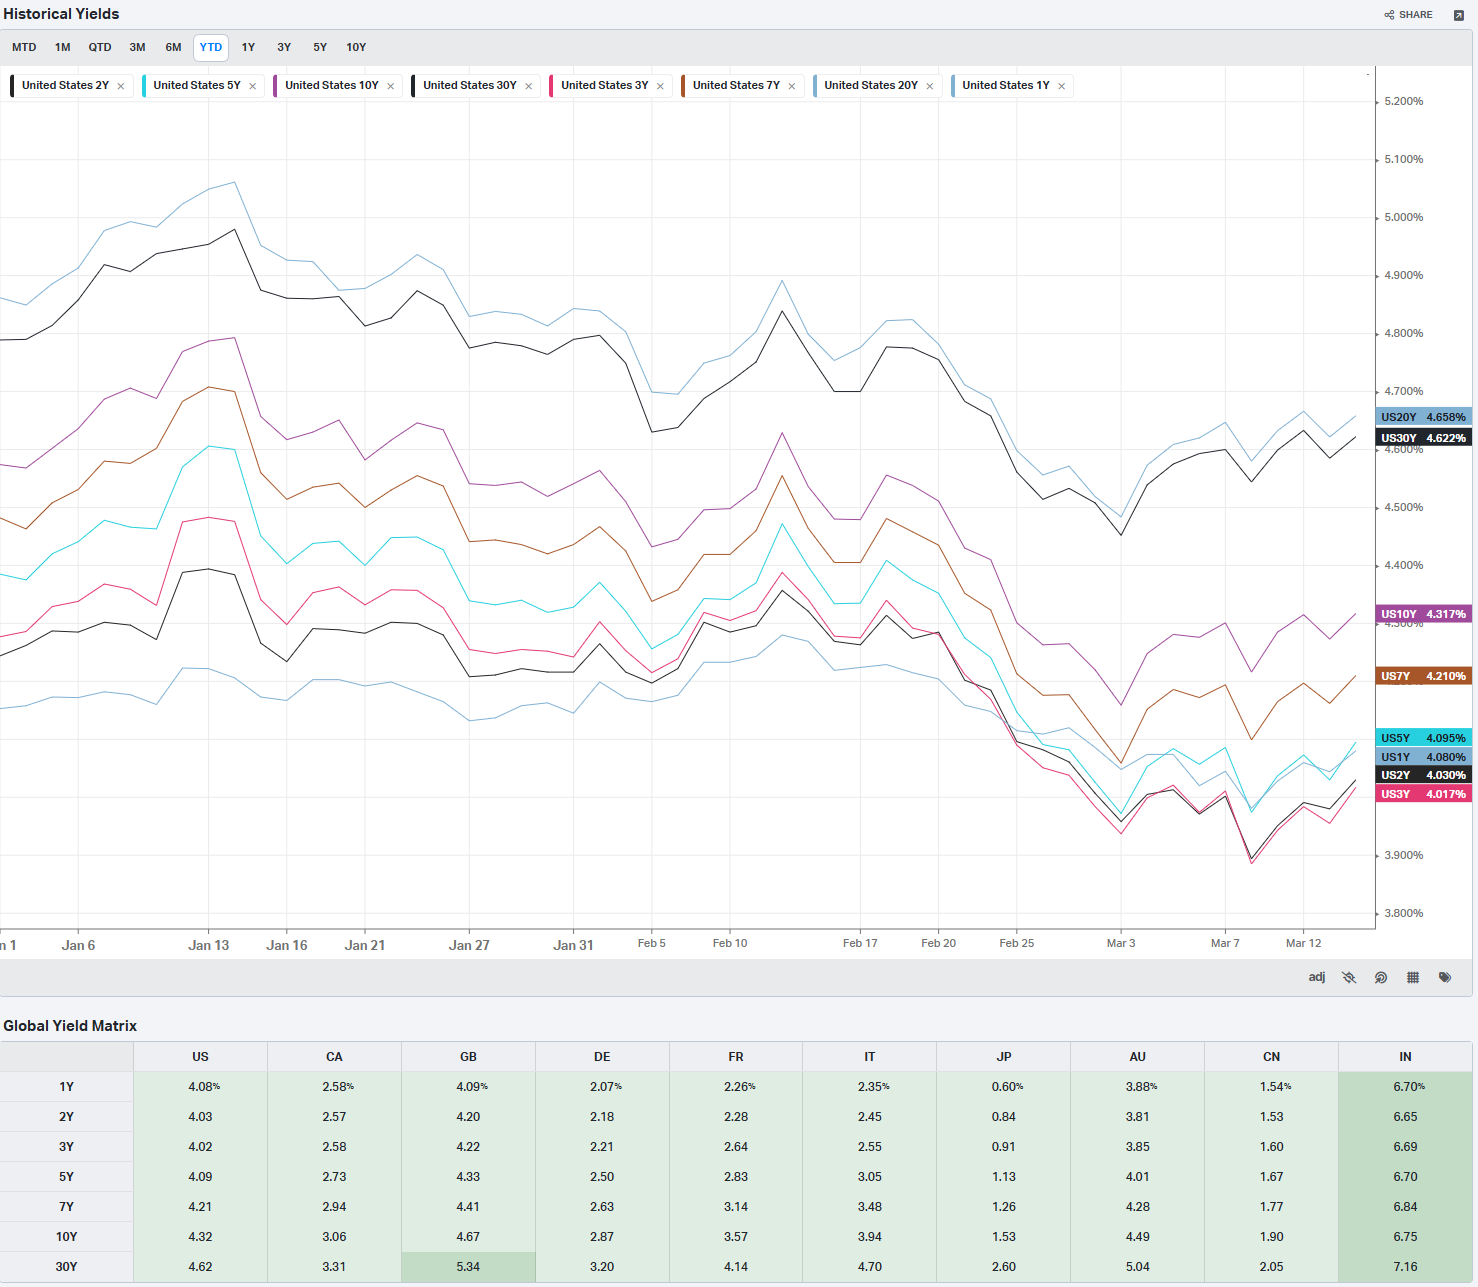
Treasury yields have stabilized following their recent decline, concluding essentially unchanged for the week. The 10-year yield settled at 4.314% after appreciating 4.6 basis points on Friday. The fixed income market's behavior has been notable for its divergence from typical correction patterns—despite substantial equity market volatility, Treasury securities have not experienced the conventional flight-to-safety appreciation that typically accompanies equity corrections.
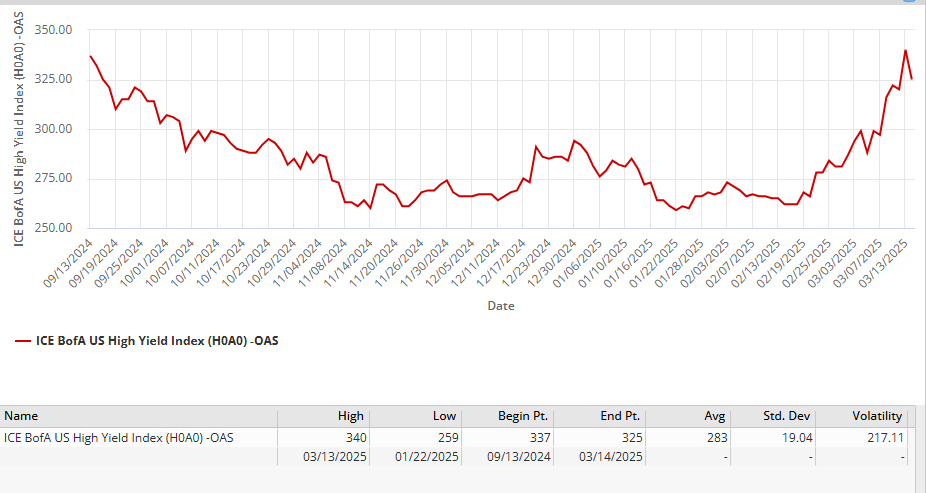
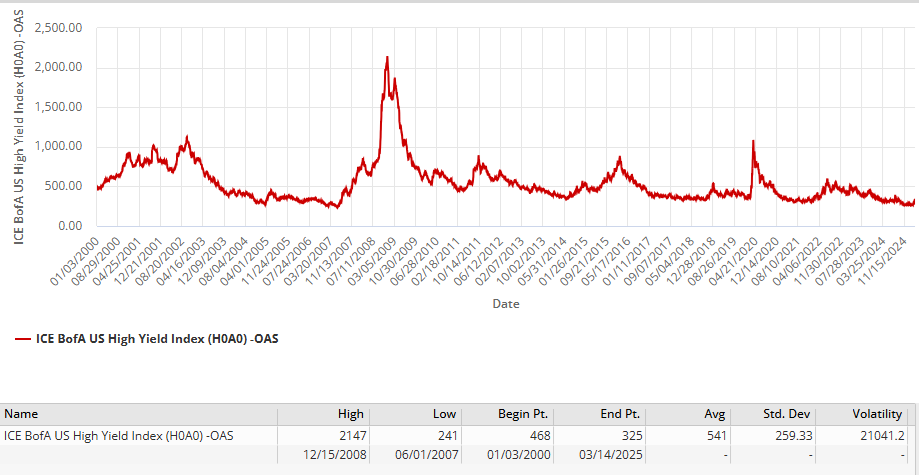
Credit spreads have begun widening, with high-yield option-adjusted spreads expanding toward 370 basis points. While this represents a meaningful adjustment, it remains substantially below distress levels observed during previous correction phases.
European sovereign debt markets presented mixed performance. German 10-year yields increased 2.1 basis points to 2.876% following reports that German chancellor-designate Merz had reached an agreement with the Green party regarding a substantial fiscal reform package targeting infrastructure and defense expenditures. This initiative could potentially inject approximately €500 billion into the German economy. The 10-year UK gilt yield declined 1.1 basis points to 4.666%.
Forward-looking market indicators suggest a 53% probability of a 25 basis point reduction from the European Central Bank at their April 17 policy meeting. ECB Governing Council member Holzmann has advocated for maintaining current rates, suggesting they have already reached neutral levels and that increased European fiscal expenditures could potentially necessitate rate increases if inflation resurges.
International Markets and Currency Dynamics
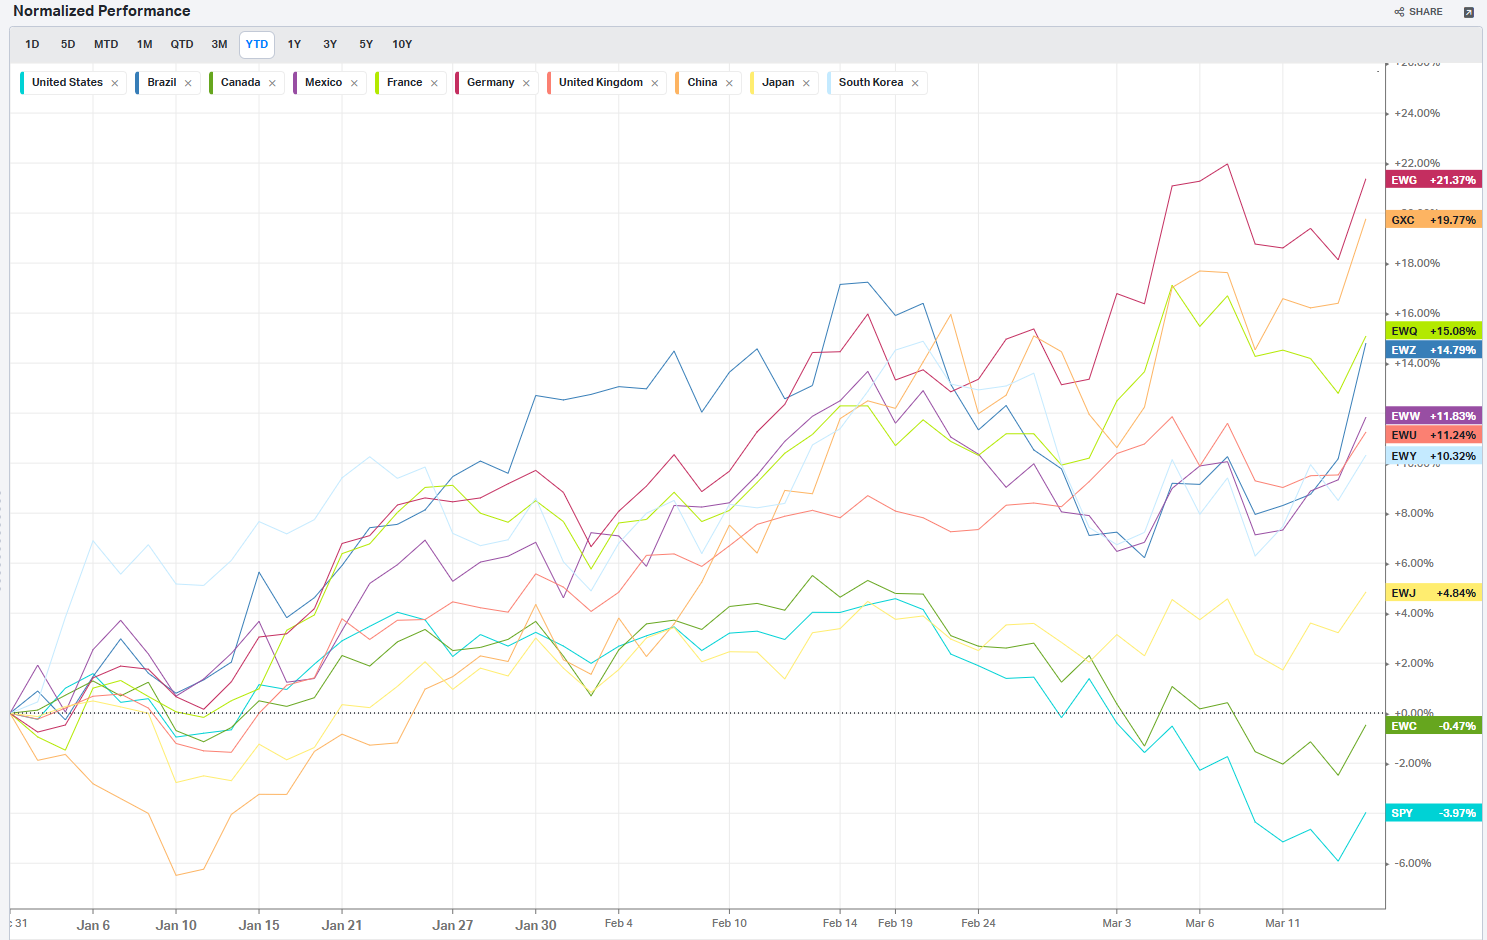
Non-U.S. equity markets have maintained their relative outperformance versus U.S. equities—a persistent trend throughout 2025. Most European indices concluded with modest weekly declines, though the German DAX appreciated nearly 2% on Friday to finish the week unchanged following reports of fiscal package developments.
Asian markets demonstrated relative stability. The most significant development emerged from China, where the CSI 300 index advanced 1.7% weekly, reaching its highest level of 2025. Market sentiment improved on expectations that the People's Bank of China will reduce its reserve requirement ratio in the near term. Chinese officials announced a Monday press conference where they are expected to introduce measures to stimulate domestic consumption—a critical initiative given China's continued deflationary environment, with CPI registering -0.7% year-over-year in February.
The euro maintained stability around 1.09, while gold continued its substantial appreciation, exceeding $3,000 for the first time as investors diversified away from U.S. assets. Bitcoin recovered significantly, concluding the week with a 6.74% gain at $84,654 following an 18-6 Senate banking committee vote to advance a stablecoin bill endorsed by the administration.
Sector Performance Analysis and Equity Highlights
The current correction has fundamentally altered sector leadership patterns from those observed in 2023 and early 2024. Defensive and cyclical sectors now outperform technology and growth components—five of the eleven S&P sectors maintain positive year-to-date performance despite the broader market decline.

Friday's recovery saw the largest technology companies (frequently termed the "Magnificent Seven") advance uniformly, reasserting leadership after leading market declines earlier in the week. Nvidia appreciated more than 5% to lead Dow constituents, while Tesla gained over 3%. Meta Platforms, Microsoft, and Amazon all appreciated more than 2%, with Apple and Alphabet adding more than 1% each.
Semiconductor equities demonstrated significant strength on Friday, with Micron Technology appreciating over 6% following Aletheia Capital's upgrade to buy with a $145 price target. ARM Holdings, Lam Research, Applied Materials, GlobalFoundries, Microchip Technology, and Qualcomm all registered gains between 3% and 6%.
Cryptocurrency-related equities appreciated substantially alongside Bitcoin's recovery. MicroStrategy led Nasdaq 100 constituents with a 13% gain. MARA Holdings advanced more than 7%, while Riot Platforms and Bit Digital both gained over 6%. Coinbase appreciated more than 2%.
Notable earnings-driven performance included DocuSign, which gained over 14% after projecting stronger-than-anticipated 2026 billings. Semtech appreciated more than 20% after exceeding fourth-quarter earnings expectations. Ulta Beauty led S&P 500 constituents, gaining over 13% after substantially exceeding earnings forecasts. Rubrik advanced more than 27% following an optimistic revenue projection.
Among decliners, Abbott Laboratories fell nearly 3% to lead S&P 500 underperformers after a judicial reversal regarding a previous infant formula verdict. T-Mobile declined more than 1% following Citigroup's downgrade to neutral from buy on valuation considerations. The most significant underperformer was Xponential Fitness, which declined 39% after providing below-consensus full-year revenue guidance.
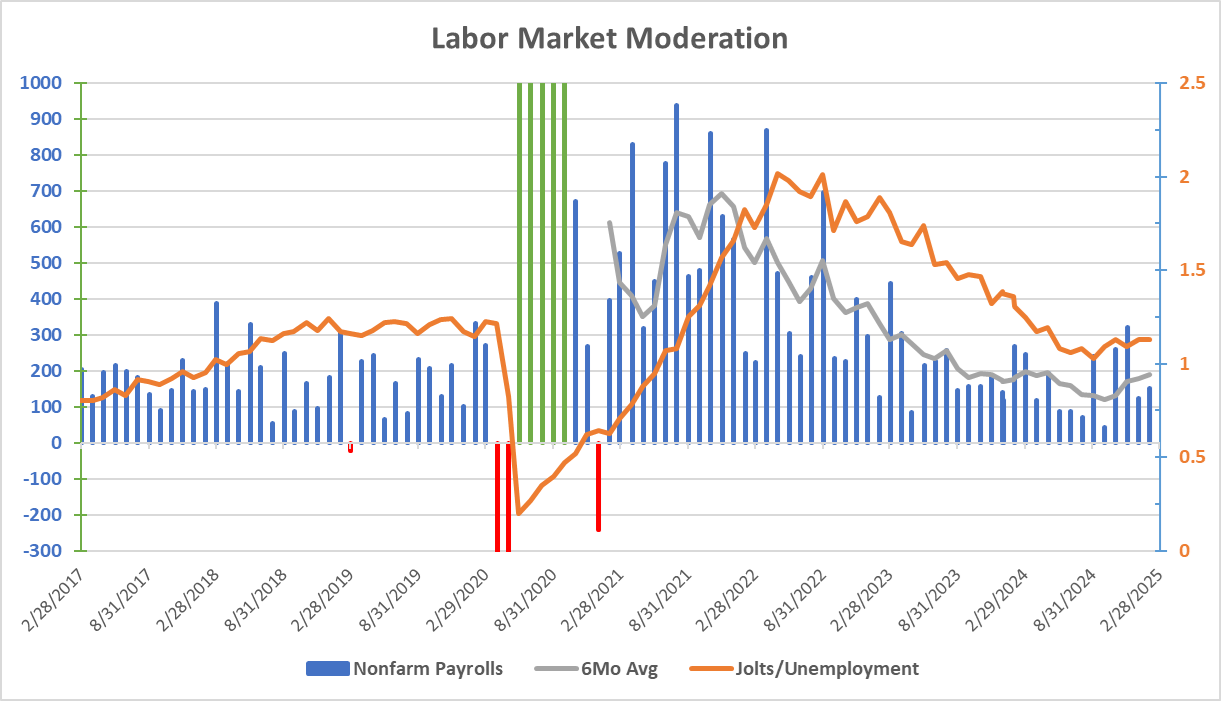
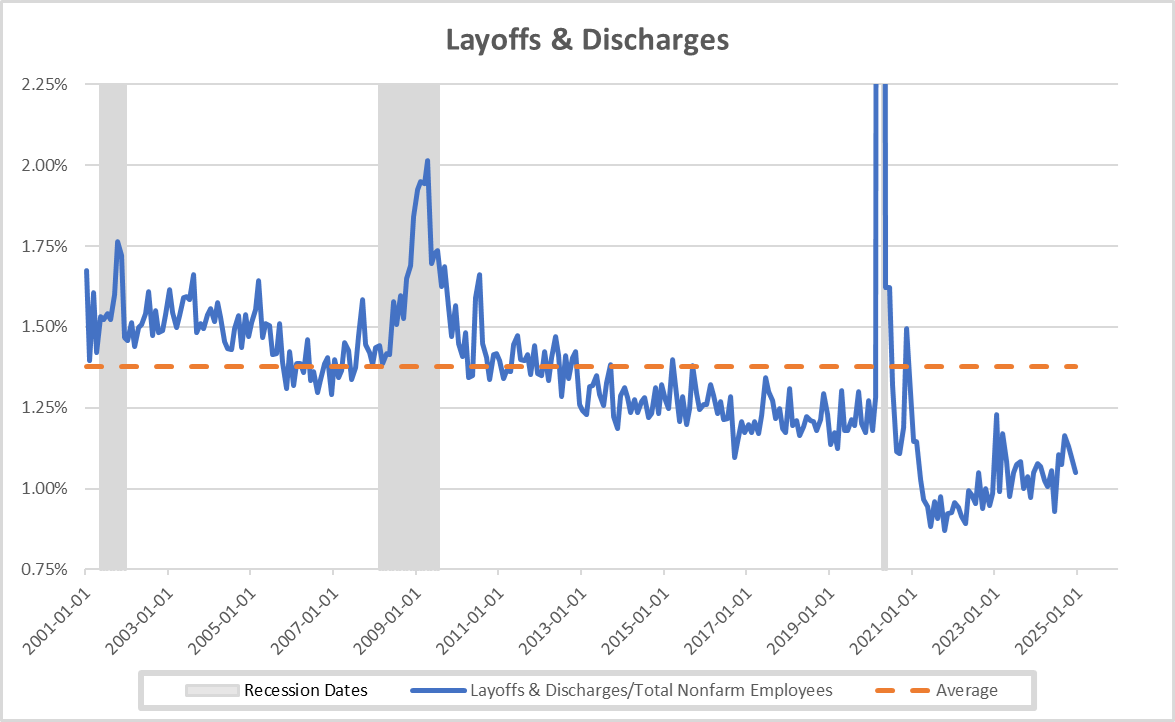
Economic Indicators Assessment
The macroeconomic landscape presents mixed signals. Job openings unexpectedly increased to 7.74 million from 7.51 million, maintaining the ratio of openings to unemployed workers near pre-pandemic levels. Separations declined modestly and remain substantially below twenty-year averages. Initial unemployment claims stabilized around 220,000 while continuing claims moderately decreased. These metrics collectively suggest no material deterioration in labor market conditions.
However, concerning indicators have emerged regarding economic growth. The United Kingdom economy unexpectedly contracted 0.1% in January, contradicting forecasts for 0.1% expansion. Key economic forecasters have revised U.S. growth projections downward from 2.4% to 1.7%, primarily attributable to deteriorating tariff-related assumptions.
The Bank of Canada reduced its policy rate by 25 basis points to 2.75%, with policymakers specifically identifying the U.S.-Canada trade dispute as a "new crisis" affecting consumer expenditures and business investment. Their assessment was unambiguous: "monetary policy cannot offset the impacts of a trade war."
Corporate Developments
Beyond quarterly results, several significant corporate developments emerged this week. Taiwan Semiconductor Manufacturing is reportedly negotiating with U.S. semiconductor designers, including Nvidia and Broadcom, regarding potential equity participation in a joint venture to operate Intel's fabrication facilities—a potentially transformative restructuring of the semiconductor industry landscape.
The Federal Trade Commission is advancing an antitrust investigation of Microsoft initiated during the final phase of the previous administration. Regulators have required disclosure of data regarding Microsoft's artificial intelligence operations, introducing additional regulatory uncertainty to an already volatile technology sector.
Crown Castle appreciated over 8% after announcing agreements to divest portions of its fiber business to an EQT AB fund and Zayo Group Holdings for a combined $8.5 billion.
American Express gained over 3% following Baird's upgrade to neutral from underperform.
Market Technical Analysis
Technical indicators reached extreme levels during the week. The 16-day sequence of 1%+ intraday ranges represents the longest such period in recent years, and the VIX briefly approached 30 before moderating to approximately 22 by week's end. The Relative Strength Index on the S&P 500 declined below 30 mid-week for the first time since October 2023, signaling an oversold condition that historically precedes at least short-term recovery.
The VIX futures curve inverted into backwardation—indicating traders were paying premium for near-term protection versus longer-dated instruments—another historical marker of extreme risk aversion that frequently signals potential capitulation.
If the market can sustain positive momentum into Monday's session, it would represent the first consecutive positive sessions since mid-February, illustrating the persistent selling pressure of recent weeks.
Forward Outlook: First-Quarter Earnings Season Implications
With approximately one month remaining before first-quarter earnings reporting begins, markets have entered the critical pre-announcement period. Several sell-side investor conferences are scheduled for next week, along with significant earnings reports from FedEx, Lennar, Micron Technology, and Nike that could establish directional sentiment.
Valuations were elevated entering 2025, but were accompanied by substantial earnings expectations. At the conclusion of the fourth quarter, consensus projections indicated approximately 15% year-over-year earnings growth for companies in both the S&P 400 and 500. Despite generally positive fourth-quarter results, companies issued conservative forward guidance given the uncertain environment. This caution precipitated negative estimate revisions, with growth projections now reduced to approximately 12% for the S&P 500 and 9% for mid-capitalization companies.
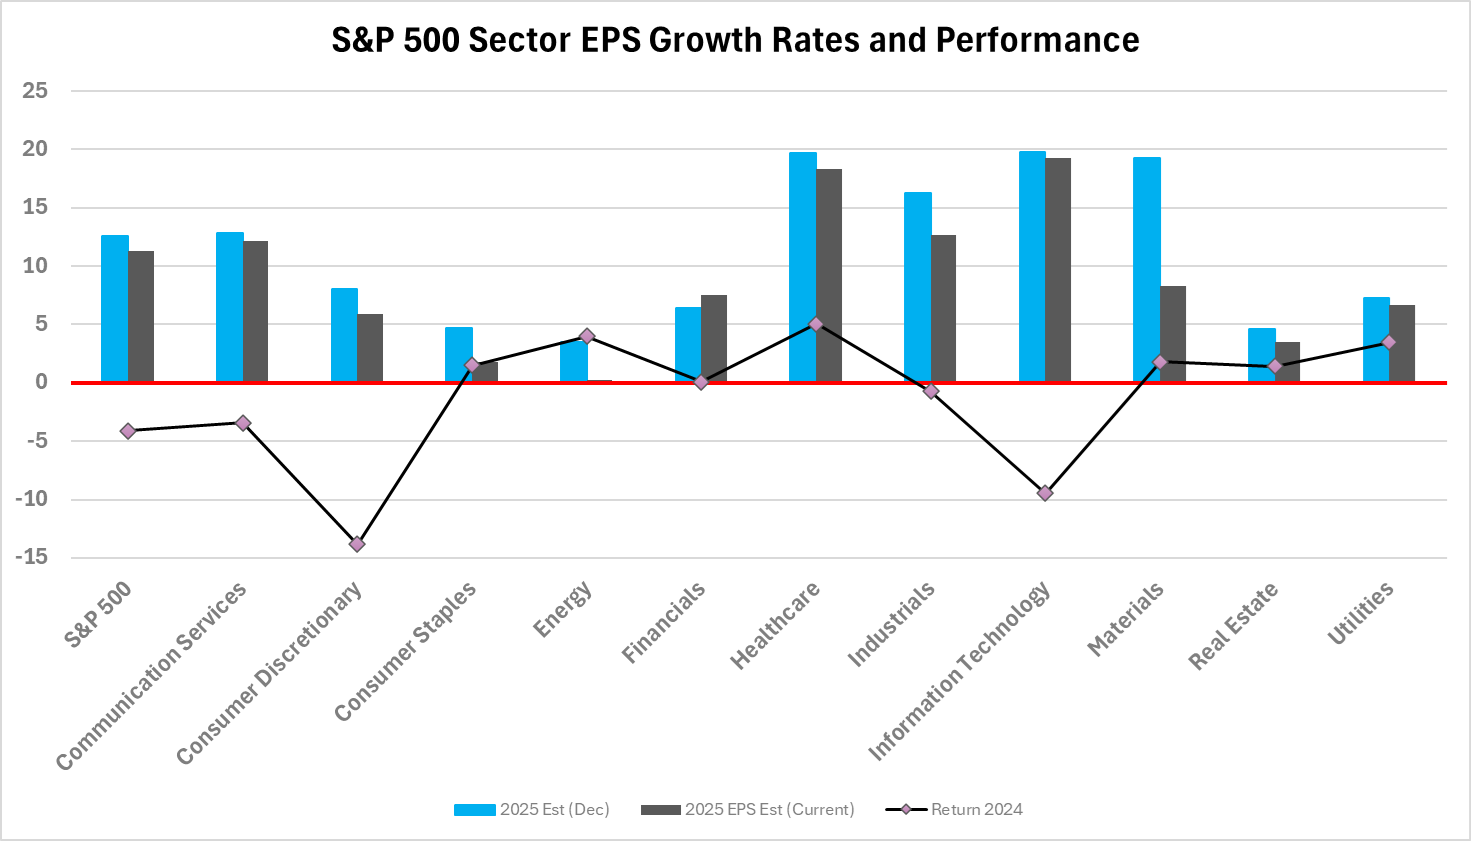
A potential wave of negative pre-announcements in coming weeks would necessitate further downward estimate revisions. This week may represent the initial phase of such a trend, with multiple companies explicitly citing deteriorating consumer and corporate confidence as justification for guidance reductions.
Portfolio Positioning Strategy
Following two years of robust performance driven predominantly by large-capitalization technology and artificial intelligence themes, 2025 has abruptly underscored the importance of diversification. While broader U.S. equities have turned negative, several market segments have demonstrated resilience:
Defensive and cyclical sectors within domestic markets
Fixed income securities, which have outperformed equities year-to-date
International equities, particularly European markets and Chinese technology companies

The EuroStoxx index maintains a year-to-date appreciation exceeding 10%, benefiting from relatively attractive valuations, central bank policy accommodation, and renewed fiscal stimulus initiatives. Even a conventional 60-40 portfolio allocation has substantially outperformed the S&P 500 this year, providing meaningful downside protection during the correction phase.

For investors with extended time horizons, these market dislocations—while challenging—create potential opportunities for strategic rebalancing or selective additions across diversified asset classes. Within U.S. sectors, healthcare and financials appear particularly well-positioned should the administration implement anticipated deregulation and tax policy initiatives in coming quarters.

In fixed income markets, extending duration remains strategically attractive, particularly if 10-year Treasury yields approach 4.5%. Bond allocations will likely maintain their dual function as income generators and portfolio diversifiers as the Federal Reserve potentially initiates rate reductions later this year.

Week Ahead: Key Variable Monitoring
The Federal Open Market Committee meeting will generate substantial commentary, though as previously discussed, is unlikely to produce significant policy surprises. Market participants will scrutinize guidance regarding quantitative tightening and analyze the updated economic projections and dot plot forecasts.
Key economic data releases include:
Initial Unemployment Claims
Mortgage Applications
Retail Sales Advance
Industrial Production
Housing Starts
Existing Home Sales
However, market direction will likely continue to be primarily determined by trade policy developments and potential corporate pre-announcements ahead of earnings season. After Friday's recovery, the critical question remains whether markets have experienced genuine capitulation or merely a technical rebound within an ongoing correction phase.
Without conciliatory trade policy communications from Washington, any relief rally could prove ephemeral. The most telling aspect of Friday's recovery was the absence of additional negative policy headlines that might have undermined market sentiment—a significant indicator of current market sensitivity to trade policy developments.
Continued volatility appears probable in the coming week as markets attempt to establish a sustainable equilibrium amid evolving policy and economic conditions.
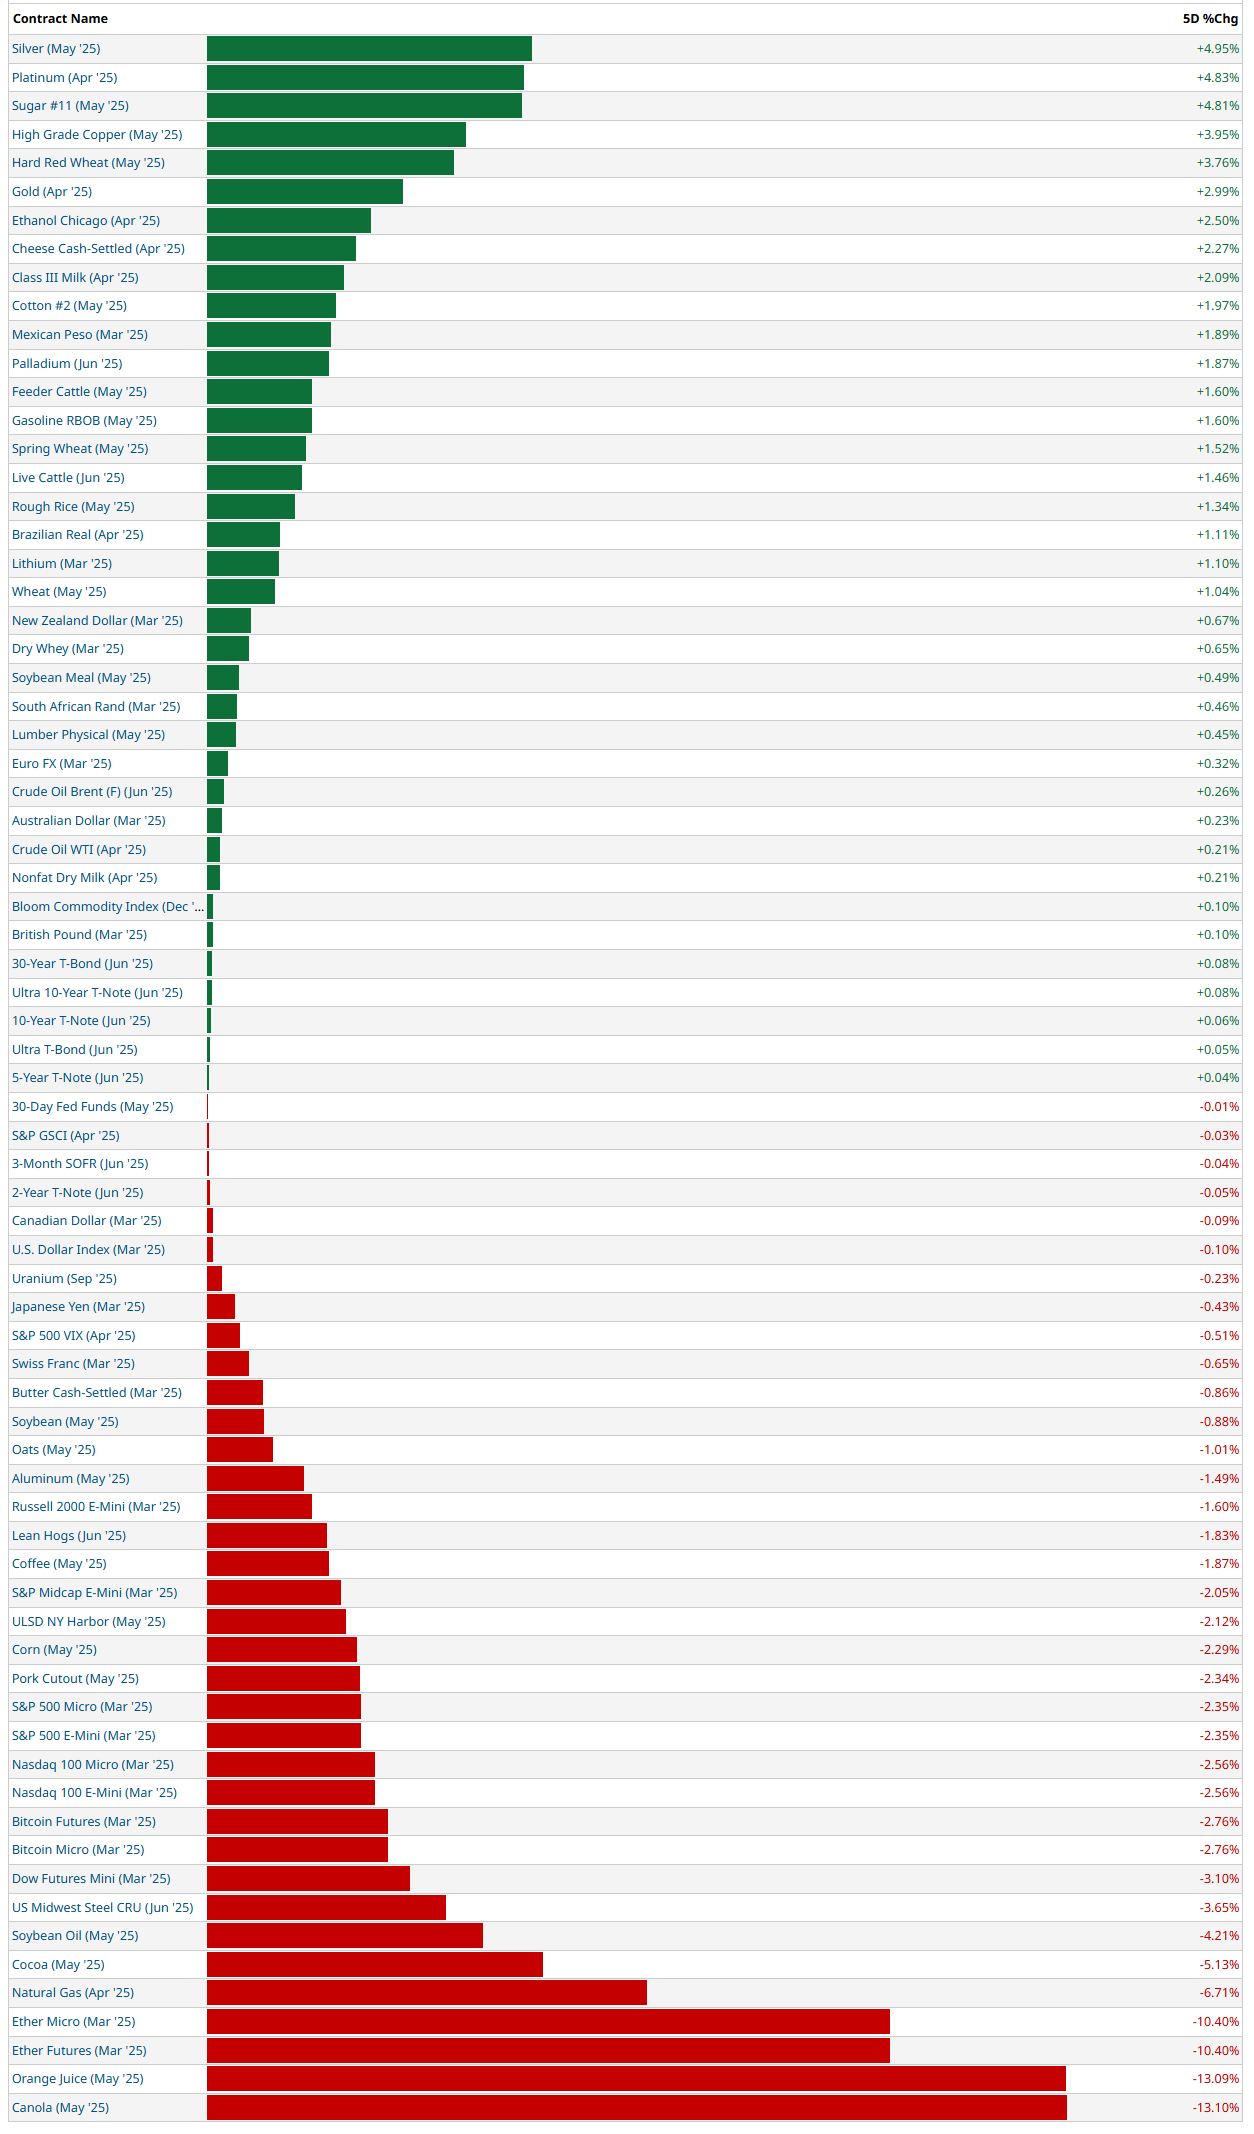
5-Day Futures Performance Leaders
S&P 500 Sector Insights
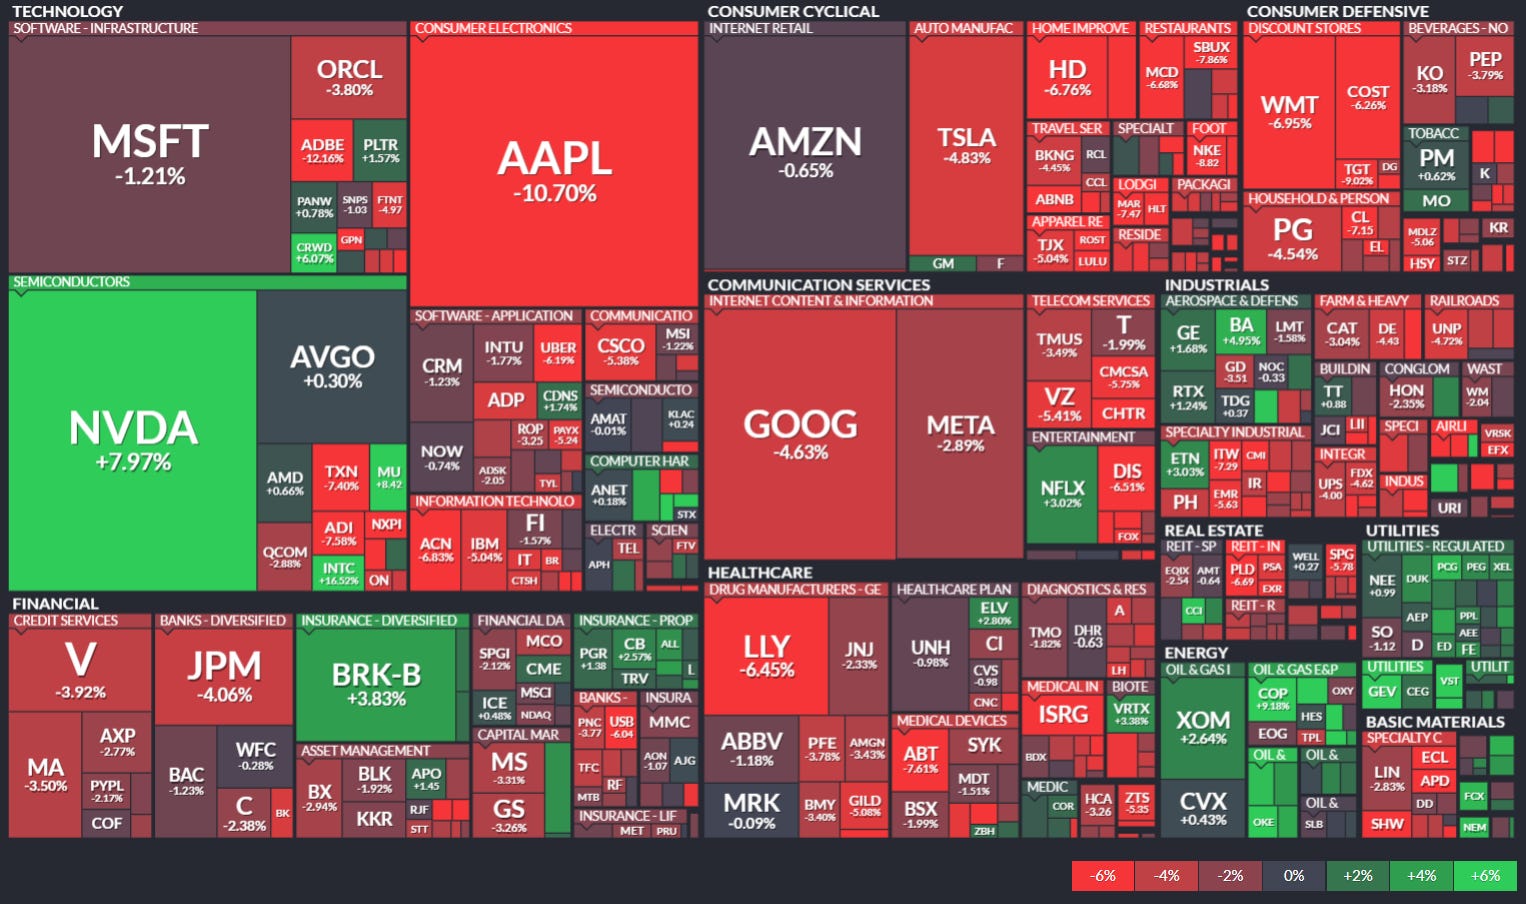
Tech Sector Divergence: There's a significant split in technology performance. NVIDIA ( NVDA 0.00%↑ ) is up strongly at +7.97%, while Apple ( AAPL 0.00%↑ ) is down considerably at -10.70%. This suggests a potential rotation within tech, with semiconductor stocks outperforming consumer tech.
Market Weakness Overall: A broadly negative week for the markets many stocks falling between -2% and -6%.
Consumer Sectors Under Pressure: Consumer-related stocks are showing particular weakness:
Home Depot ( HD 0.00%↑ ) down -6.76%
Walmart ( WMT 0.00%↑ ) down -6.95%
Costco ( COST 0.00%↑ ) down -6.20%
Consumer Electronics category also showing broad declines
Defensive Sector Resilience: Some traditionally defensive sectors like utilities are an island of green in a sea of red, suggesting investors may be rotating to safety.
Financial Weakness: Major financial institutions like JPMorgan ( JPM 0.00%↑ , -4.06%) and Visa ( V 0.00%↑ , -3.92%) are down significantly, indicating potential concerns about economic growth or interest rate impacts.
Berkshire Hathaway (BRK-B) stands out as one of the few large-cap companies in the green at +3.83%, showing investor flight to perceived quality and stability.
Big Tech Mixed: The "Magnificent Seven" tech stocks show mixed performance:
NVIDIA (+7.97%) is strongly positive
Amazon ( AMZN 0.00%↑ ) is relatively flat at +0.65%
Google/Alphabet ( GOOG 0.00%↑ ), Microsoft ( MSFT 0.00%↑ ), Meta ( META 0.00%↑ ) , and Apple all down
Healthcare Weakness: Healthcare stocks like Eli Lilly ( LLY 0.00%↑ , -6.45%) are showing significant declines.
In broad stroked, this appears to be a risk-off week with investors favoring select semiconductor stocks and defensive positions while selling consumer-focused companies, suggesting concerns about consumer spending and possibly the broader economic outlook.
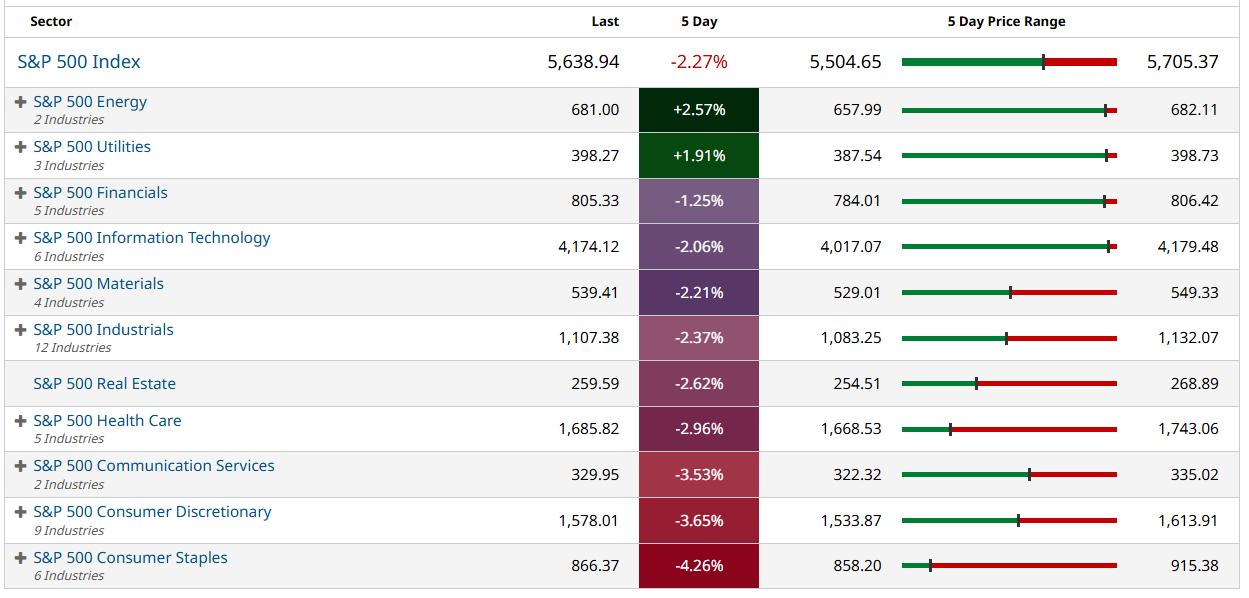
5-Day Sector Leaderboard
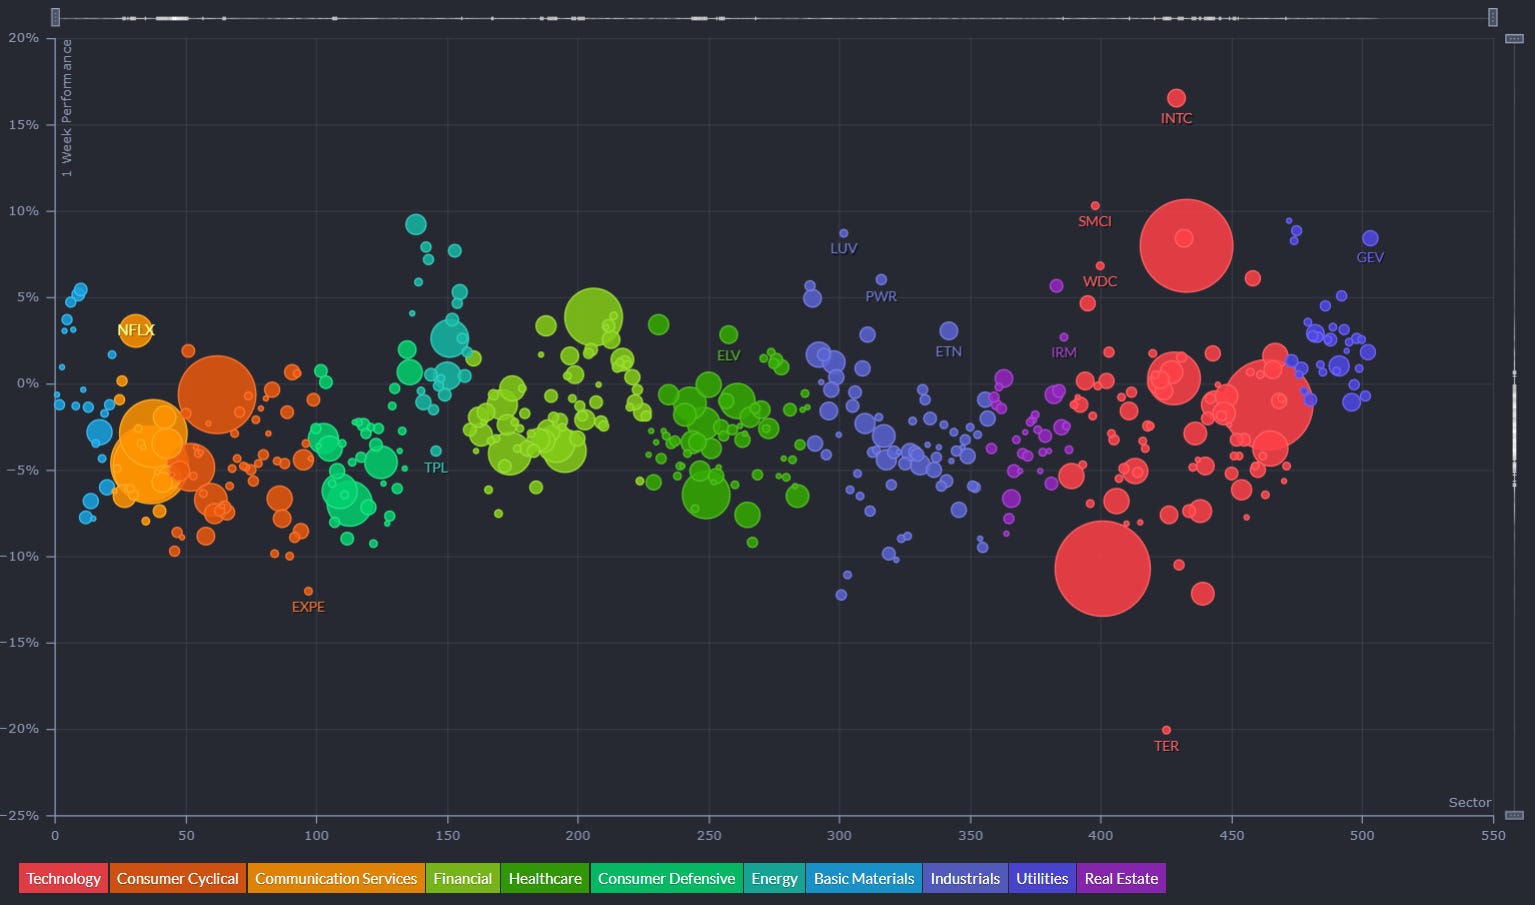
5-Day Individual Performance Grouped By Sector (Size By Market Cap)
ETF Insights
Reviewing a heatmap like this weekly can be incredibly helpful for investors as it provides a quick and visual summary of market performance across various sectors, asset classes, and geographies.
1. Sector and Asset Class Trends
Identify Strong and Weak Sectors: Investors can quickly spot which sectors (e.g., technology, energy, healthcare) are performing well or underperforming.
Asset Class Diversification: Seeing how commodities, fixed income, equities, and cryptocurrencies performed helps assess diversification.
2. Market Sentiment
Risk-On or Risk-Off: A green-dominated map suggests bullish sentiment, while red indicates bearish sentiment. Investors can align their strategies accordingly.
Volatility Indicators: Observing movements in volatility indices (e.g., VIX) can highlight changing market dynamics.
3. Regional Analysis
Global Insights: Performance in developed and emerging markets (e.g., Europe, China, Asia-Pacific) helps in gauging international investment opportunities or risks.
Currency Impacts: Movements in forex or country-specific ETFs can indicate currency-driven market trends.
4. Thematic Trends
Growth vs. Value: Comparing the performance of growth ETFs (e.g., VUG) versus value ETFs (e.g., VTV) reveals the prevailing market preference.
Industry Leadership: Highlighting leadership within industries (e.g., gold miners, semiconductors) can inform thematic plays.
5. Monitoring Investments
Portfolio Alignment: Investors can track how their existing investments or watchlist align with broader market trends.
Rotation Signals: Seeing week-over-week changes in sector dominance may signal sector rotation opportunities.
6. Risk Management
Recognizing Overbought/Oversold Conditions: Consistent underperformance or overperformance in specific areas may indicate potential mean-reversion trades.
Correlation Awareness: By observing how different asset classes move, investors can manage portfolio correlation and risk.
7. Decision Support
Identify Outperformers/Underperformers: ETFs, sectors, or indices that repeatedly outperform or underperform can help refine trading or investment strategies.
Macro Perspective: Weekly trends highlight macroeconomic or geopolitical influences affecting markets.
Regularly reviewing a heatmap like this is a strategic practice that supports data-driven decision-making while fostering a holistic understanding of market dynamics.
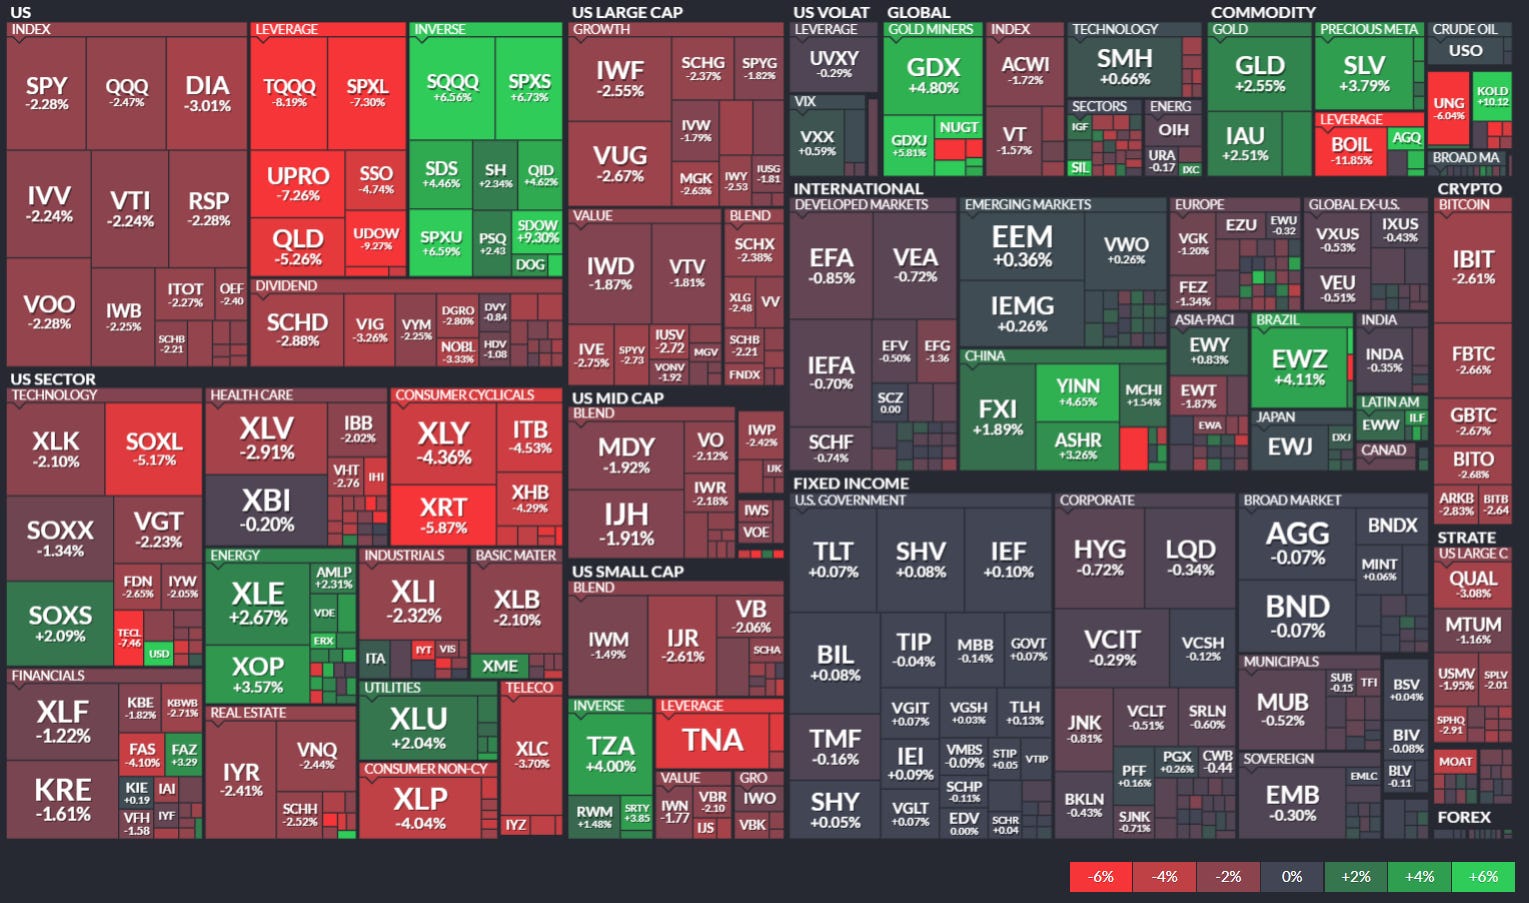
Broad Market Weakness: Major index ETFs like SPY (-2.28%), QQQ (-2.47%), and DIA (-3.01%) are all showing significant declines, indicating a broadly negative week across US markets.
Inverse ETFs Still Performing Well: The green boxes in the "INVERSE" section (SQQQ +15.56%, SPXS +16.73%) show strong performance from bearish/short ETFs, confirming the downward market pressure.
Energy Sector Strength: Energy ETFs like XLE (+2.67%) and XOP (+3.14%) are among the few sectors showing positive performance, suggesting strength in energy stocks despite broader market weakness.
Precious Metals Rising: Gold and silver ETFs are continue performing well (GLD +2.55%, SLV +3.79%, IAU +2.51%), indicating a flight to traditional safe haven assets.
Oil Weakness: The crude oil section shows significant declines (USO -5.69%, BOIL -11.85%), showing a divergence between energy stocks and the underlying commodity.
Fixed Income Stability: Treasury and fixed income ETFs (TLT, SHV, IEF, BIL) are mostly flat to slightly positive, suggesting they're providing relative stability as equities decline.
Global Market Divergence: China exposure (YINN +6.65%, FXI +1.89%) and India (EWZ +4.11%) are showing strength while most developed international markets are down.
Sector Rotation: Consumer sectors (XLY, XRT, XLP) are showing significant weakness, while utilities (XLU) are declining less severely, indicating continued defensive positioning.
Volatility Up: The VXX ETF is up 0.39% on the week, showing persistent market fear/volatility.
Cryptocurrency Weakness: Crypto-related ETFs (IBIT -2.61%, GBTC -2.67%) are down, aligning with the broader risk-off sentiment.
Overall, we have a clear risk-off environment with investors moving away from equities (especially consumer and tech) toward traditional defensive assets like gold, silver, and selective energy positions, while also placing bets on emerging markets like China and India.
Global Overview
Foreign ADR stocks listed on NYSE, NASDAQ & AMEX categorized by geographic location. Reviewing a global heatmap like this weekly is valuable for investors because it offers insights into international markets, helping to:
Identify Global Trends: Spot which regions or countries are performing well or underperforming.
Assess Sector and Regional Performance: Understand how industries are faring across different regions.
Diversify Portfolios: Uncover opportunities in emerging or developed markets for greater diversification.
Gauge Global Sentiment: Recognize the impact of macroeconomic events on specific regions.
Align with Global Strategies: Refine investment strategies based on regional strengths or weaknesses.
This overview ensures investors stay informed about global opportunities and risks, complementing their domestic market analysis.
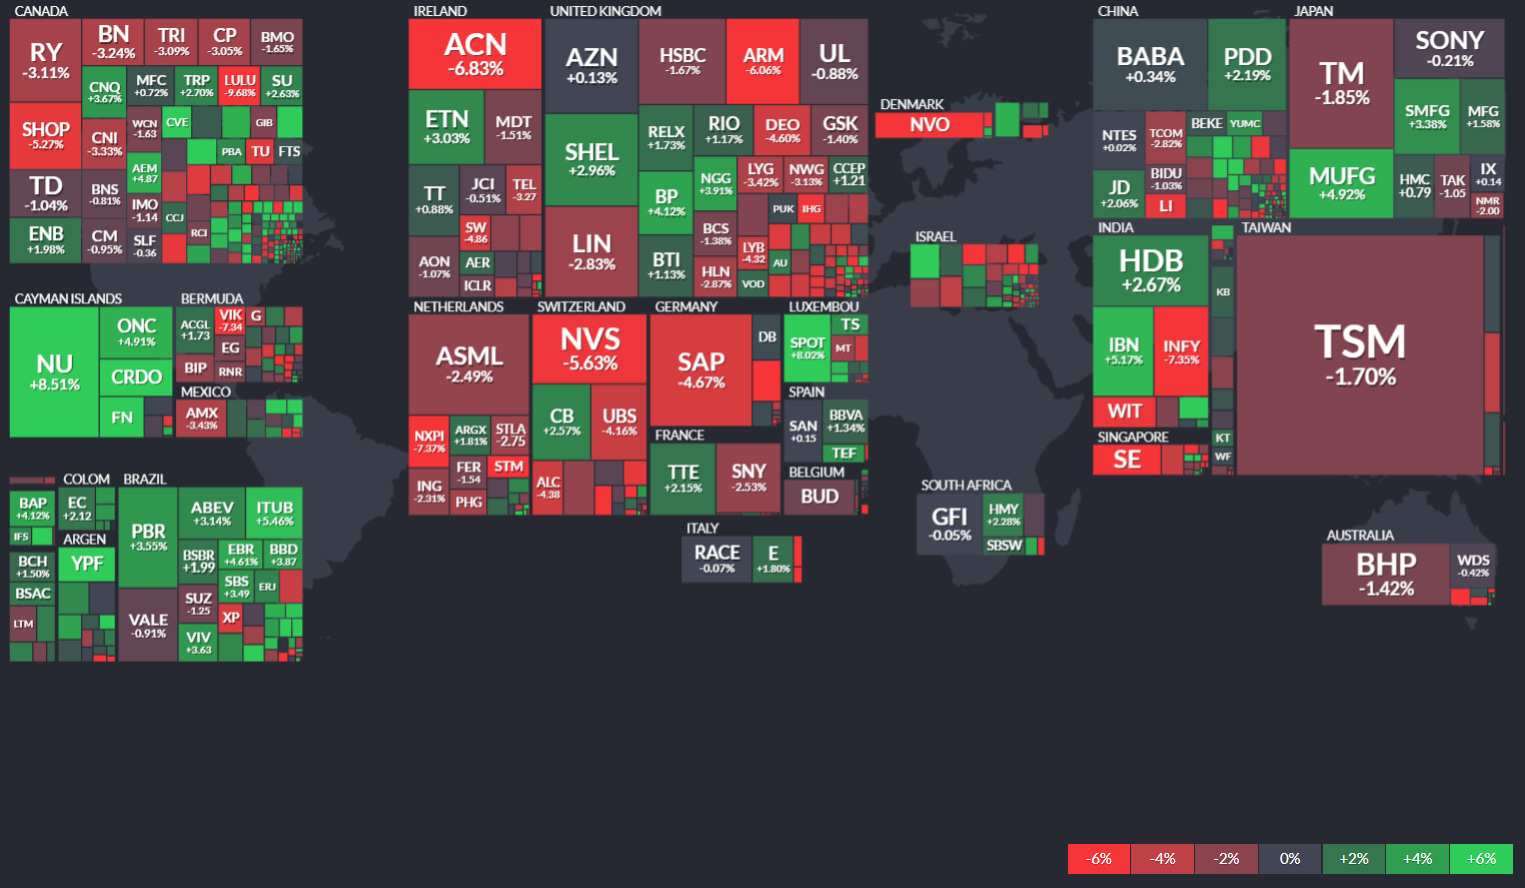
Regional Divergence: There's significant variation between different regions:
Latin American stocks (Brazil, Argentina) show considerable strength
European markets (particularly Germany, Netherlands, Ireland) show weakness
Asian markets are mixed with notable strength in select Chinese and Indian stocks
Standout Performers:
NU 0.00%↑ (Nubank from Cayman Islands) is up significantly at +8.51%
HDB 0.00%↑ (HDFC Bank from India) showing strong performance at +2.67%
PDD 0.00%↑ (PDD Holdings from China) up +2.19%
Several Brazilian stocks like ITUB 0.00%↑ (+5.16%), ABEV 0.00%↑ (+4.14%), and PBR 0.00%↑ (+3.95%) showing strength
Notable Decliners:
ACN 0.00%↑ (Accenture from Ireland) down -6.83%
NVS 0.00%↑ (Novartis from Switzerland) down -5.63%
INFY 0.00%↑ (Infosys from India) down -7.35%
SAP 0.00%↑ (SAP SE from Germany) down -4.67%
NXPI 0.00%↑ (NXP Semiconductors from Netherlands) down -7.39%
Sector Patterns:
Energy companies like BP 0.00%↑ (+4.12%), SHEL 0.00%↑ (+2.96%), and YPF 0.00%↑ (+4.90%) performing well
Financial services mixed with some strength in emerging markets (HDB, ITUB) but weakness in European banks
Technology showing weakness, particularly European tech (SAP, ASML, NVS)
Emerging Markets Outperforming: Generally stronger performance in emerging market stocks compared to developed markets, with Brazil, India, and select Chinese stocks showing particular strength
Canadian Weakness: Most major Canadian stocks (RY, BN, TD, ENB) are down, aligning with broader North American market weakness
Chinese Tech Mixed: Alibaba ( BABA 0.00%↑ ) slightly positive while JD.com is up more significantly, but other Chinese tech firms show varied performance
Luxury/Consumer Goods Pressure: European luxury brands and consumer companies showing weakness
This global ADR heatmap confirms a rotation toward emerging markets and energy stocks, while showing continued pressure on technology and financial stocks in developed markets. The pattern suggests investors are seeking value and growth opportunities in select emerging markets while reducing exposure to European stocks.

US Investor Sentiment
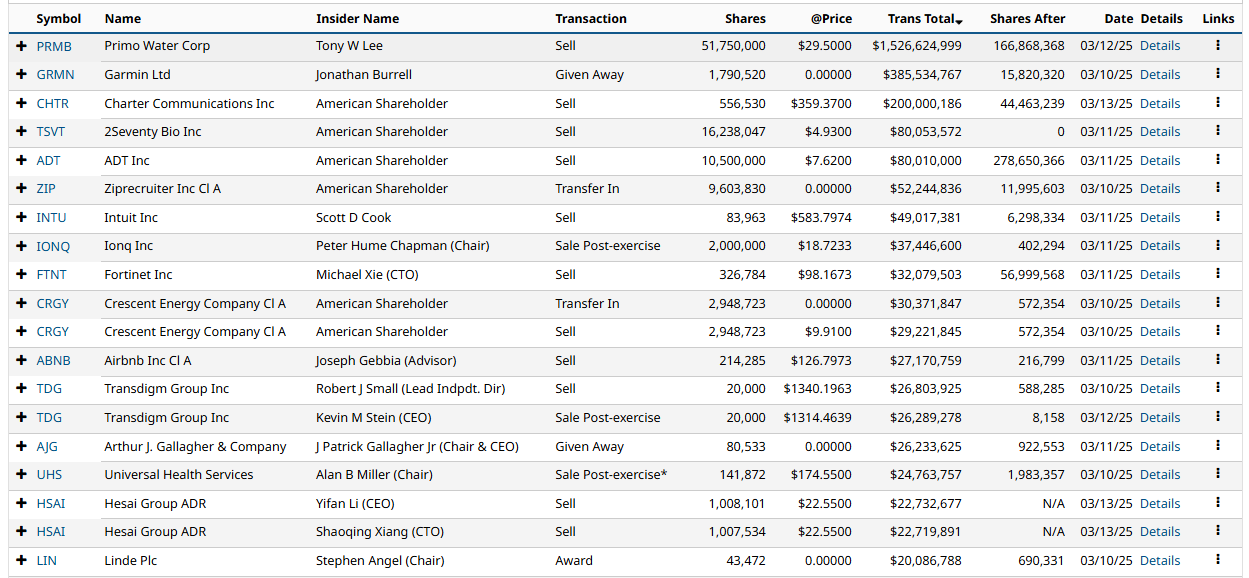
Insider Trading
Insider trading occurs when a company’s leaders or major shareholders trade stock based on non-public information. Tracking these trades can reveal insider expectations about the company’s future. For example, large purchases before an earnings report or drug trial results might indicate confidence in upcoming good news.
%Bull-Bear Spread
The %Bull-Bear Spread chart is a sentiment indicator that shows the difference between the percentage of bullish and bearish investors, often derived from surveys or sentiment data, such as the AAII (American Association of Individual Investors) sentiment survey. This spread tells investors about the prevailing mood in the market and can provide insights into market extremes and potential turning points.
Bullish or Bearish Sentiment:
When the spread is positive, it means more investors are bullish than bearish, indicating optimism about the market’s direction.
A negative spread indicates more bearish sentiment, meaning more investors expect the market to decline.
Contrarian Indicator:
The %Bull-Bear Spread is often used as a contrarian indicator. For example, extremely high levels of bullish sentiment might suggest that the market is overly optimistic and could be due for a correction.
Similarly, when bearish sentiment is extremely high, it might indicate that the market is overly pessimistic, and a rally could be on the horizon.
Market Extremes and Reversals:
Historically, extreme values of the spread (both positive and negative) can signal turning points in the market. A very high positive spread can signal market exuberance, while a very low or negative spread may indicate fear or capitulation.
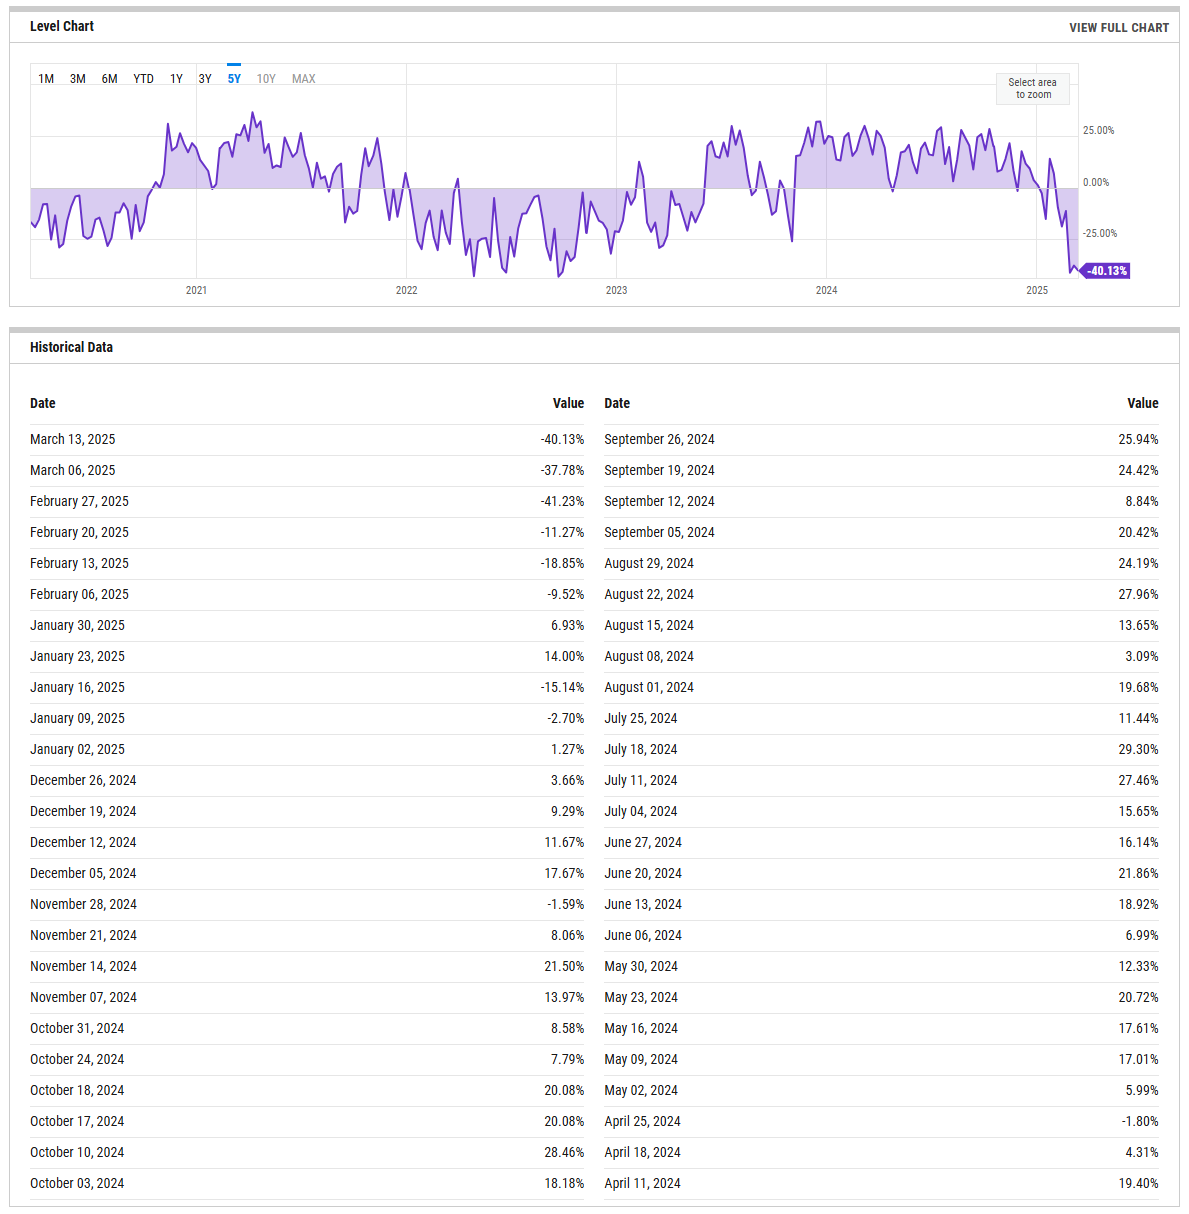
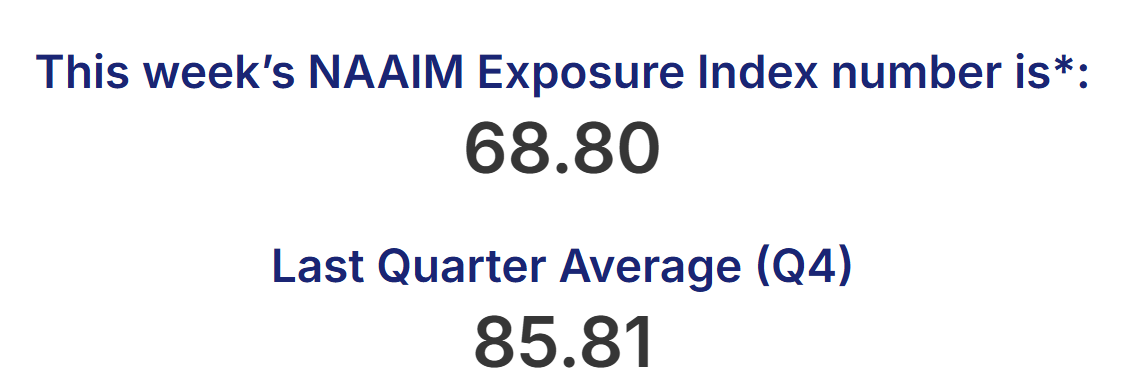
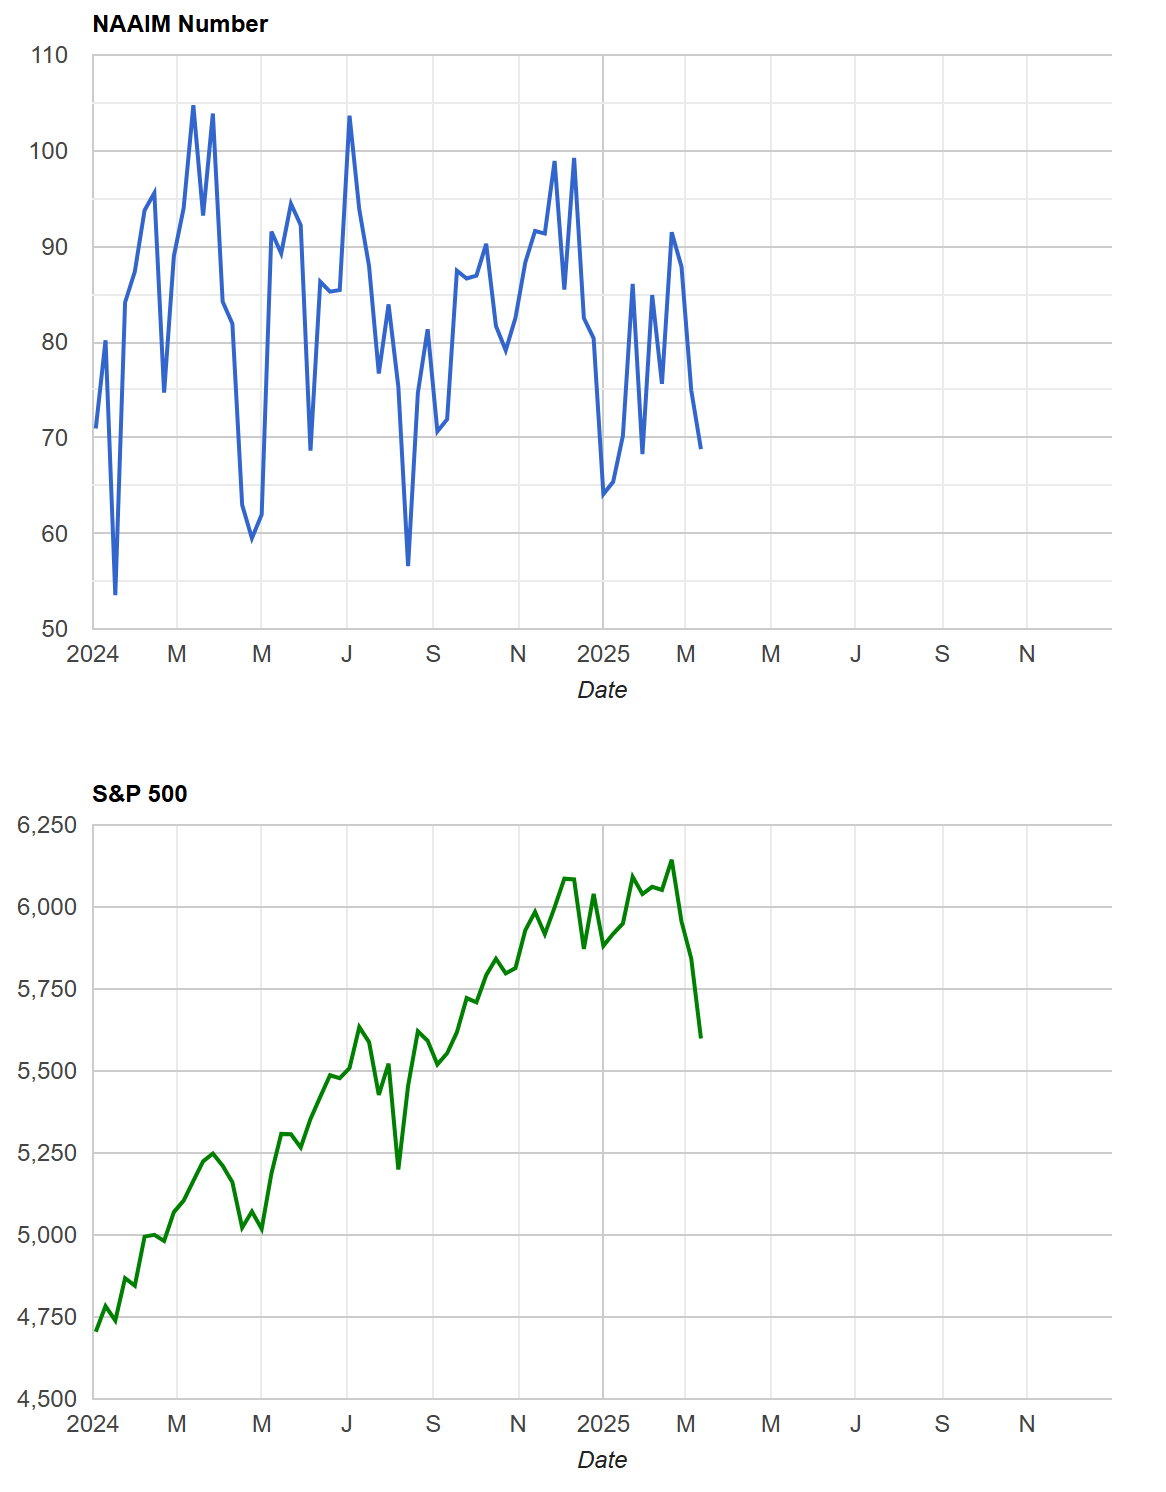
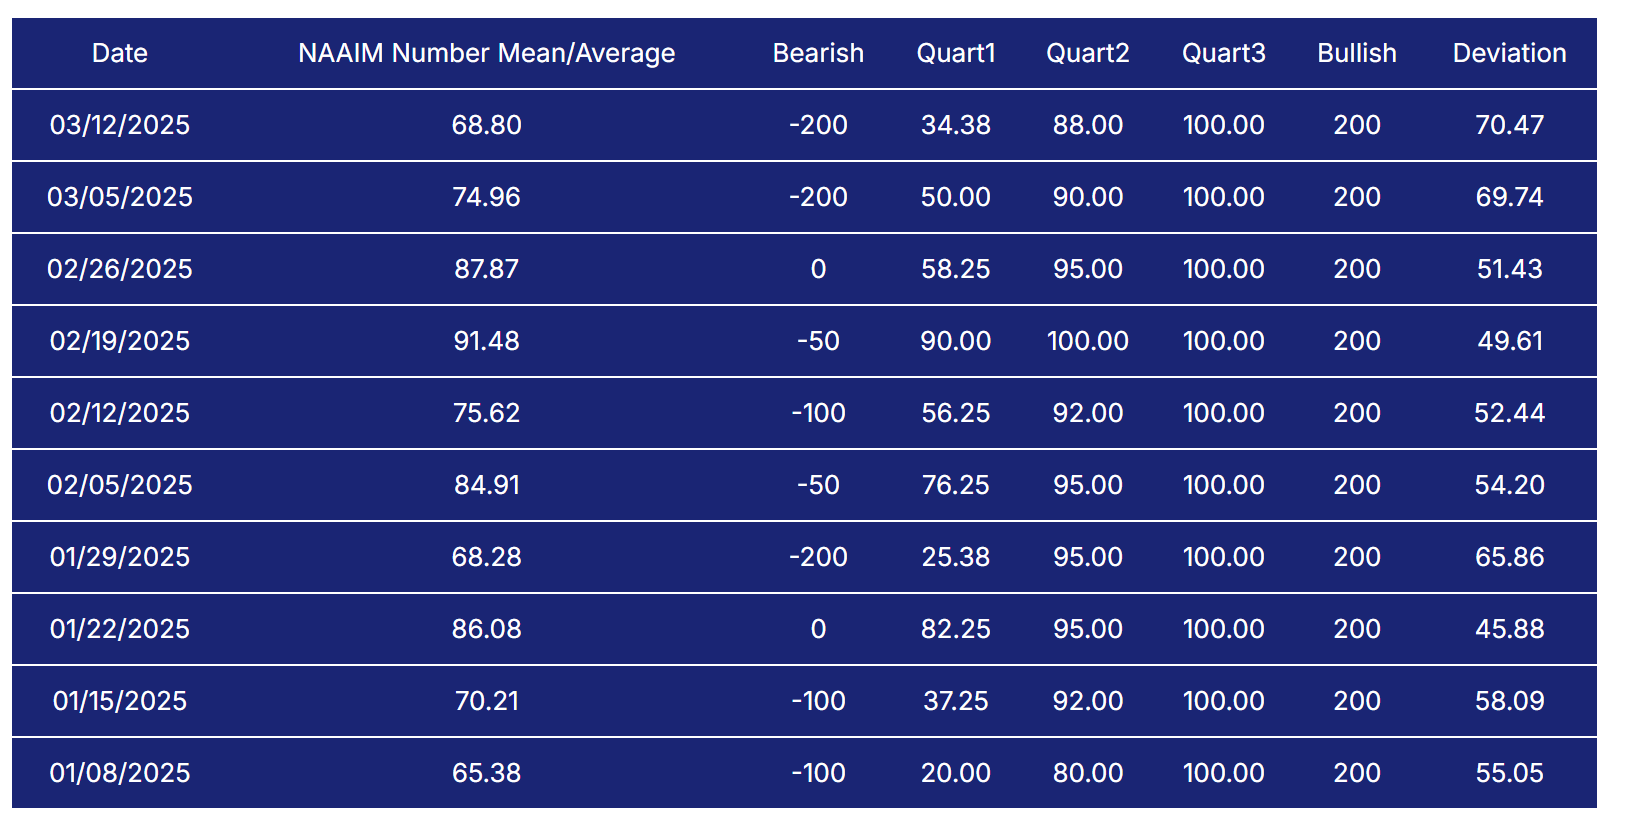
NAAIM Exposure Index
The NAAIM Exposure Index (National Association of Active Investment Managers Exposure Index) measures the average exposure to U.S. equity markets as reported by its member firms. These are typically active money managers who provide their equity exposure levels weekly. The index offers insight into how much these managers are investing in equities at any given time, ranging from being fully short (-100%) to leveraged long (up to +200%).
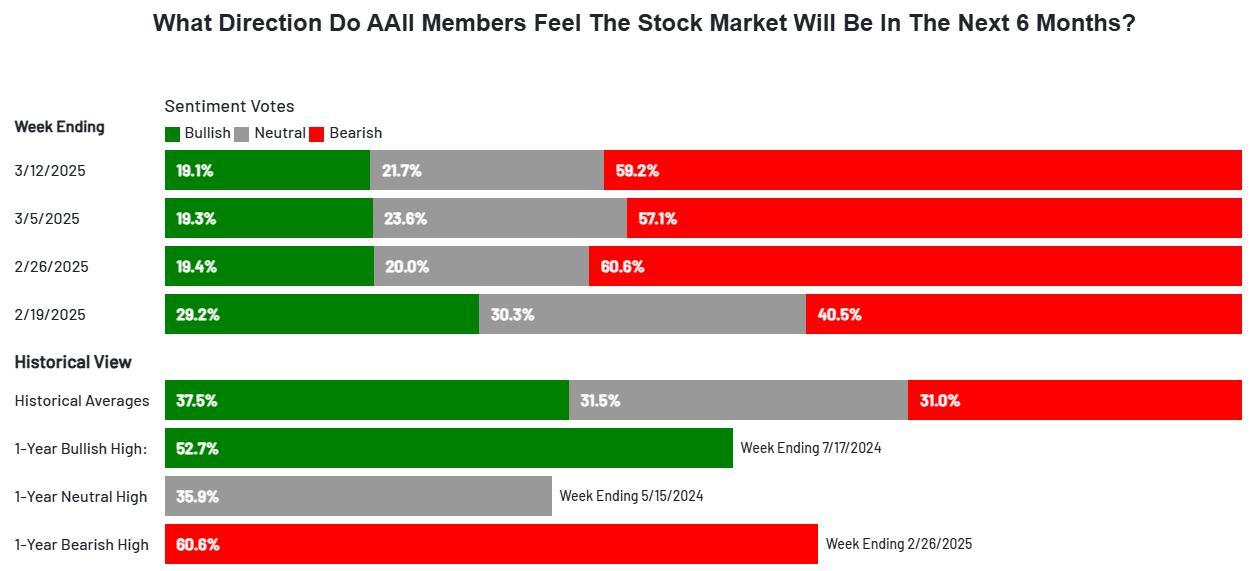
AAII Investor Sentiment Survey
The AAII Investor Sentiment Survey is a weekly survey conducted by the American Association of Individual Investors (AAII) to gauge the mood of individual investors regarding the direction of the stock market over the next six months. It provides insights into whether investors are feeling bullish (expecting the market to rise), bearish (expecting the market to fall), or neutral (expecting the market to stay about the same).
Key Points:
Bullish Sentiment: Reflects the percentage of investors who believe the stock market will rise in the next six months.
Bearish Sentiment: Represents those who expect a decline.
Neutral Sentiment: Reflects investors who anticipate little to no market movement.
The survey is widely followed as a contrarian indicator, meaning that extreme levels of bullishness or bearishness can sometimes signal market turning points. For example, when a large number of investors are overly optimistic (high bullish sentiment), it could suggest a market top, while excessive pessimism (high bearish sentiment) may indicate a market bottom is near.
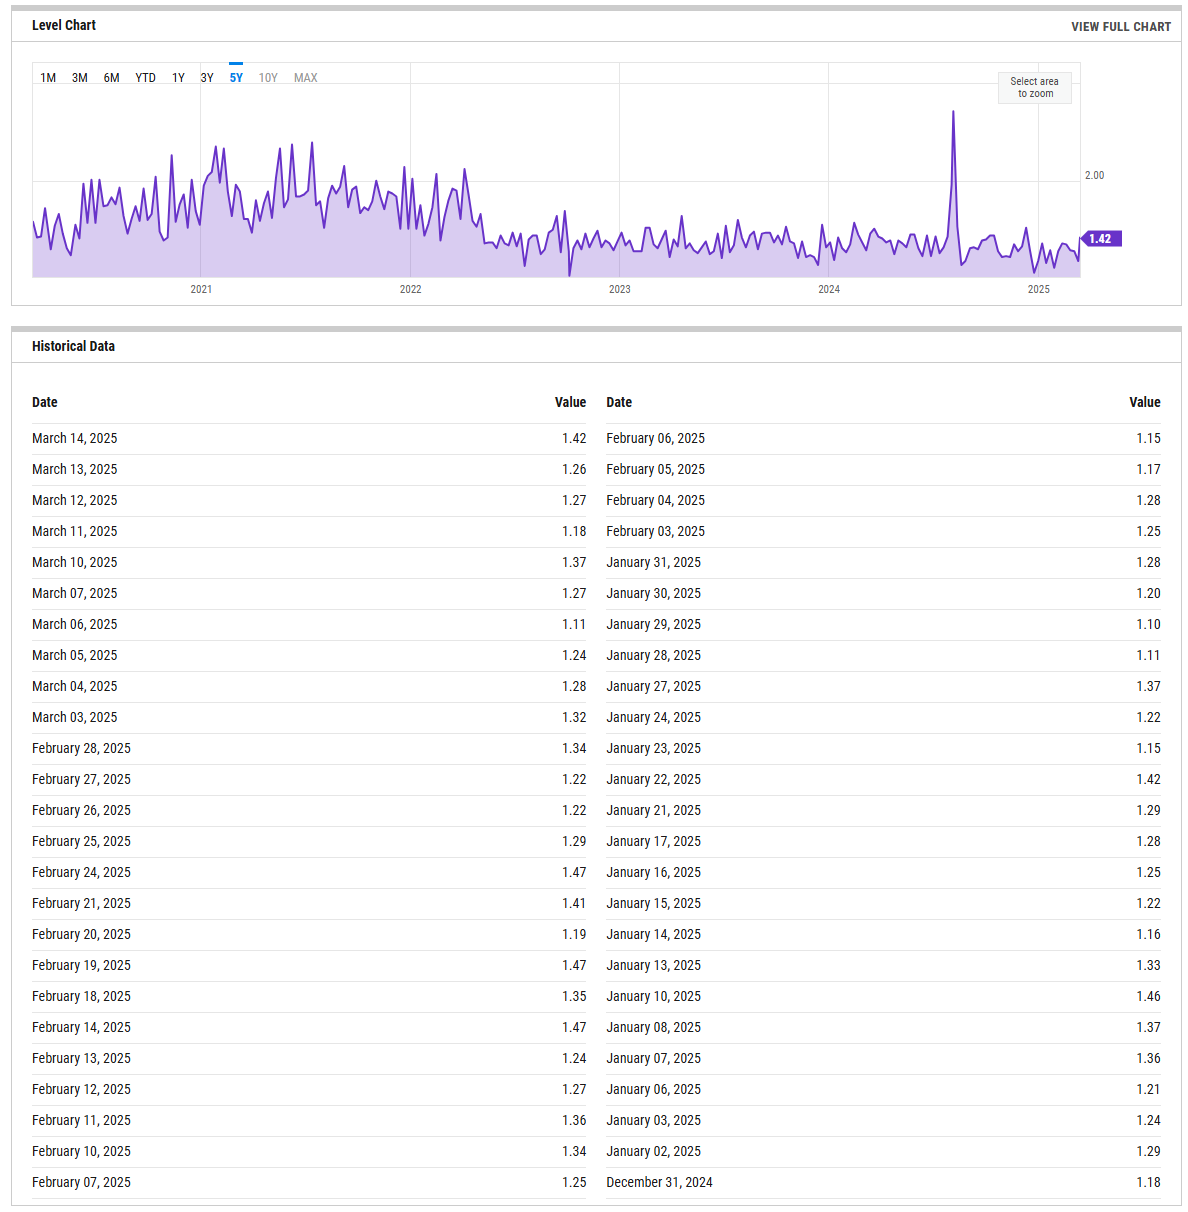
SPX Put/Call Ratio
The SPX Put/Call Ratio is an indicator that is used to gauge market sentiment. This is calculated as the ratio between trading S&P 500 put options and S&P call options. A high put/call ratio can indicate fear in the markets, while a low ratio indicates confidence. For example, in 2015, the Put-Call ratio was as high as 3.77 because of market fears stemming from various global economic issues like a GDP growth slowdown in China and a Greek debt default.
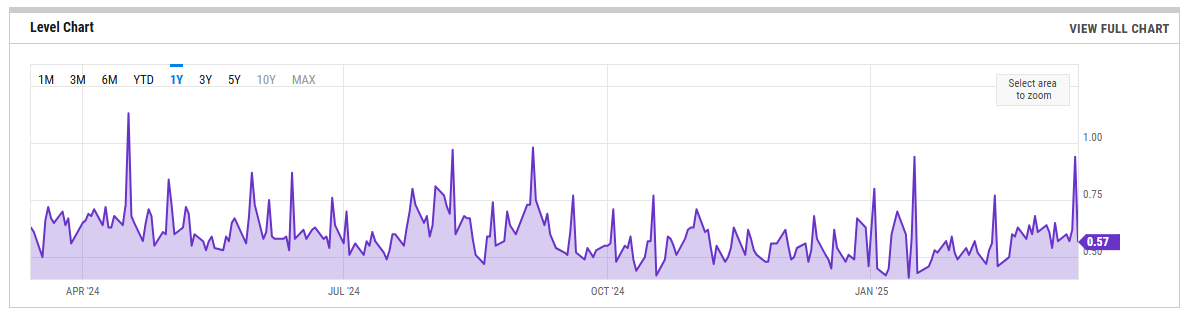
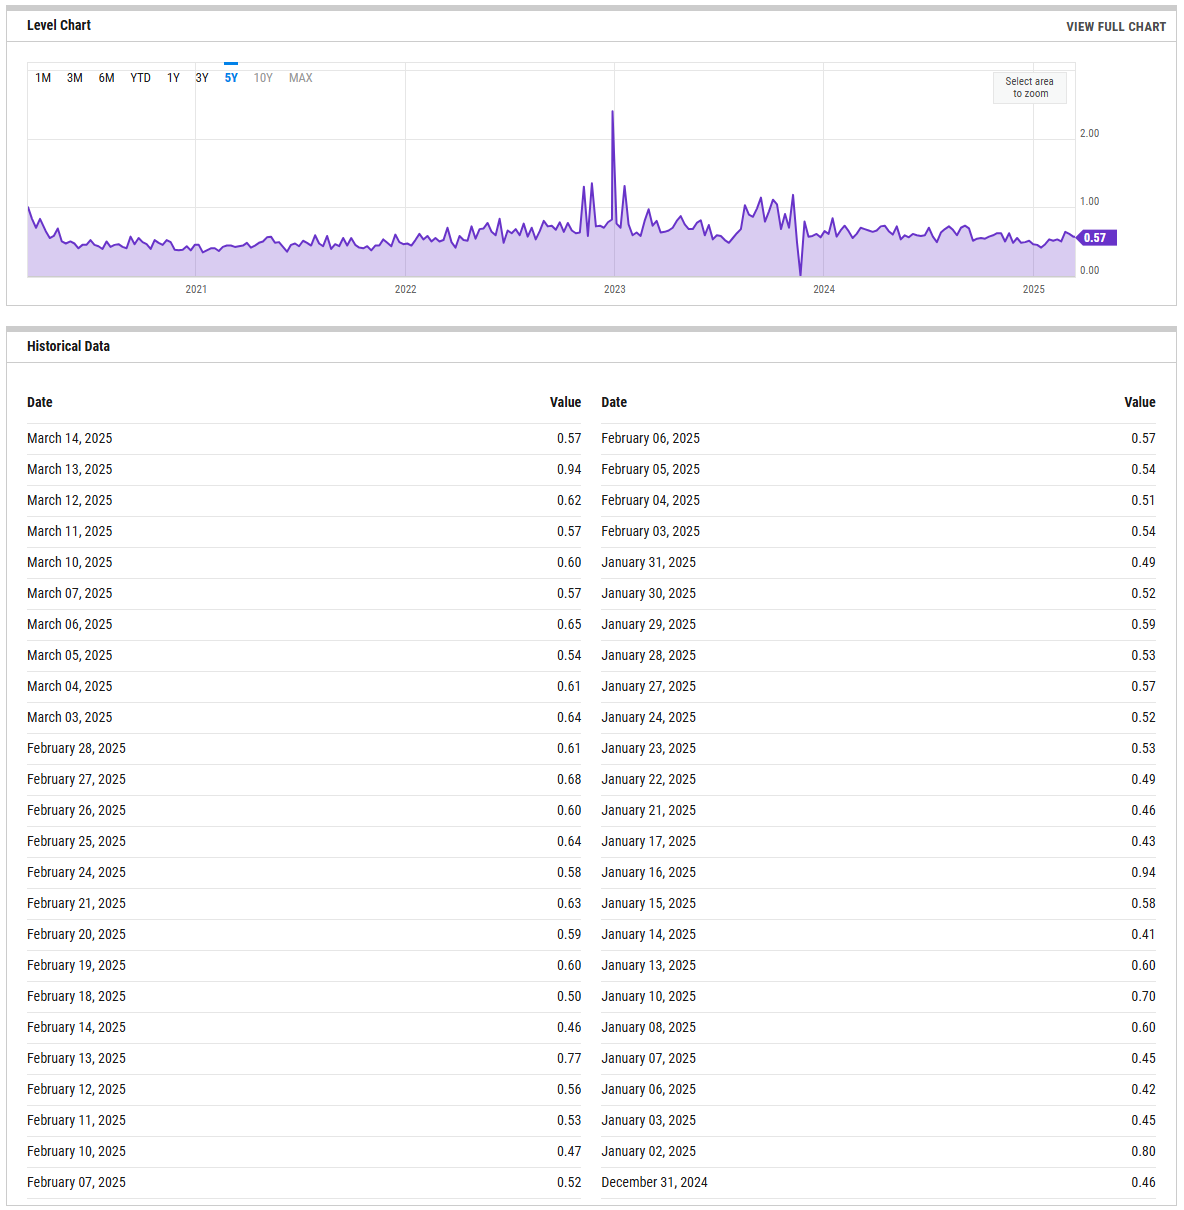
CBOE Equity Put/Call Ratio
The CBOE (Chicago Board Options Exchange) equity put/call ratio is a sentiment indicator used by traders and analysts to gauge market sentiment and potential shifts in investor behavior. It is calculated by dividing the volume of put options by the volume of call options on equities. Here’s what it reveals and how it is generally interpreted:
High Put/Call Ratio: When the put/call ratio is high (above 1.0), it suggests that there is more demand for put options than call options. This typically reflects a more bearish sentiment, as investors may be hedging against potential declines or expecting the market to fall.
Low Put/Call Ratio: Conversely, a low put/call ratio (below 0.7) indicates a higher volume of call options compared to puts, reflecting bullish sentiment. Investors may be expecting upward momentum and are positioning themselves to profit from price gains
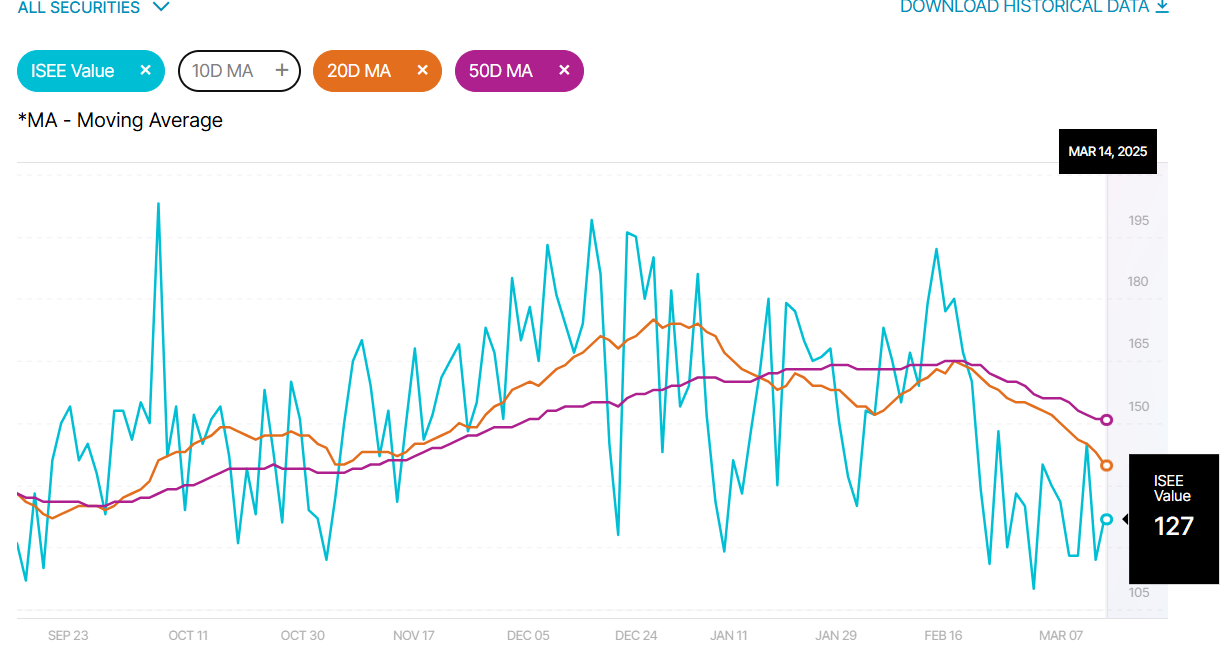
ISEE Sentiment Index
The ISEE (International Securities Exchange Sentiment) Index is a measure of investor sentiment derived from options trading. Unlike traditional put/call ratios, the ISEE Index focuses only on opening long customer transactions and is adjusted to remove market-maker and firm trades, providing a purer sentiment reading.
The ISEE Index typically ranges from 0 to 200, with readings above 100 indicating more call options being bought relative to put options, suggesting bullish sentiment. Conversely, readings below 100 suggest bearish sentiment, with more puts being purchased relative to calls.
New Highs - New Lows
The New Highs - New Lows indicator (NH-NL) displays the daily difference between the number of stocks reaching new 52-week highs and the number of stocks reaching new 52-week lows. The NH-NL indicator generally reaches its extreme lows slightly before a major market bottom. As the market then turns up from the major bottom, the indicator jumps up rapidly. During this period, many new stocks are making new highs because it's easy to make a new high when prices have been depressed for a long time. The NH-NL indicator oscillates around zero. If the indicator is positive, the bulls are in control. If it is negative, the bears are in control. As the cycle matures, a divergence often occurs as fewer and fewer stocks are making new highs (the indicator falls), yet the market indices continue to reach new highs. This is a classic bearish divergence that indicates that the current upward trend is weak and may reverse.
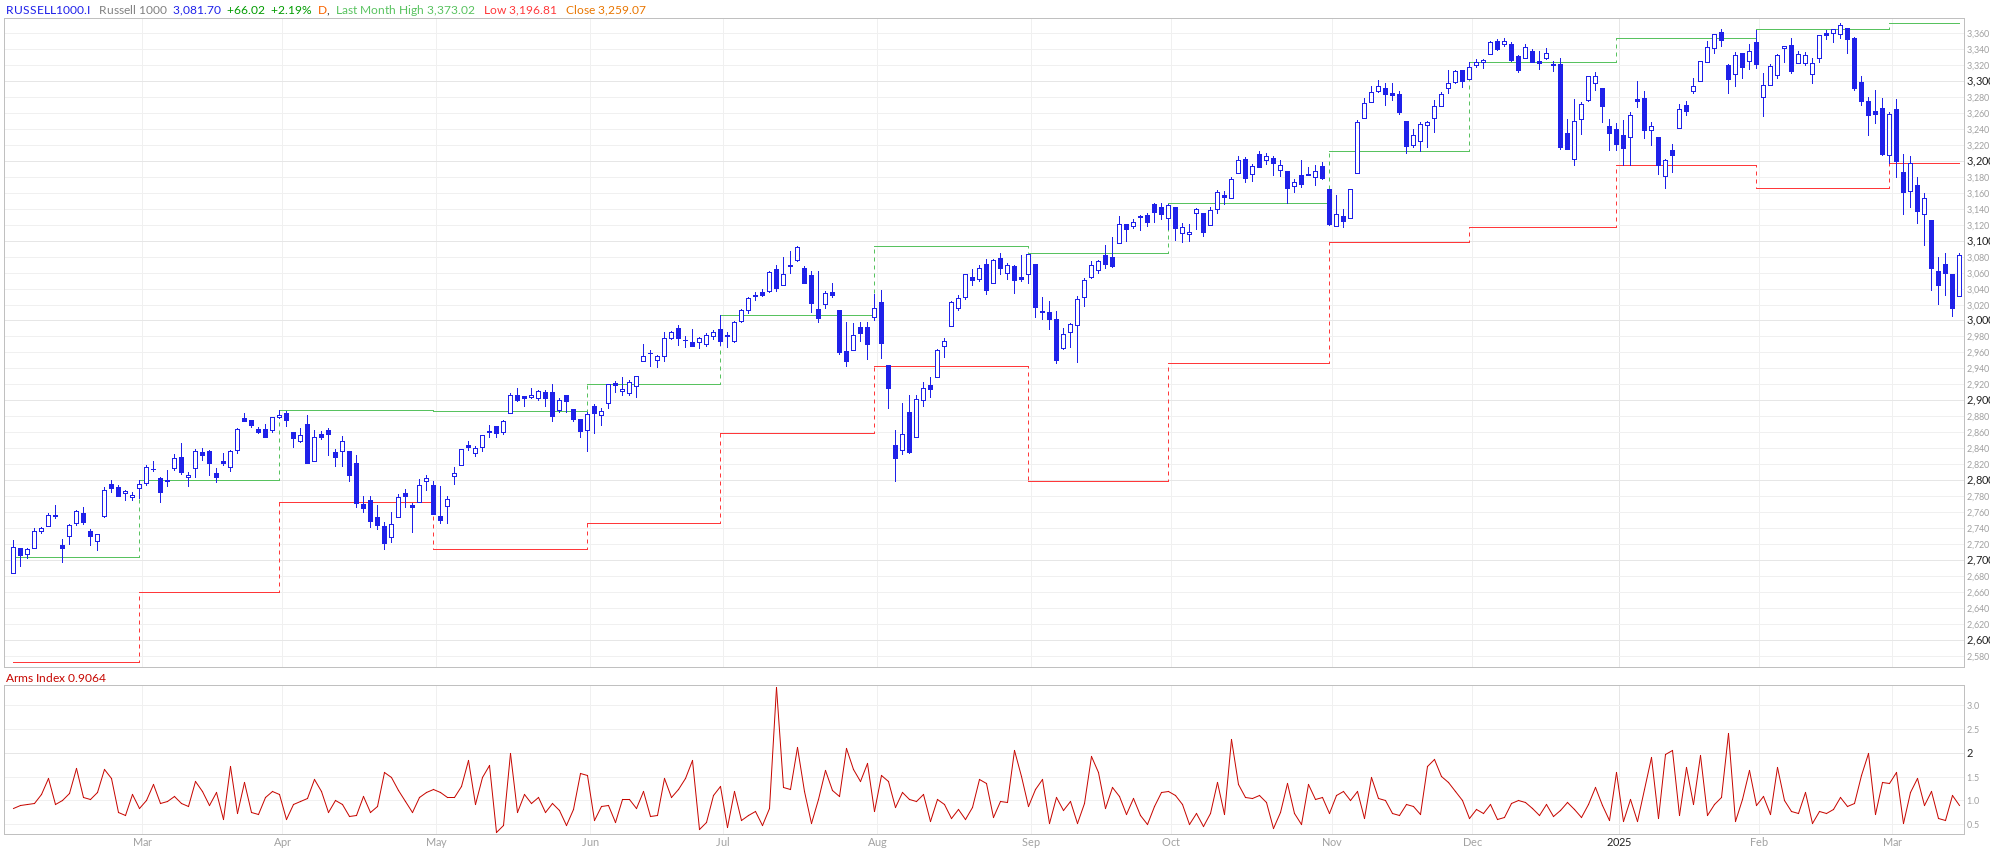
ARMS Index
The Arms Index, also known as the TRIN (Short-Term TRading INdex), was developed by Richard Arms in the 1960s. It is calculated by dividing the ratio of advancing stocks to declining stocks by the ratio of advancing volume to declining volume. Interpreting the Arms Index involves looking at its value in relation to certain thresholds. A value below "1" is considered bullish, indicating that advancing stocks and volume dominate the market. Conversely, a value above "1" is considered bearish, suggesting that declining stocks and volume are more prevalent. Extremely low values (below 0.5) or high values (above 2) are often seen as potential reversal signals.
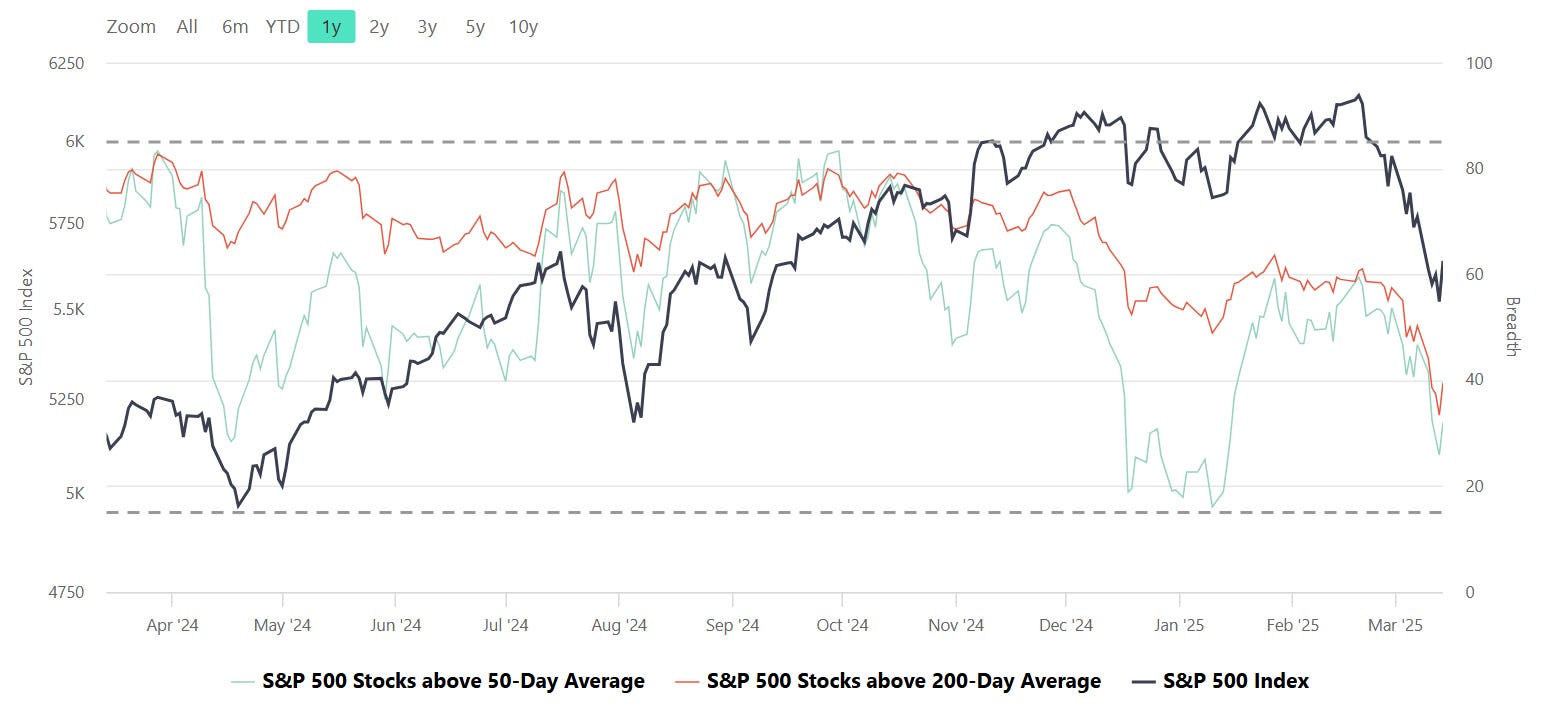
S&P Breadth
Breadth, in the context of stock market analysis, refers to the measure of how many stocks in a given index (such as the S&P 500) are participating in a trend, such as advancing or declining relative to a certain moving average (e.g., 50-day or 200-day).
Market Strength Assessment:
Breadth provides insight into whether a market rally or decline is broad-based or driven by only a few large-cap stocks. A rally supported by a high percentage of stocks above their 50-day or 200-day averages is generally considered healthier and more sustainable.
Early Warning Signals:
Divergences between breadth indicators and the index price can signal potential reversals. For example:
If the index is rising, but the number of stocks above their moving averages is declining, it may indicate weakening underlying strength and potential for a pullback.
Conversely, if breadth improves while the index remains flat or declines, it may suggest accumulating strength for a future rally.
Trend Confirmation:
Breadth indicators can confirm trends. For instance, a strong majority of stocks above their moving averages signals robust market momentum, providing confidence in the prevailing trend.
Identifying Overbought or Oversold Conditions:
Extremely high or low breadth readings can signal overbought or oversold conditions, which might lead to mean reversion. For example:
If nearly all stocks are above their 50-day or 200-day averages, it may suggest overbought conditions.
Conversely, extremely low levels indicate oversold conditions and potential for a bounce.
Breadth and Timing Investments:
Entry Points:
When breadth improves (e.g., more stocks move above their 50-day or 200-day moving averages) after a market pullback, it can indicate a good time to start building positions as the broader market is regaining strength.
Exit Points:
Breadth deterioration during a rally may suggest it’s time to reduce exposure, especially if only a small number of stocks are driving index gains. This is often a warning sign of an impending correction.
Volatility and Risk Management:
Weak breadth in volatile markets may prompt caution or defensive positioning. Conversely, improving breadth can justify taking on more risk during uptrends.
CME Fedwatch
What is the likelihood that the Fed will change the Federal target rate at upcoming FOMC meetings, according to interest rate traders? Use CME FedWatch to track the probabilities of changes to the Fed rate, as implied by 30-Day Fed Funds futures prices.
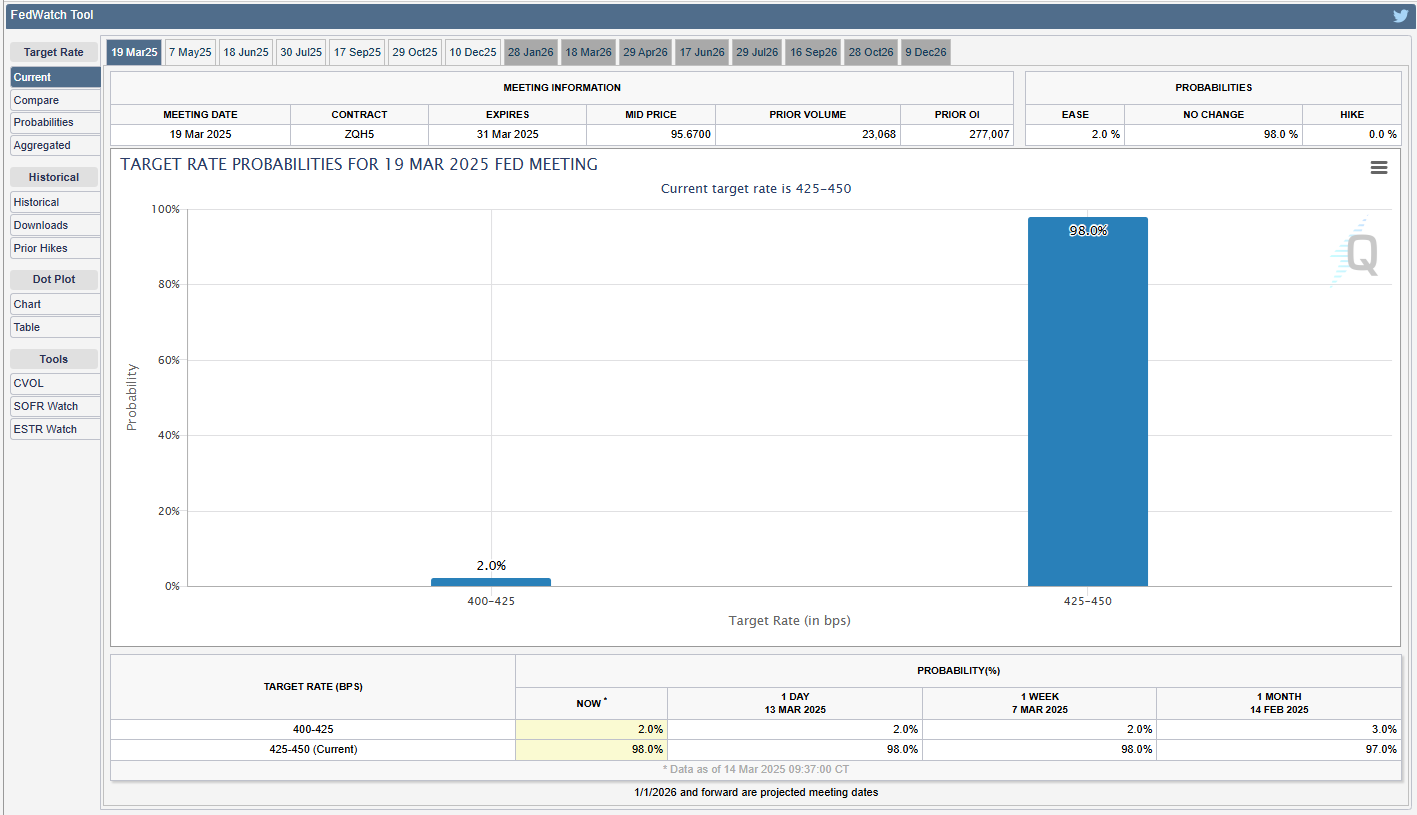
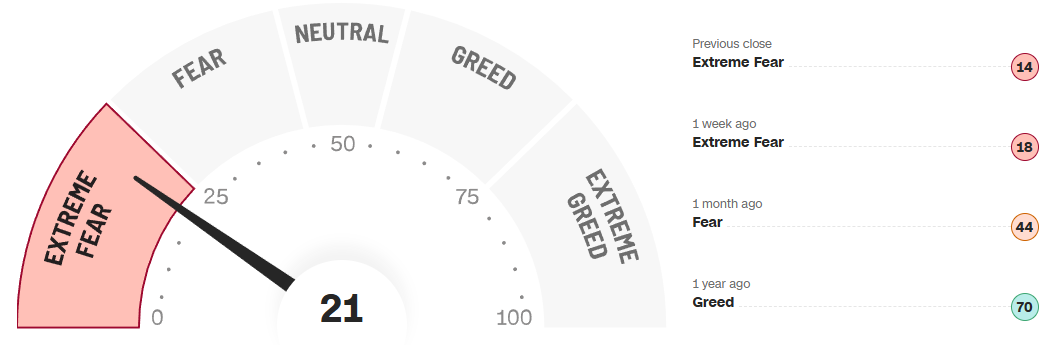
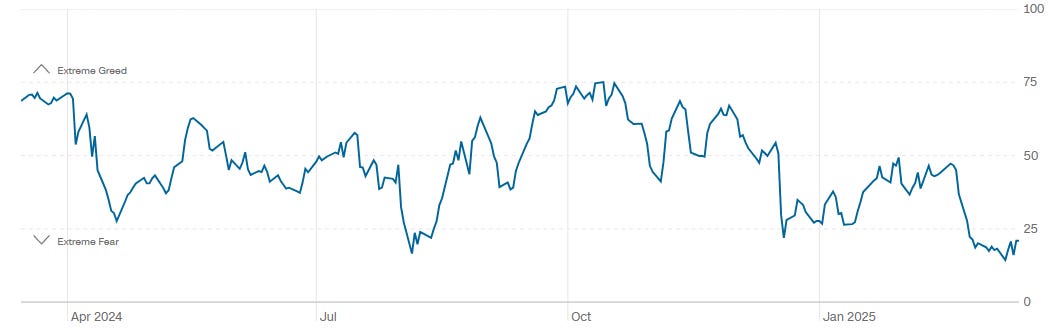
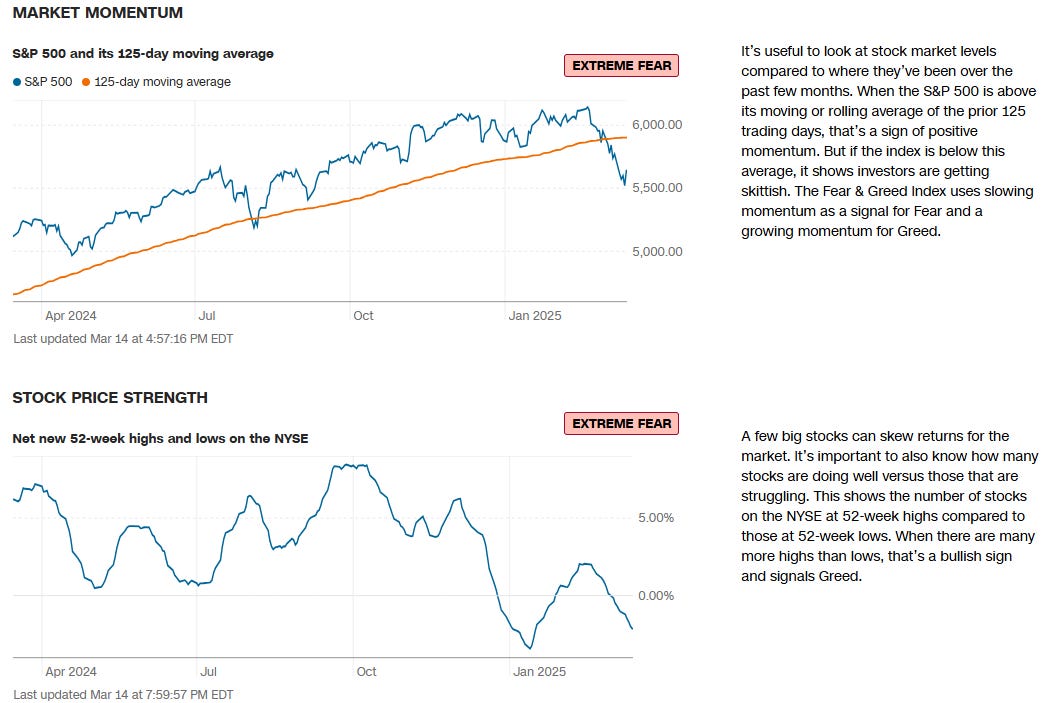
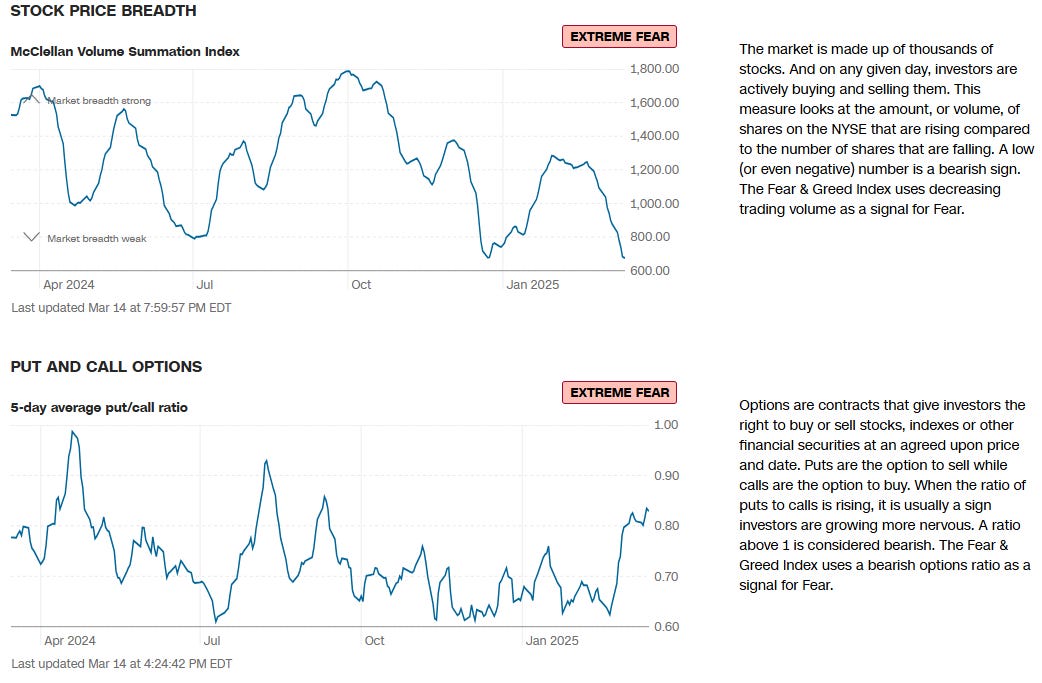
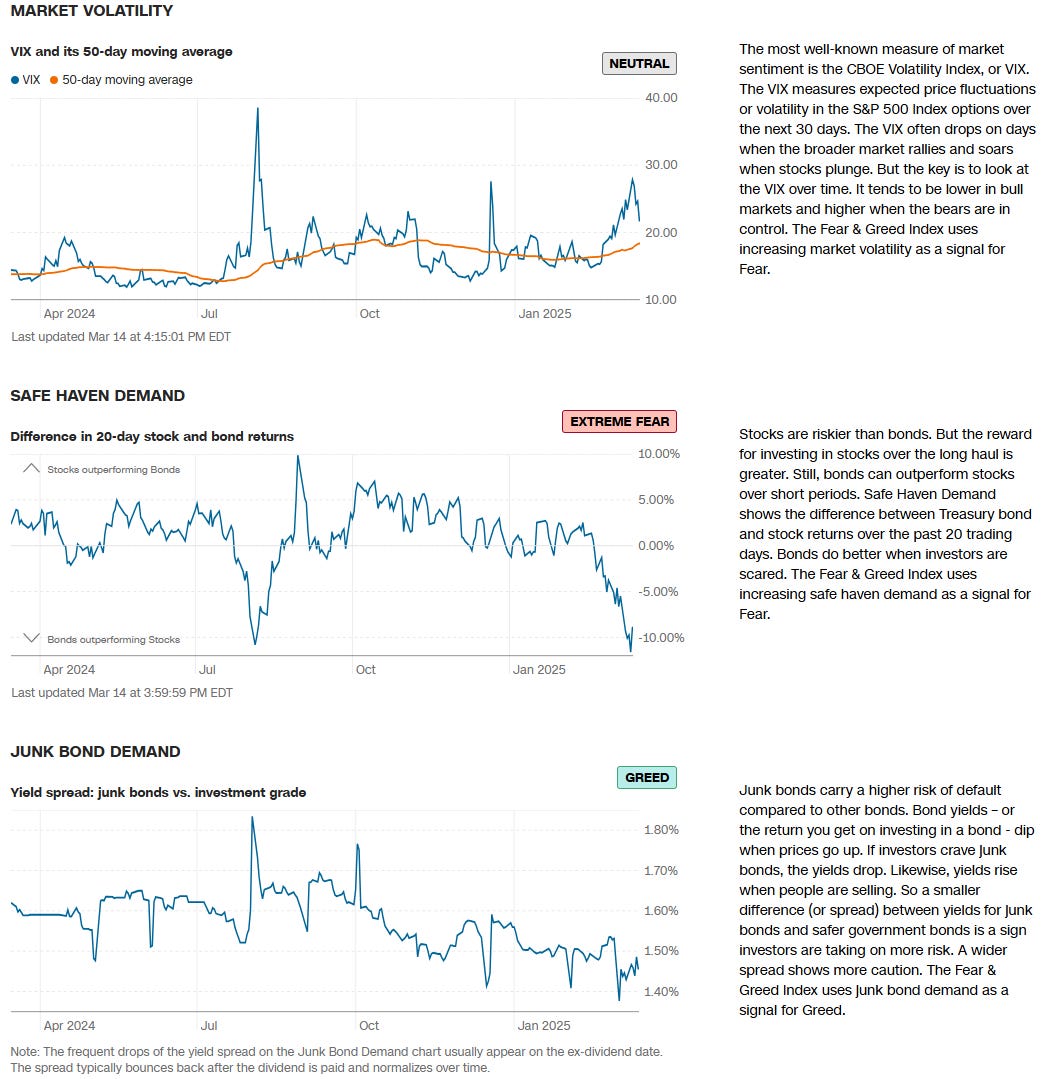
CNN Fear & Greed Constituent Data Points & Composite Index
Institutional S/R Levels for Major Indices
When you’re a large institutional player, your primary goal is to find liquidity - places to do a ton of business with the least amount of slippage possible. VolumeLeaders.com automatically identifies and visually plots the exact spots where institutions are doing business and where they are likely to return for more. It’s one of the primary reasons “support” and “resistance” concepts work and truly one of the reasons “price has memory”.
Levels from the VolumeLeaders.com platform can help you formulate trades theses about:
Where to add or take profit
Where to de-risk or hedge
What strikes to target for options
Where to expect support or resistance
And this is just a small sample; there are countless ways to leverage this information into trades that express your views on the market. The platform covers thousands of tickers on multiple timeframes to accommodate all types of traders.
SPY 0.00%↑
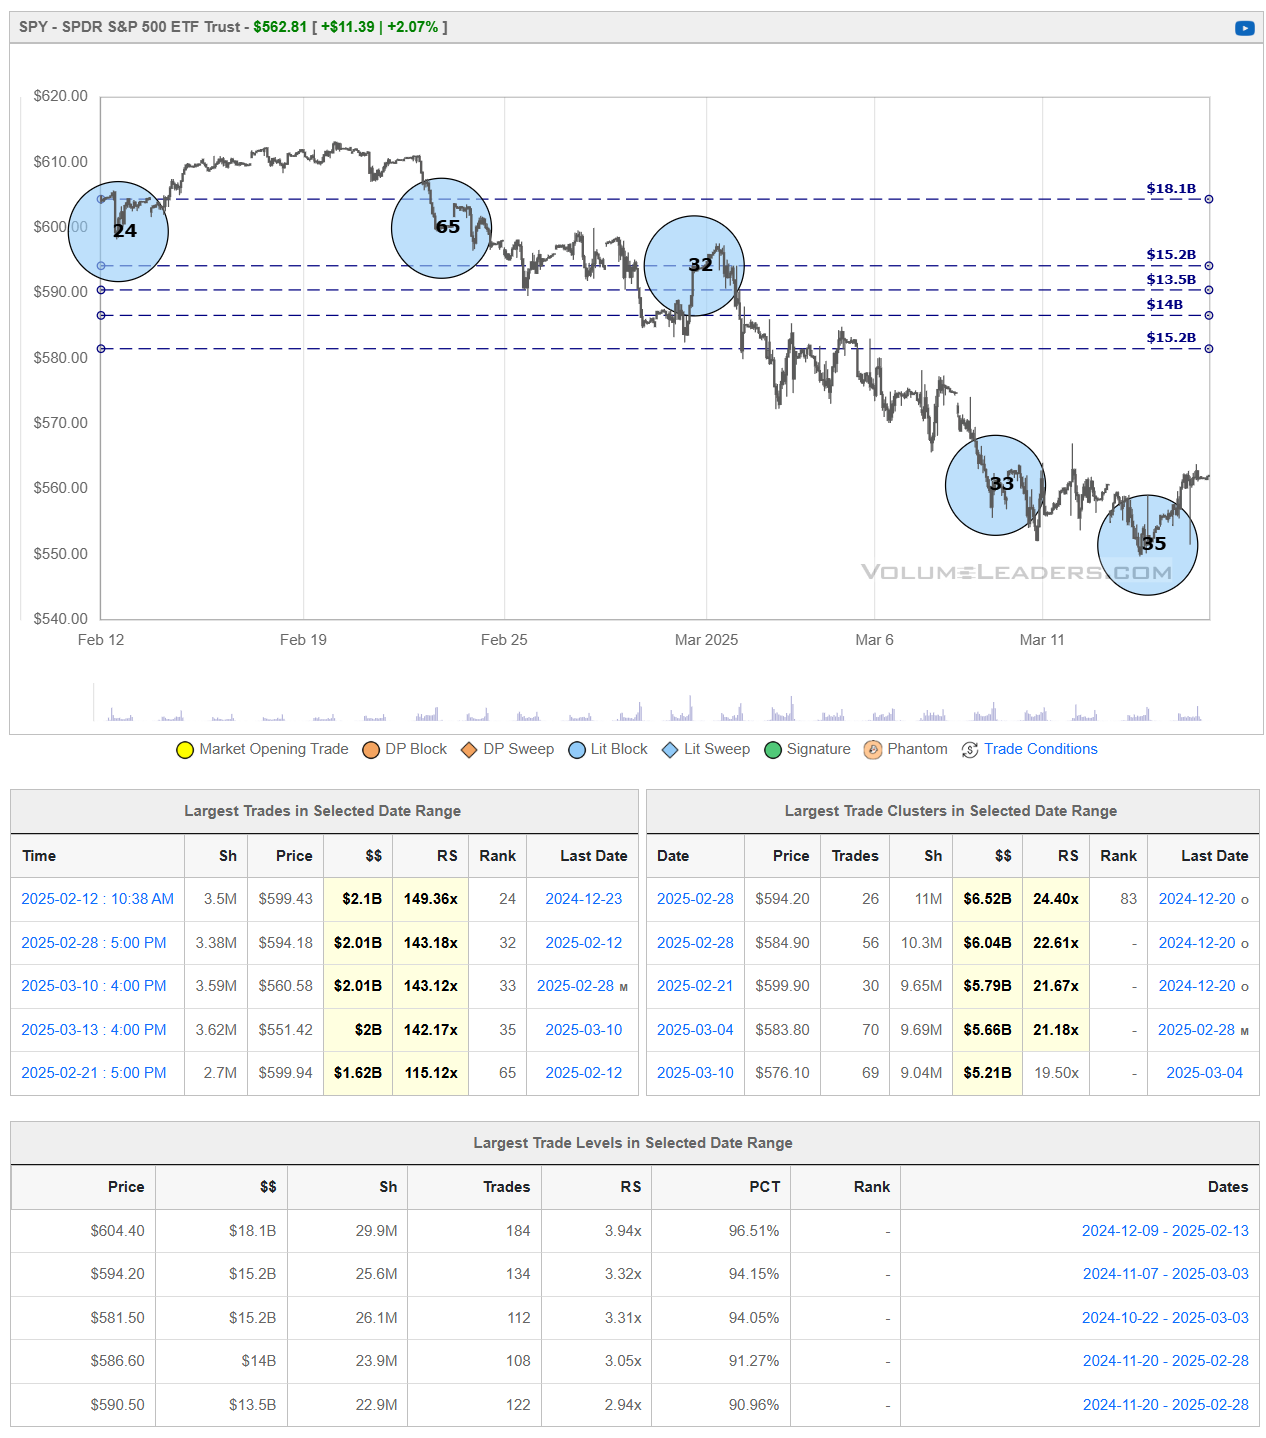
SPY continued its slide from the $610 region down into the mid‐$550s before attracting strong buying interest that fueled a rebound toward $560–$565. However, significant overhead supply persists around $580–$590, where previous institutional trades suggest selling pressure may re‐emerge.
If SPY can maintain its upward momentum and reclaim $580–$590 on strong volume, it would signal that buyers have largely absorbed the recent wave of selling, potentially allowing a push back into the $600 area. Conversely, a failure to break through that overhead band—or a slip back under $560—would point to lingering bearish momentum, raising the likelihood of a retest of March’s lows in the mid‐$550s.
QQQ 0.00%↑
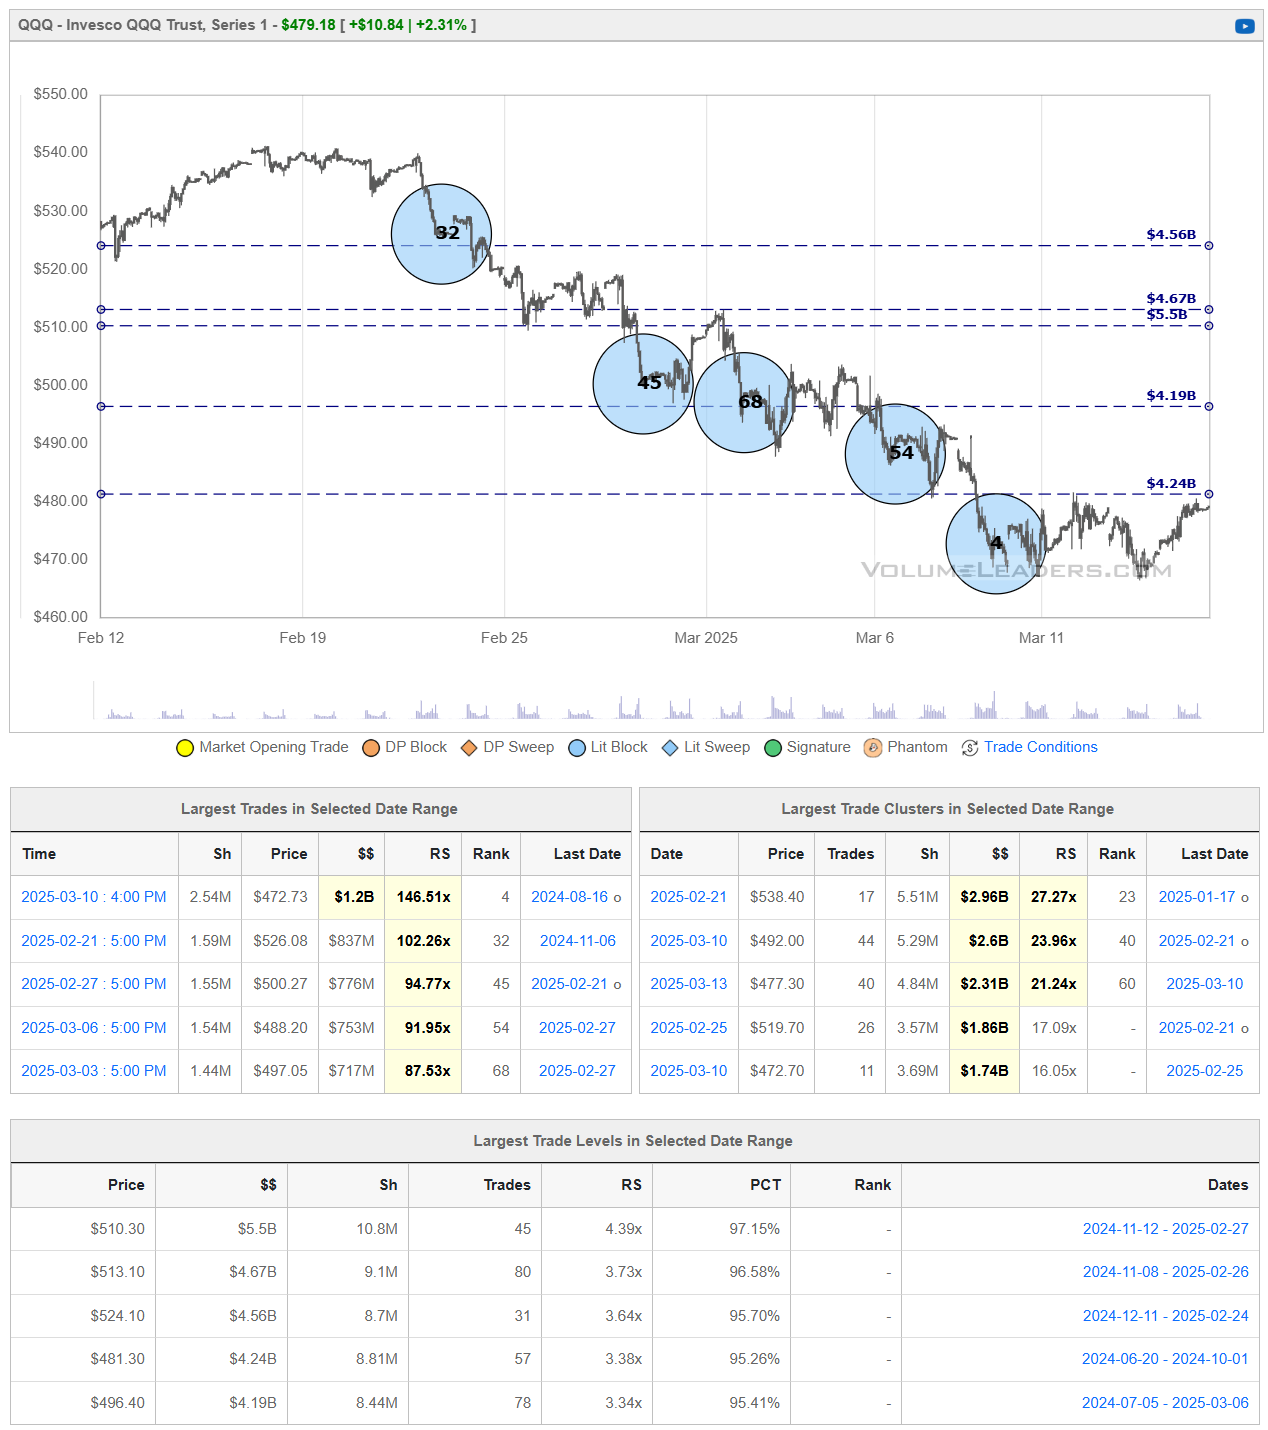
QQQ extended its downtrend from the mid‐$530s into the $470s before catching a bid in mid‐March. Significantly, one of the ETF’s largest trades on record occurred on 3/10, suggesting notable institutional interest near the recent lows. QQQ has since staged a modest rebound, but remains below multiple layers of volume‐based resistance around $490–$500.
If buyers can maintain momentum—and the hefty trade on 3/10 proves to be a turning point—clearing $500 would signal that demand is absorbing leftover supply and potentially spark a larger recovery. On the other hand, a failure to climb above that zone or a drop back below the $470–$475 area would confirm that sellers remain in control, exposing QQQ to further downside risk.
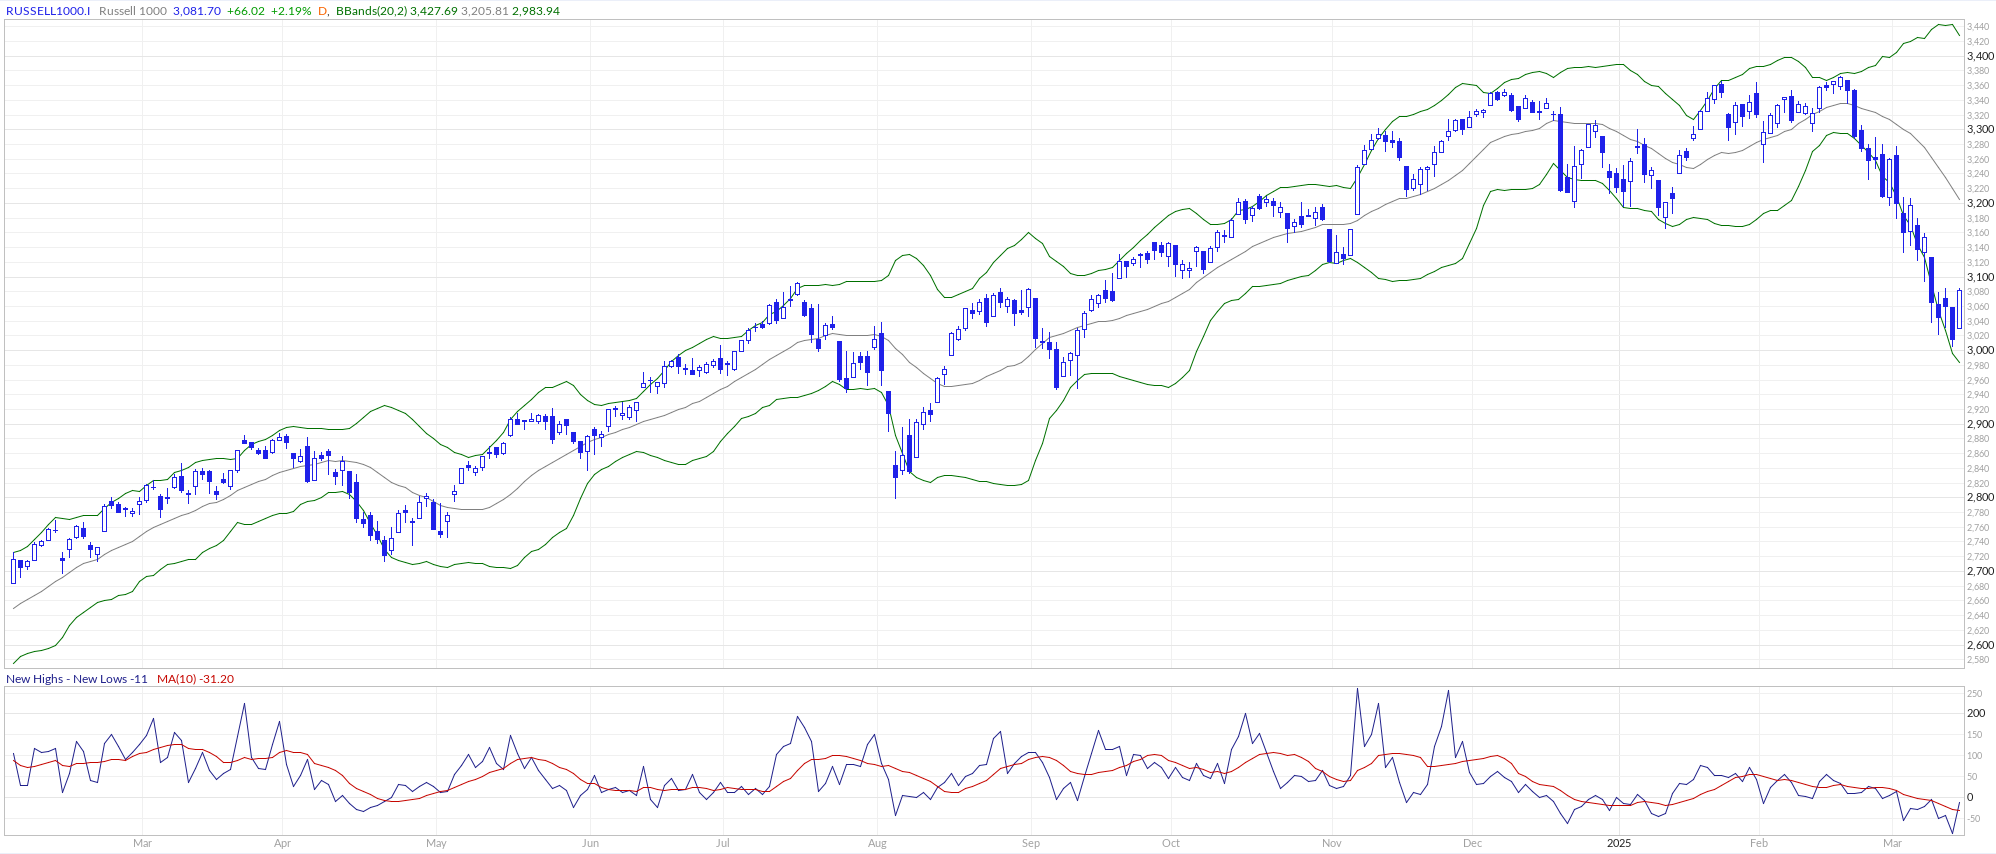
IWM 0.00%↑
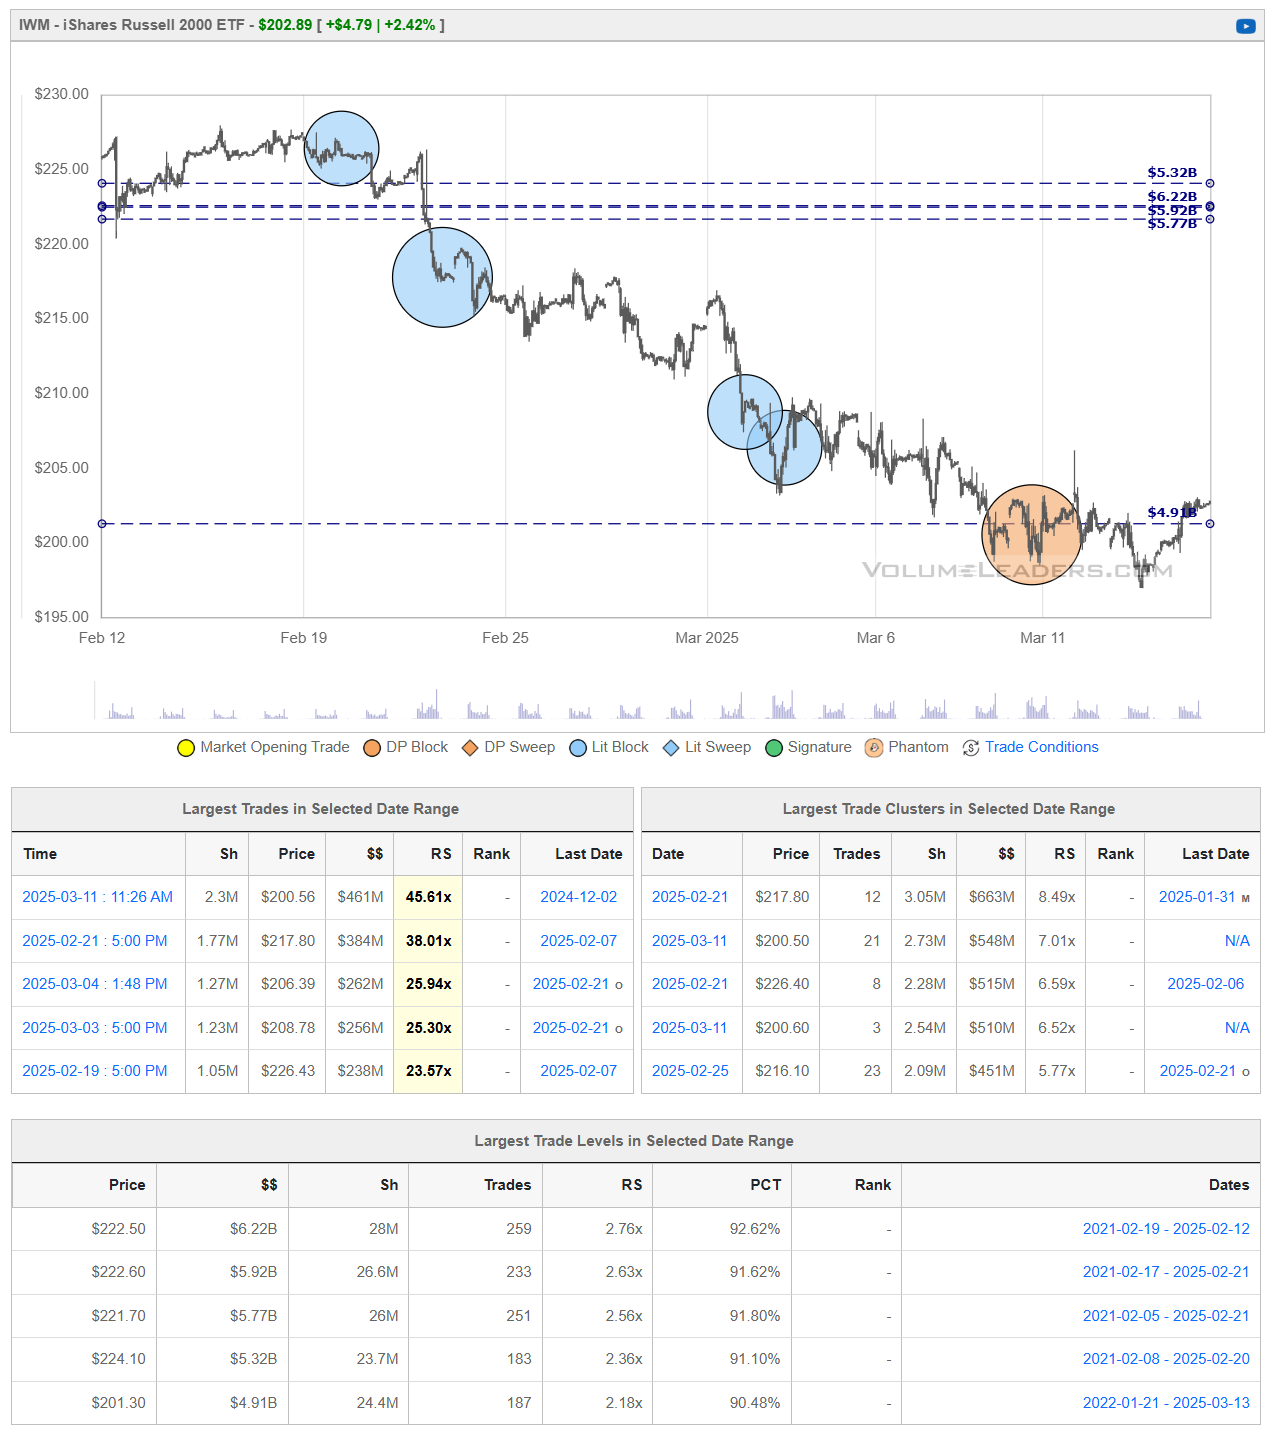
IWM extended its downtrend from the $225–$230 area into the low‐$200s, where notable volume stepped in around $200–$202 to stabilize price. The ETF has since bounced modestly, suggesting buyers are attempting to defend this key psychological and technical zone. However, overhead supply remains significant in the $210–$215 region, where prior support is now likely to act as resistance.
If IWM can break decisively above $210, it would signal that buyers have absorbed the recent selling pressure and could spark a more sustained recovery. On the other hand, a failure to clear that zone—or a renewed drop below $200—would indicate that sellers still control the tape, raising the odds of another leg lower.
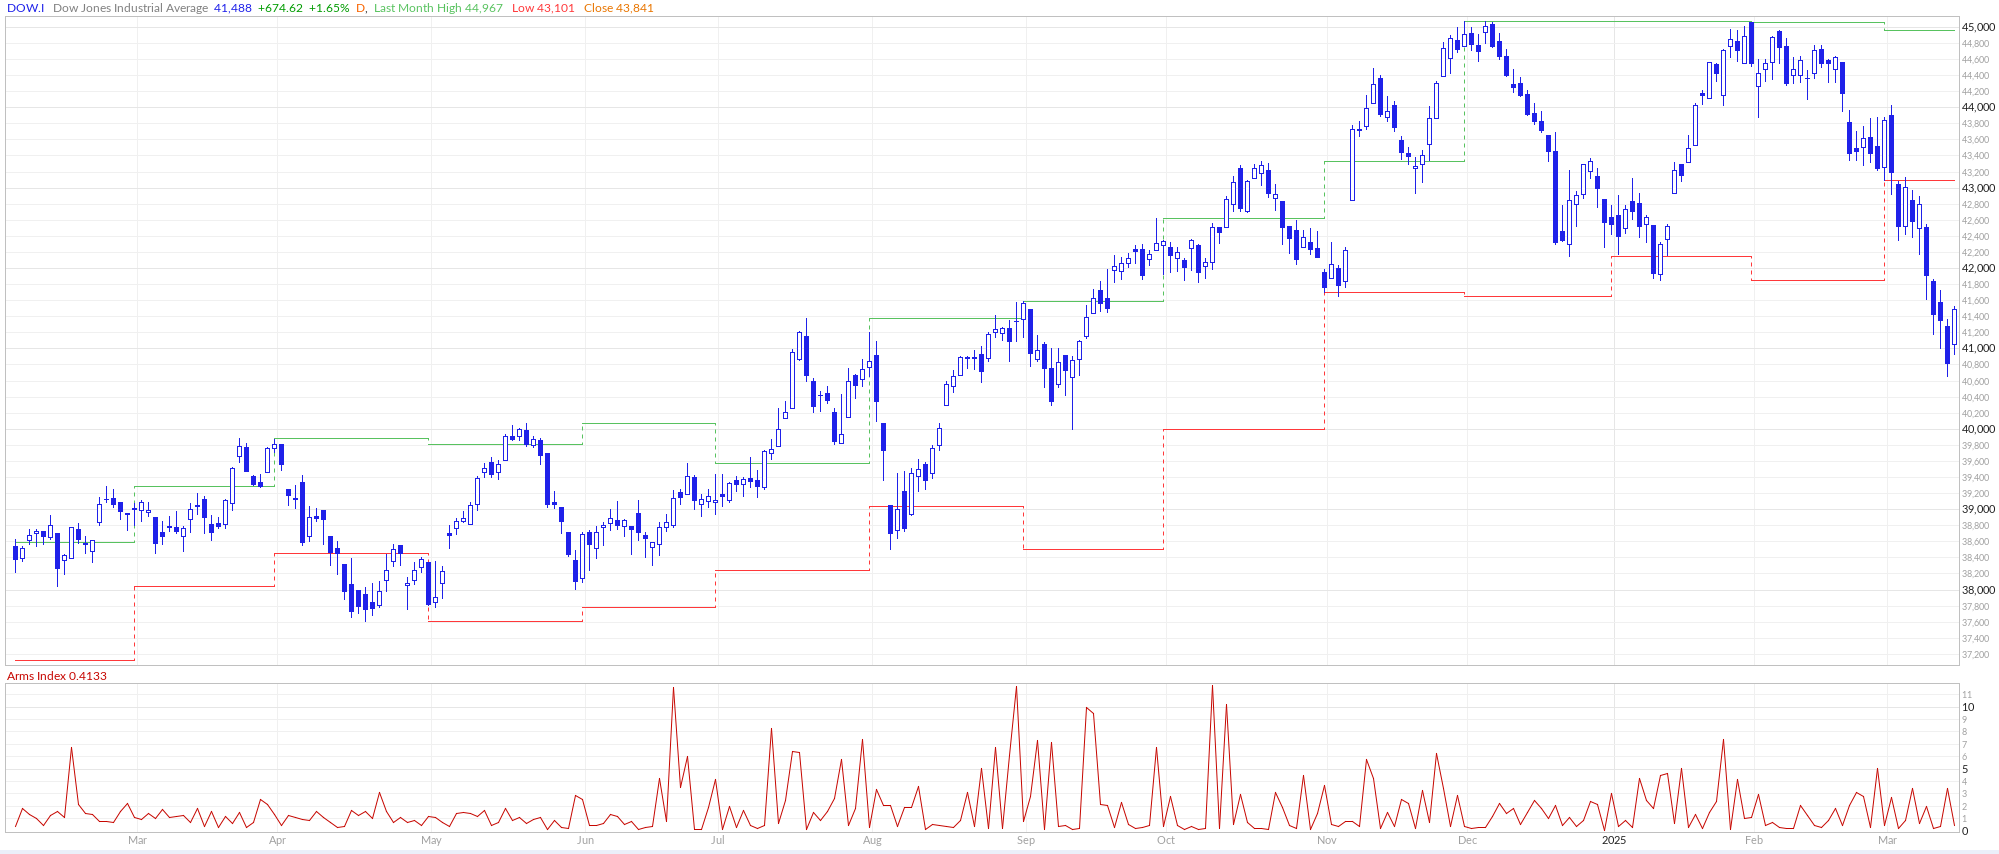
DIA 0.00%↑
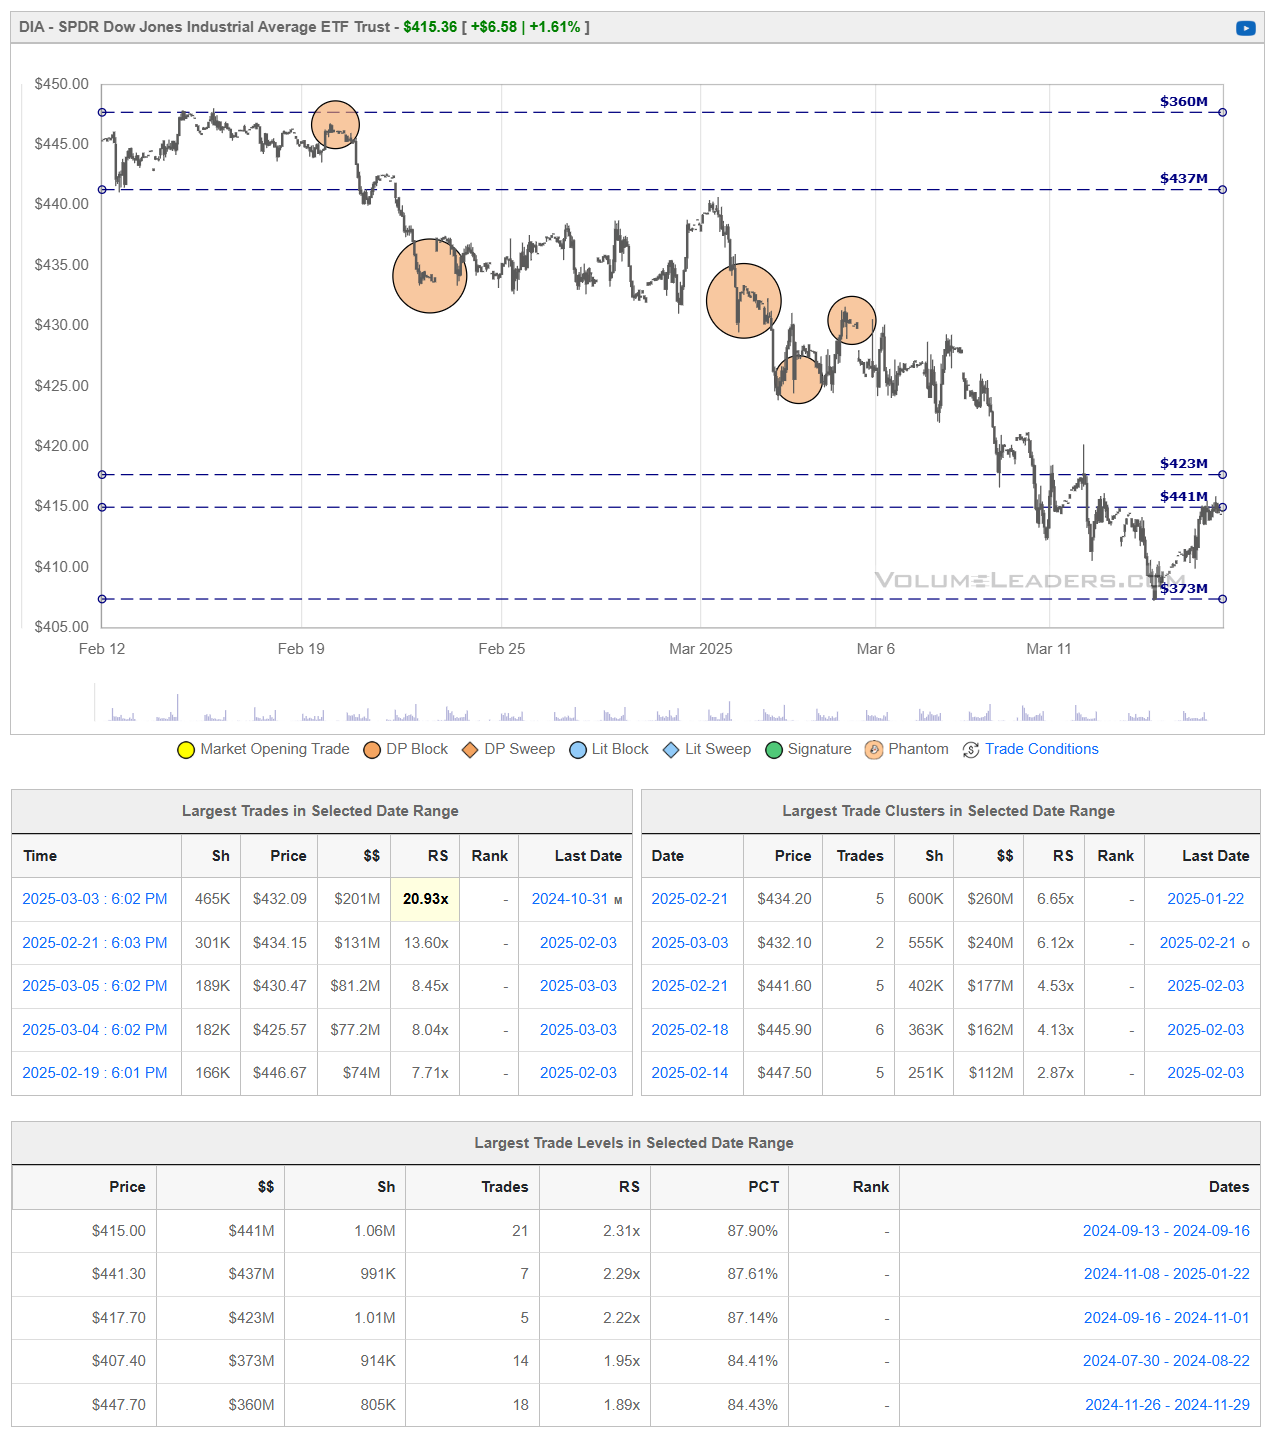
DIA’s slide from the mid‐$440s down into the low‐$410s appears to have found near‐term support around $405–$410. A recent bounce has lifted price into the $415–$420 zone; however, prior institutional activity around $420–$425 may present stiff overhead resistance. If buyers can clear that band, DIA could extend its rebound toward the mid‐$430s. Conversely, a failure to hold above $410–$415—and any subsequent drop below $405–$410—would indicate sellers remain in control, likely setting up a retest of the March lows.
Institutional Order Flow
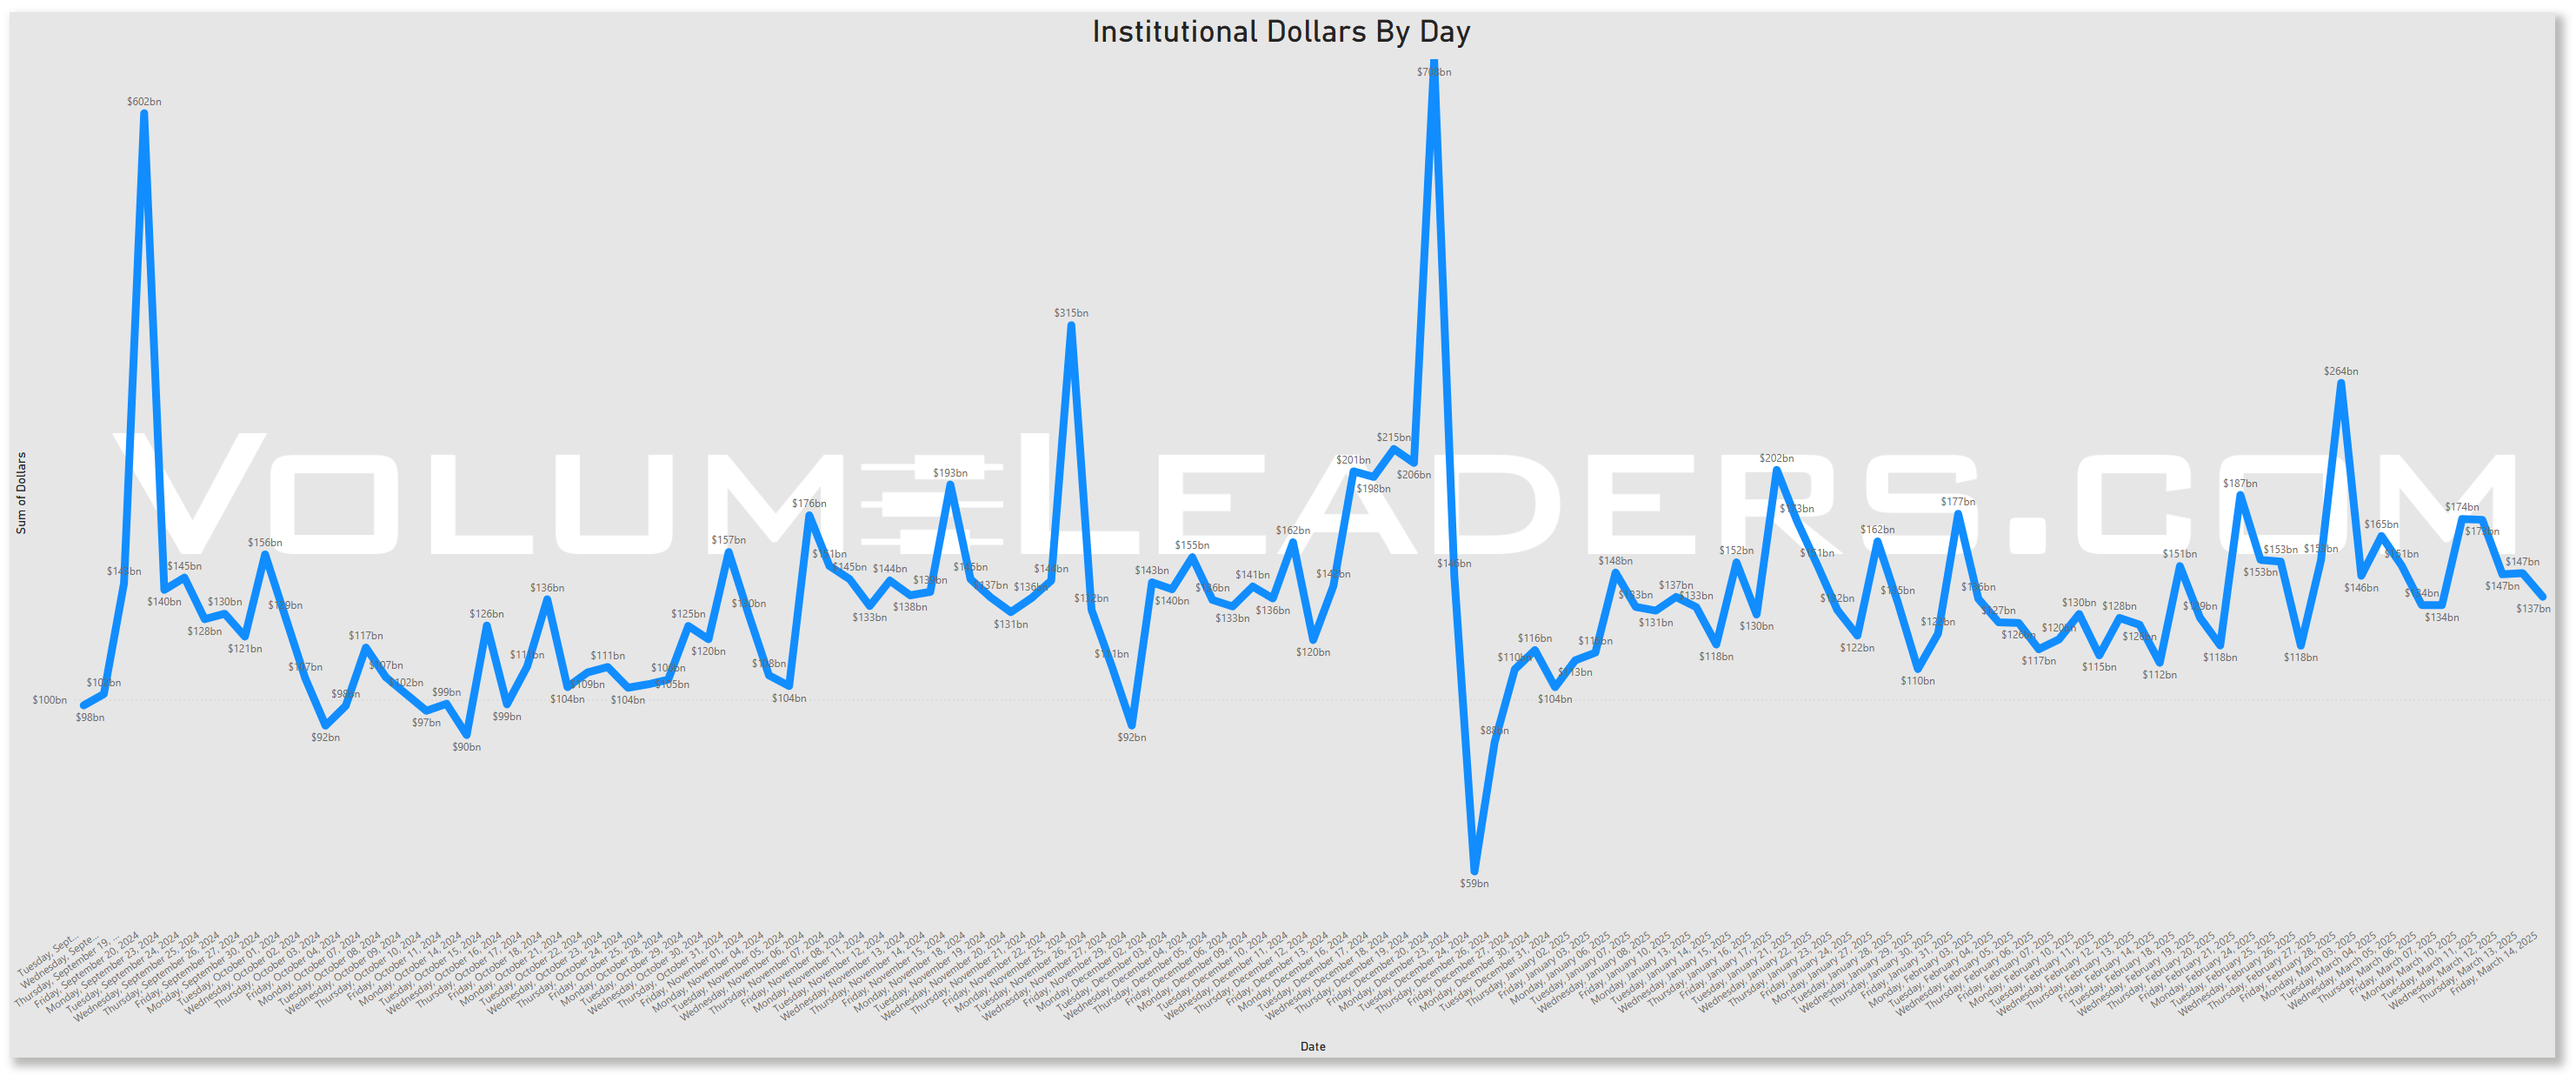
Rolling 90-Day Dollars By Day
This chart shows institutional activity by dollars by day on a rolling 1-year basis. From a theoretical standpoint, examining a chart of daily institutional dollar activity over the course of a year can offer several insights and possible inferences, though all should be approached with caution since the data alone may not prove causality or confirm underlying reasons. Some potential takeaways include:
Event-Driven Behavior:
Sharp, singular spikes on certain days might correlate with major market-moving events. These could include central bank policy announcements, significant geopolitical news, sudden macroeconomic data releases (like employment reports or GDP data), earnings seasons for large-cap companies, or unexpected shocks (e.g., mergers, acquisitions, regulatory changes).Liquidity Dynamics:
Institutions often concentrate large trades on days with higher expected liquidity. For instance, heightened activity might coincide with index reconstitutions, option expiration dates, or the days leading up to or following a major index rebalance, when large amounts of capital shift hands simultaneously.Risk Management and Hedging Activity:
Institutions may significantly adjust their exposures on days that are critical from a risk management perspective. Large spikes can occur if hedge funds, pension funds, or asset managers are rolling over futures contracts, initiating or closing out large hedges, or reacting to volatility triggers.Market Sentiment Indicators:
While the data is purely transactional, the sheer volume of institutional involvement on certain days might indirectly hint at changing sentiment or strategic shifts.
In essence, a chart like this can lead you to hypothesize that institutional trading volumes are not constant or random but rather influenced by a mix of predictable calendar effects, major market events, liquidity considerations, risk management decisions, and strategic allocation shifts.
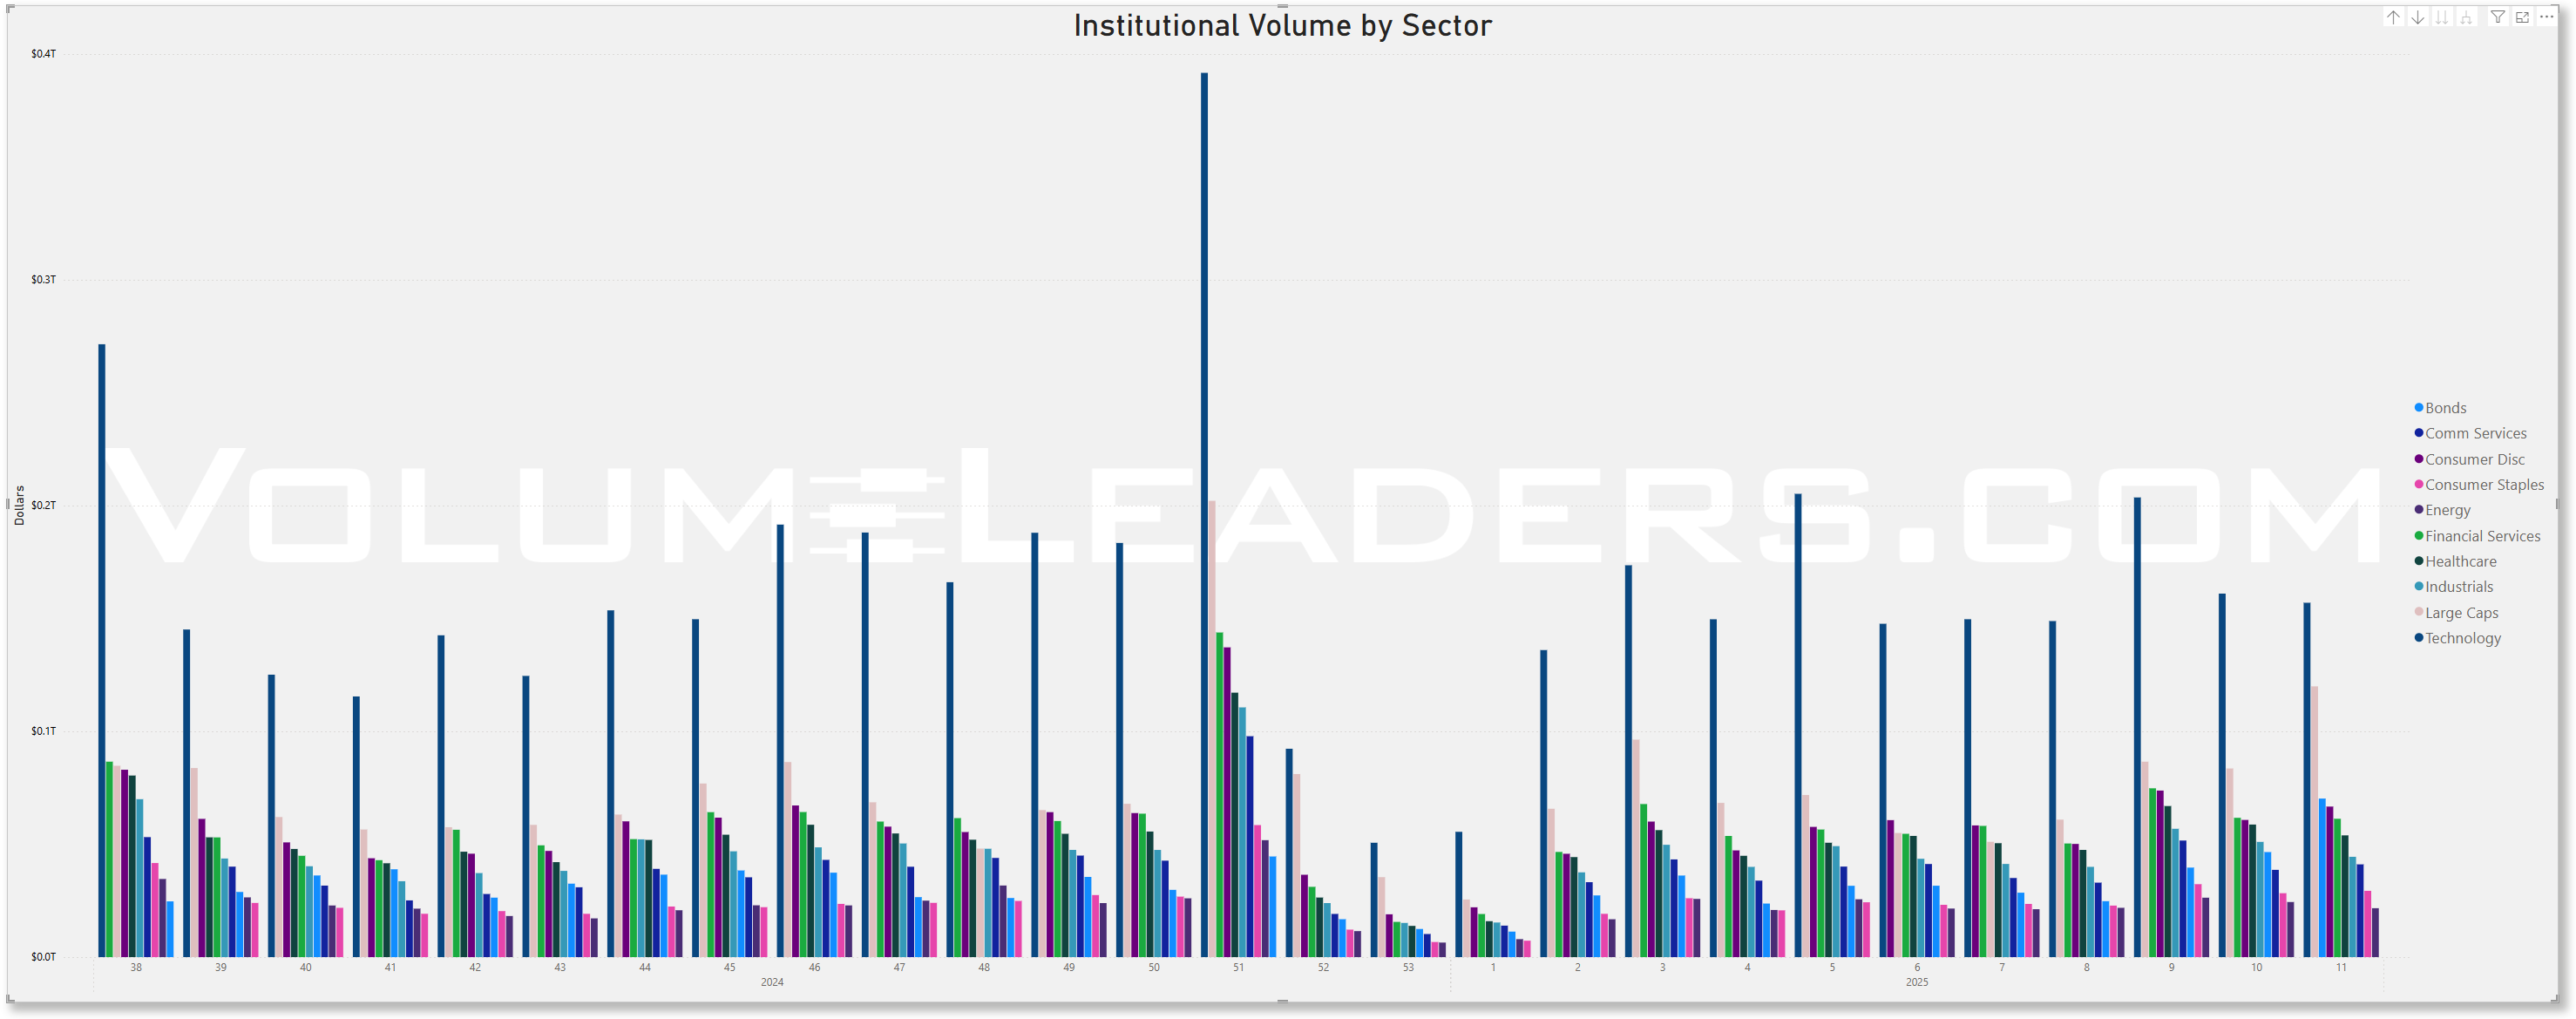
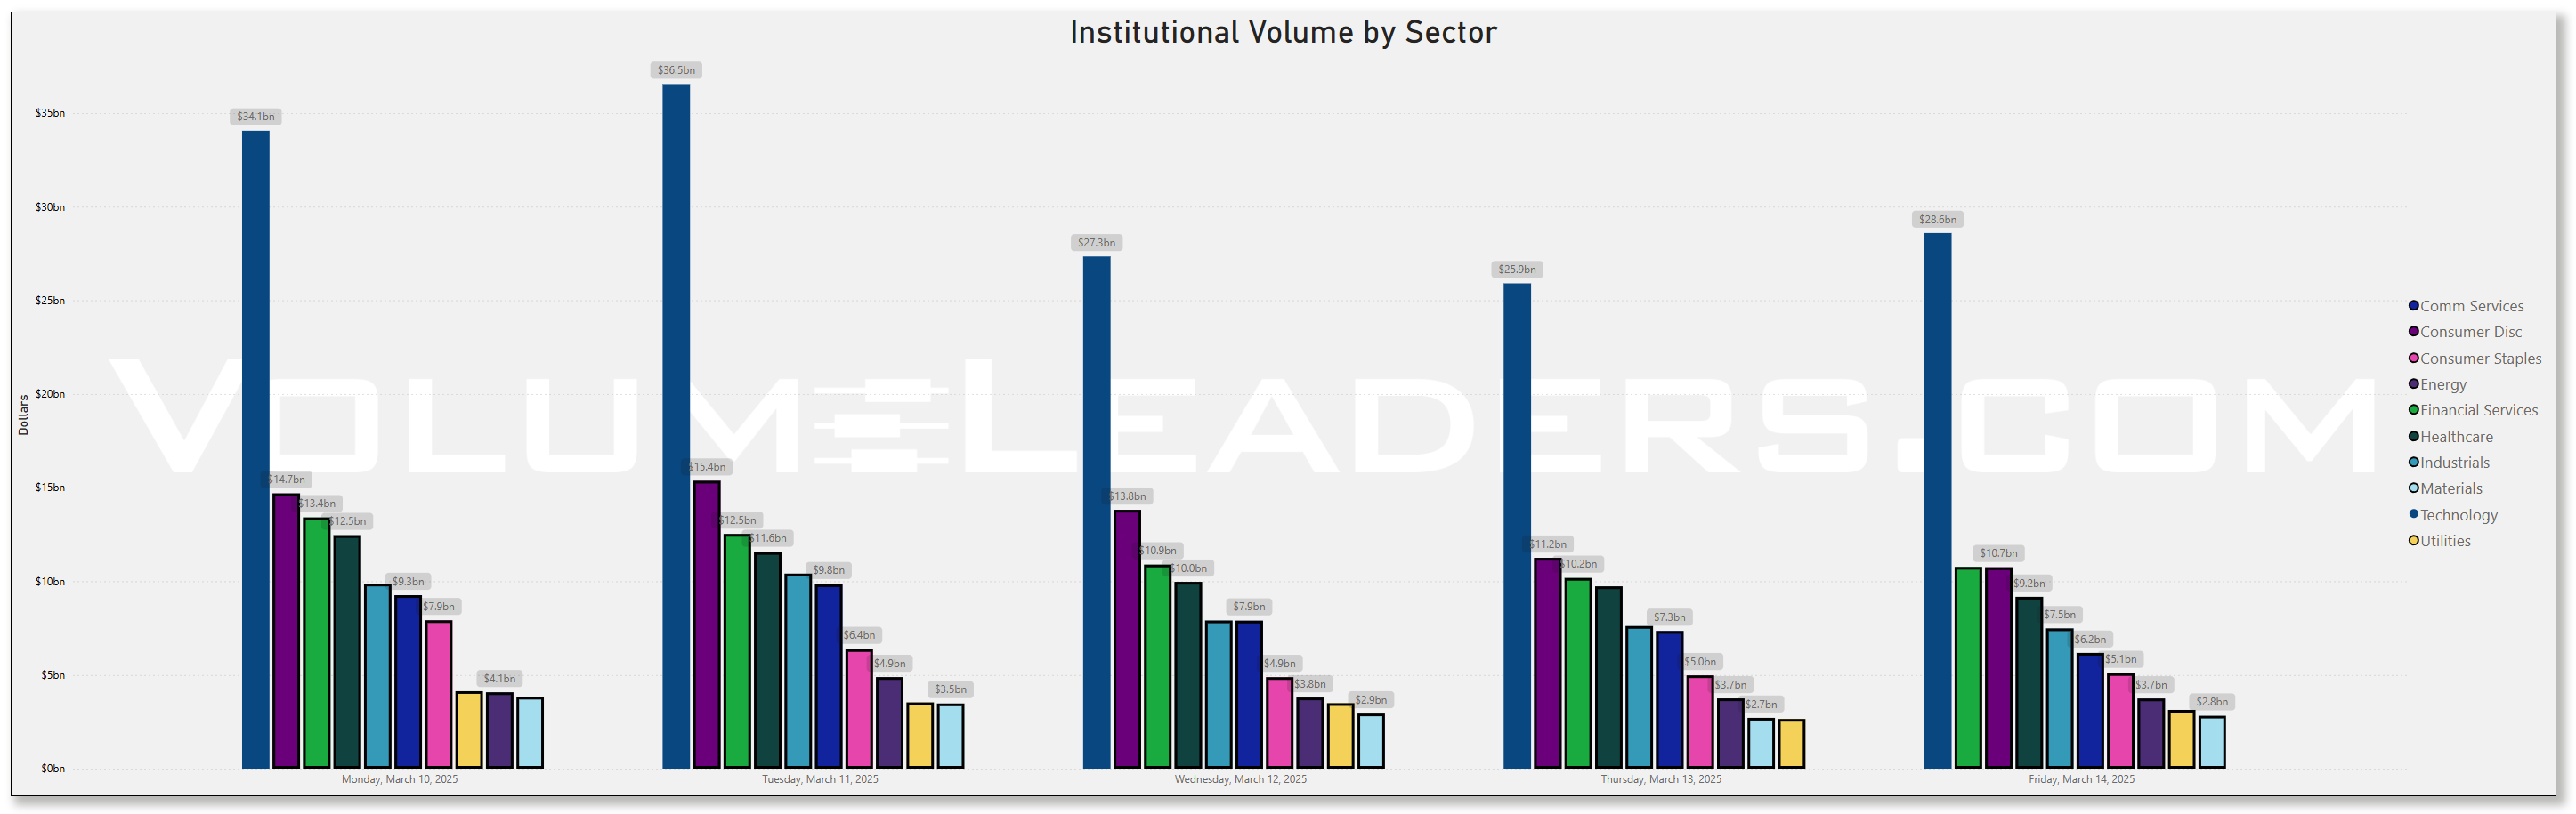
Top Institutional Order Flow By Sector By Week For The Past 90-Days
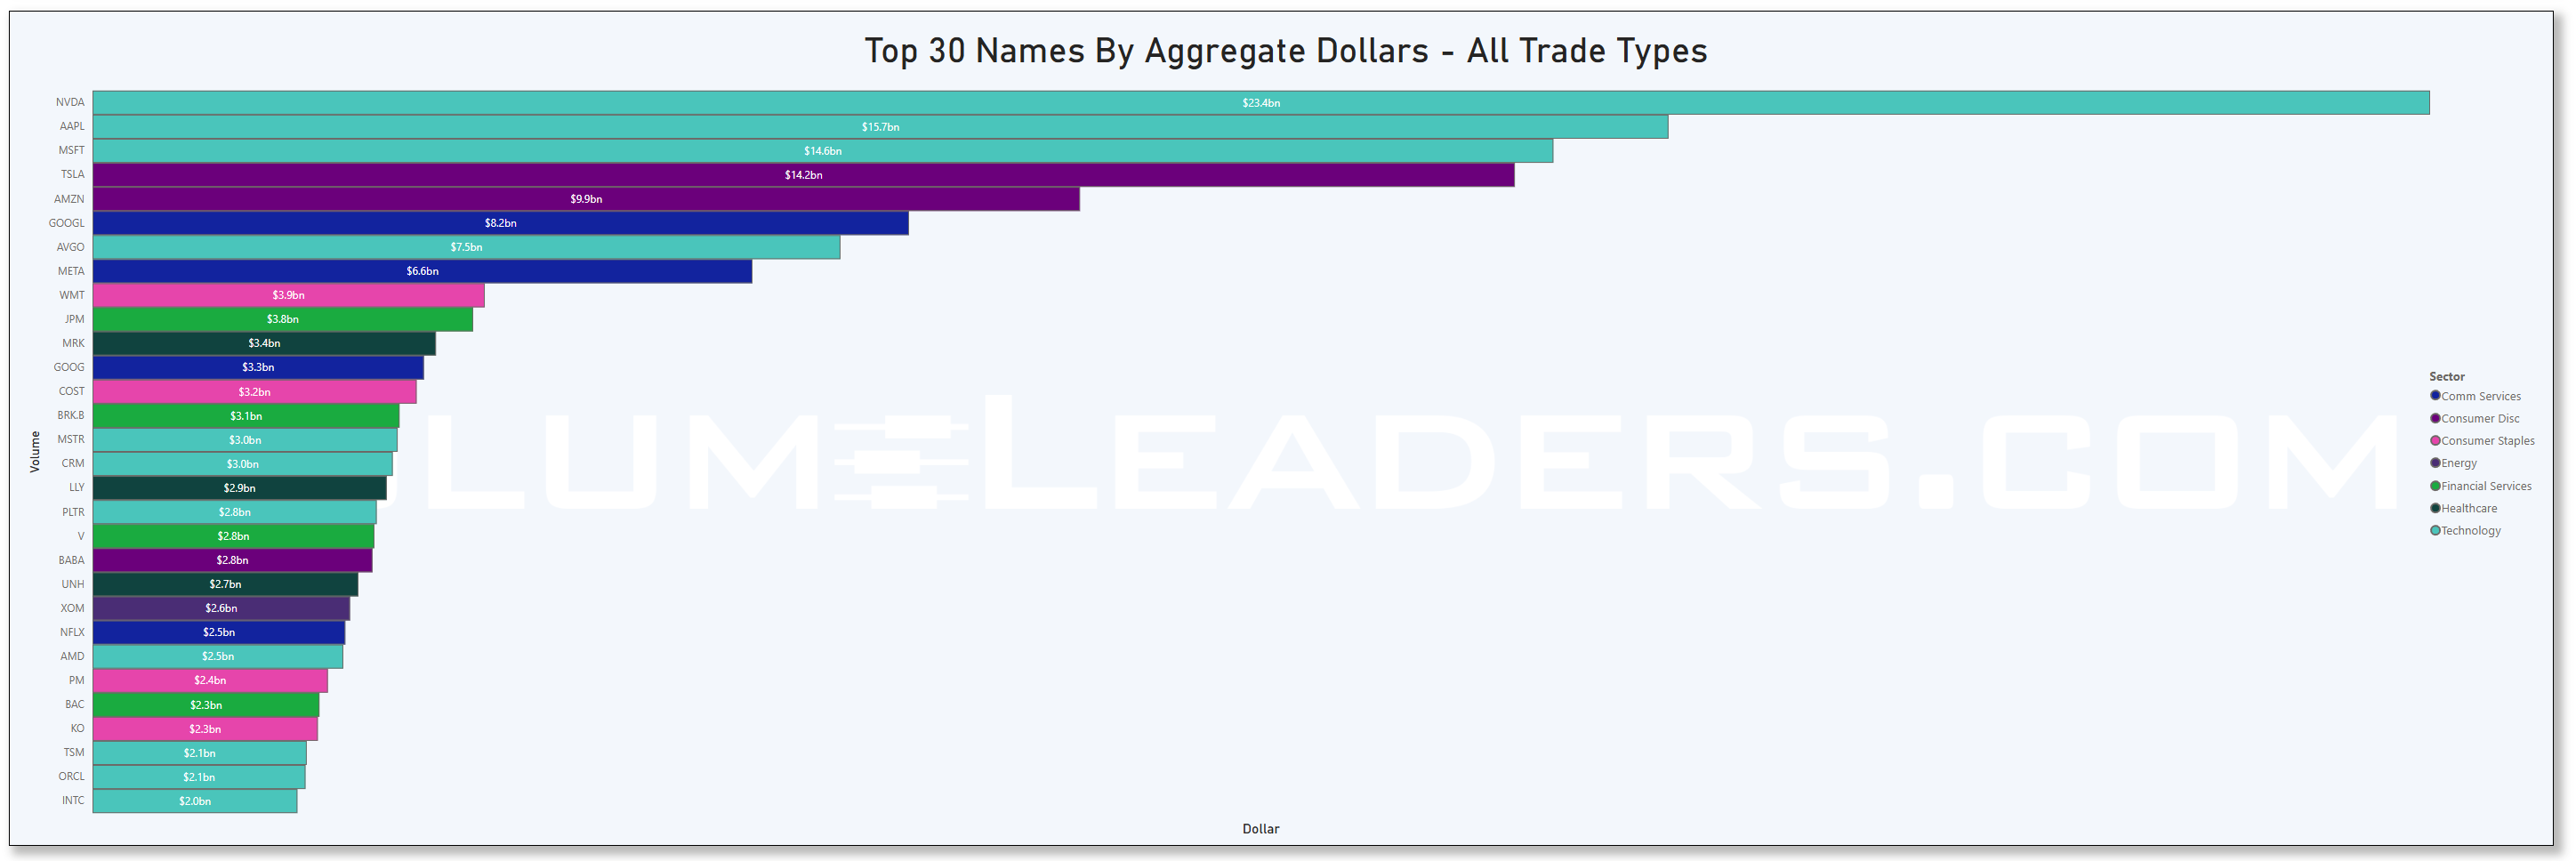
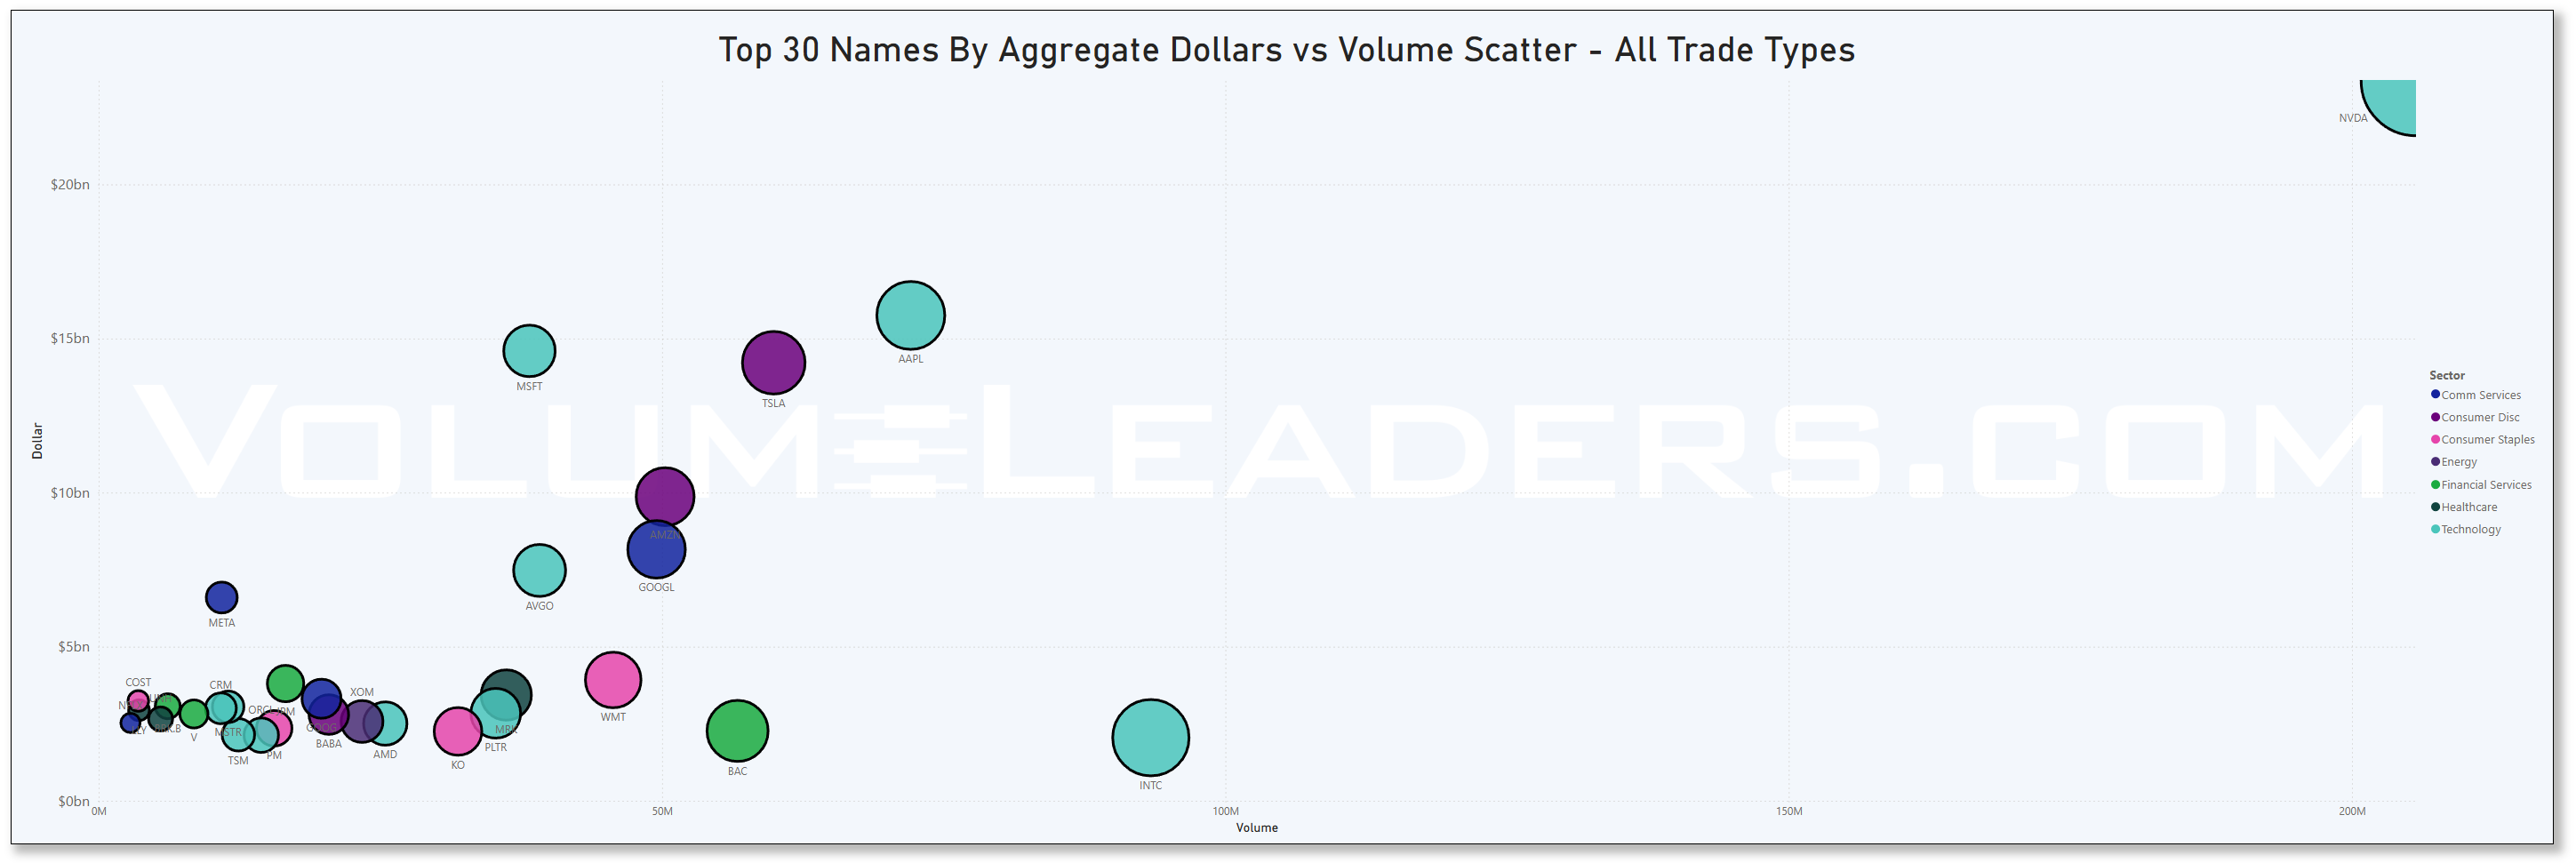
Top Institutional Order Flow In Equities
These are incredibly important charts to watch as they contains lots of nuanced suggestions at a thematic level. Watch these charts closely week-to-week to stay informed about where institutional money is flowing, adjust your strategies based on momentum, align your portfolio with macroeconomic and market trends, and manage risks more effectively by avoiding sectors losing institutional favor.
Sector Rotation Insights: The chart highlights which sectors are attracting institutional activity and which are losing favor. Institutions often lead market trends, so tracking shifts in their focus can indicate sector rotations.
Sentiment Analysis: The level of institutional activity reflects confidence in specific sectors. Rising activity in traditionally defensive sectors (e.g., healthcare, utilities) may indicate caution, while a surge in growth sectors (e.g., technology, consumer discretionary) could suggest optimism.
Emerging Trends: Sudden spikes in a previously overlooked sector, like industrials or consumer staples, might hint at emerging opportunities or structural shifts.
Macro Themes: Changes in sector activity often align with broader macroeconomic themes like inflation, interest rates, or geopolitical events. For instance:
Increased activity in energy might indicate concerns about oil supply or rising prices.
Growth in technology could align with innovations or favorable policies.
Risk Management: Declining institutional activity in a sector might signal weakening fundamentals or heightened risks.
Spotting Overcrowding: Excessive activity in a single sector over multiple weeks may suggest overcrowding, which could lead to heightened volatility if institutions begin to exit.
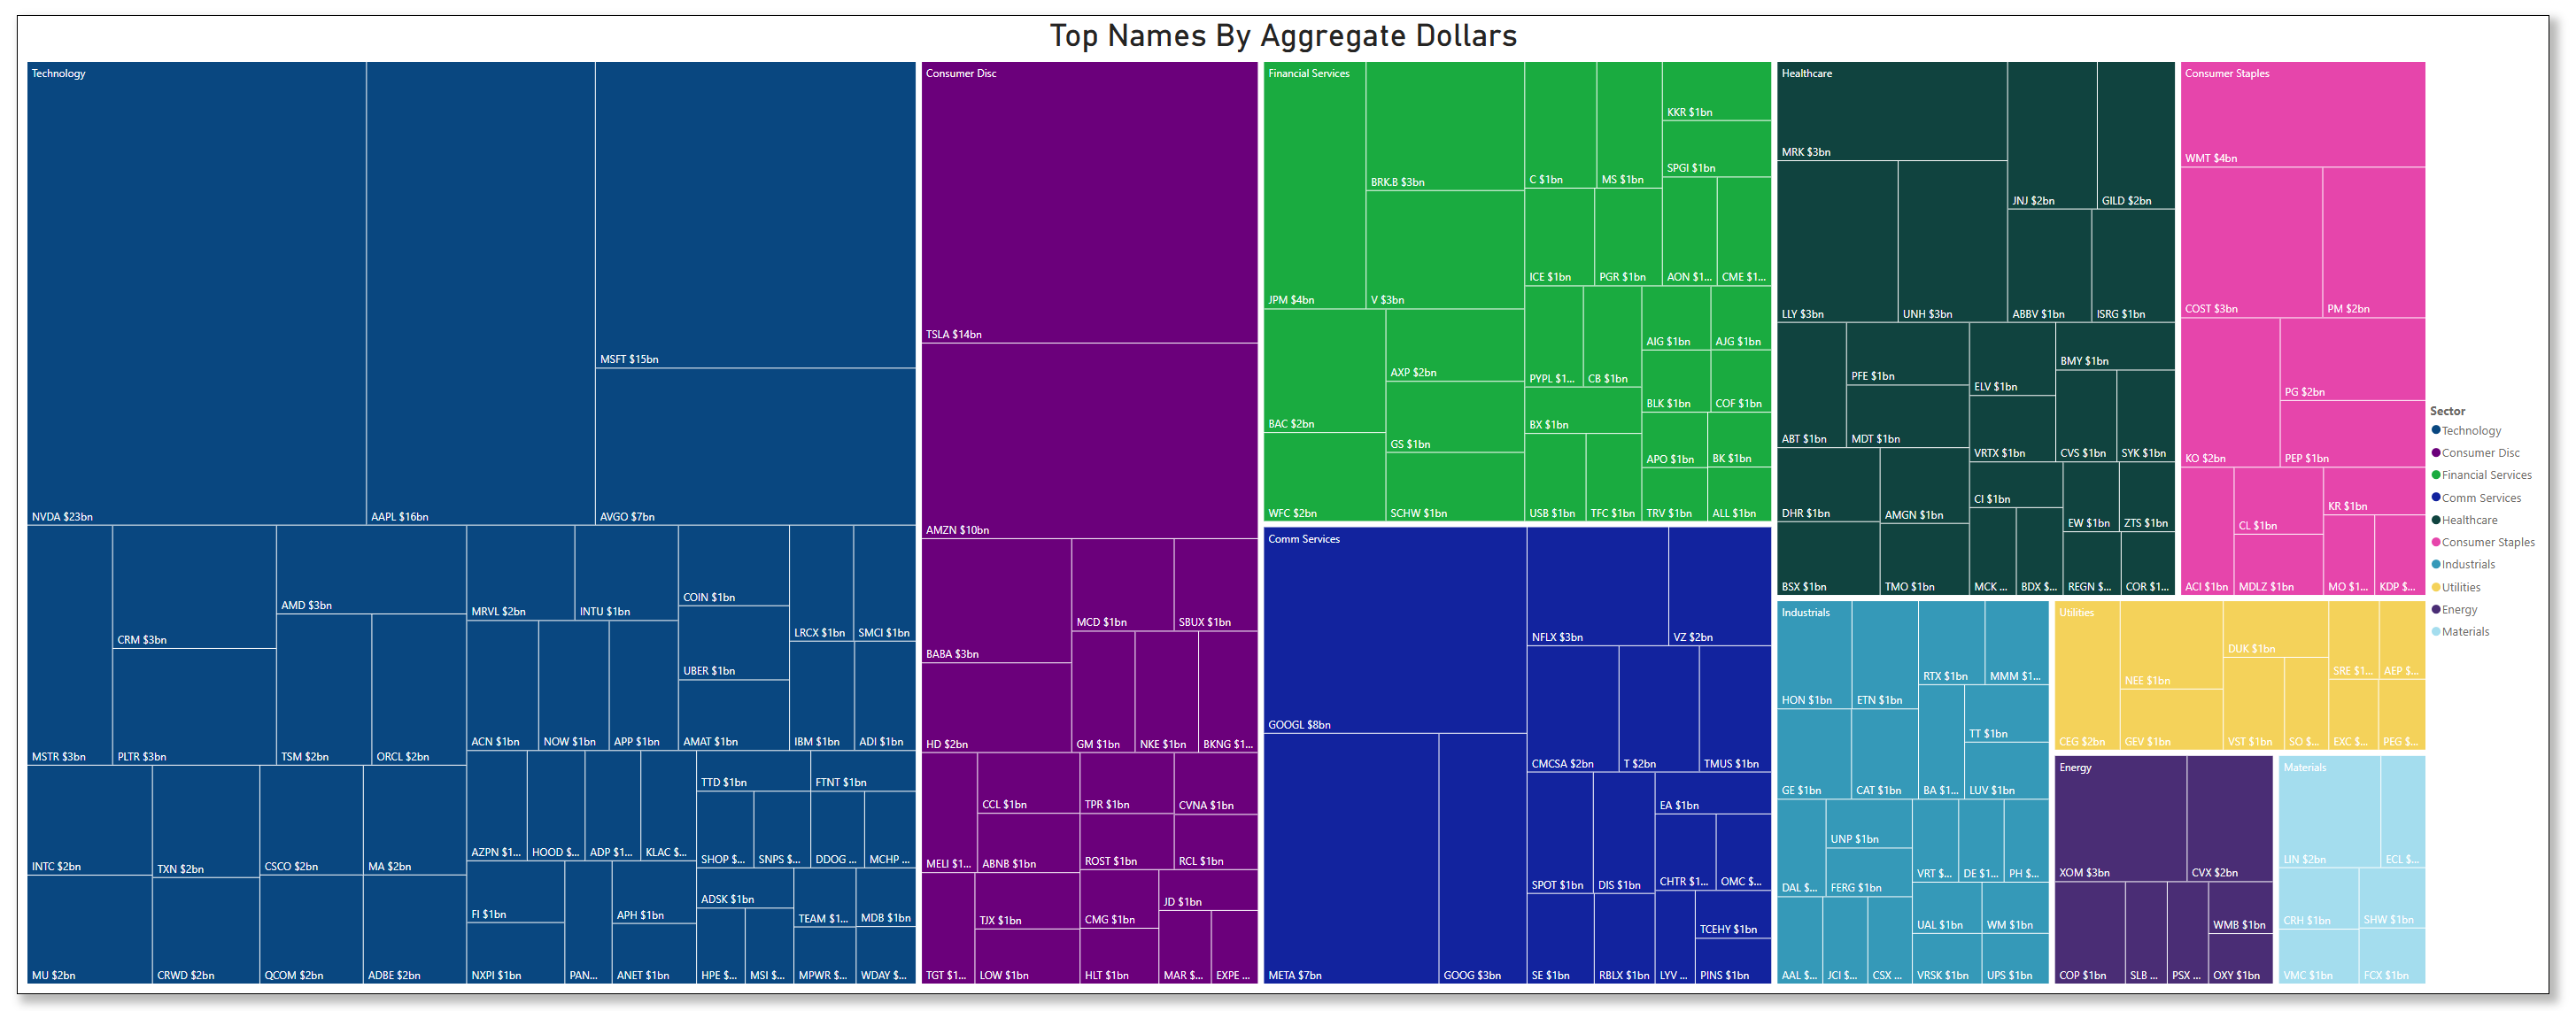
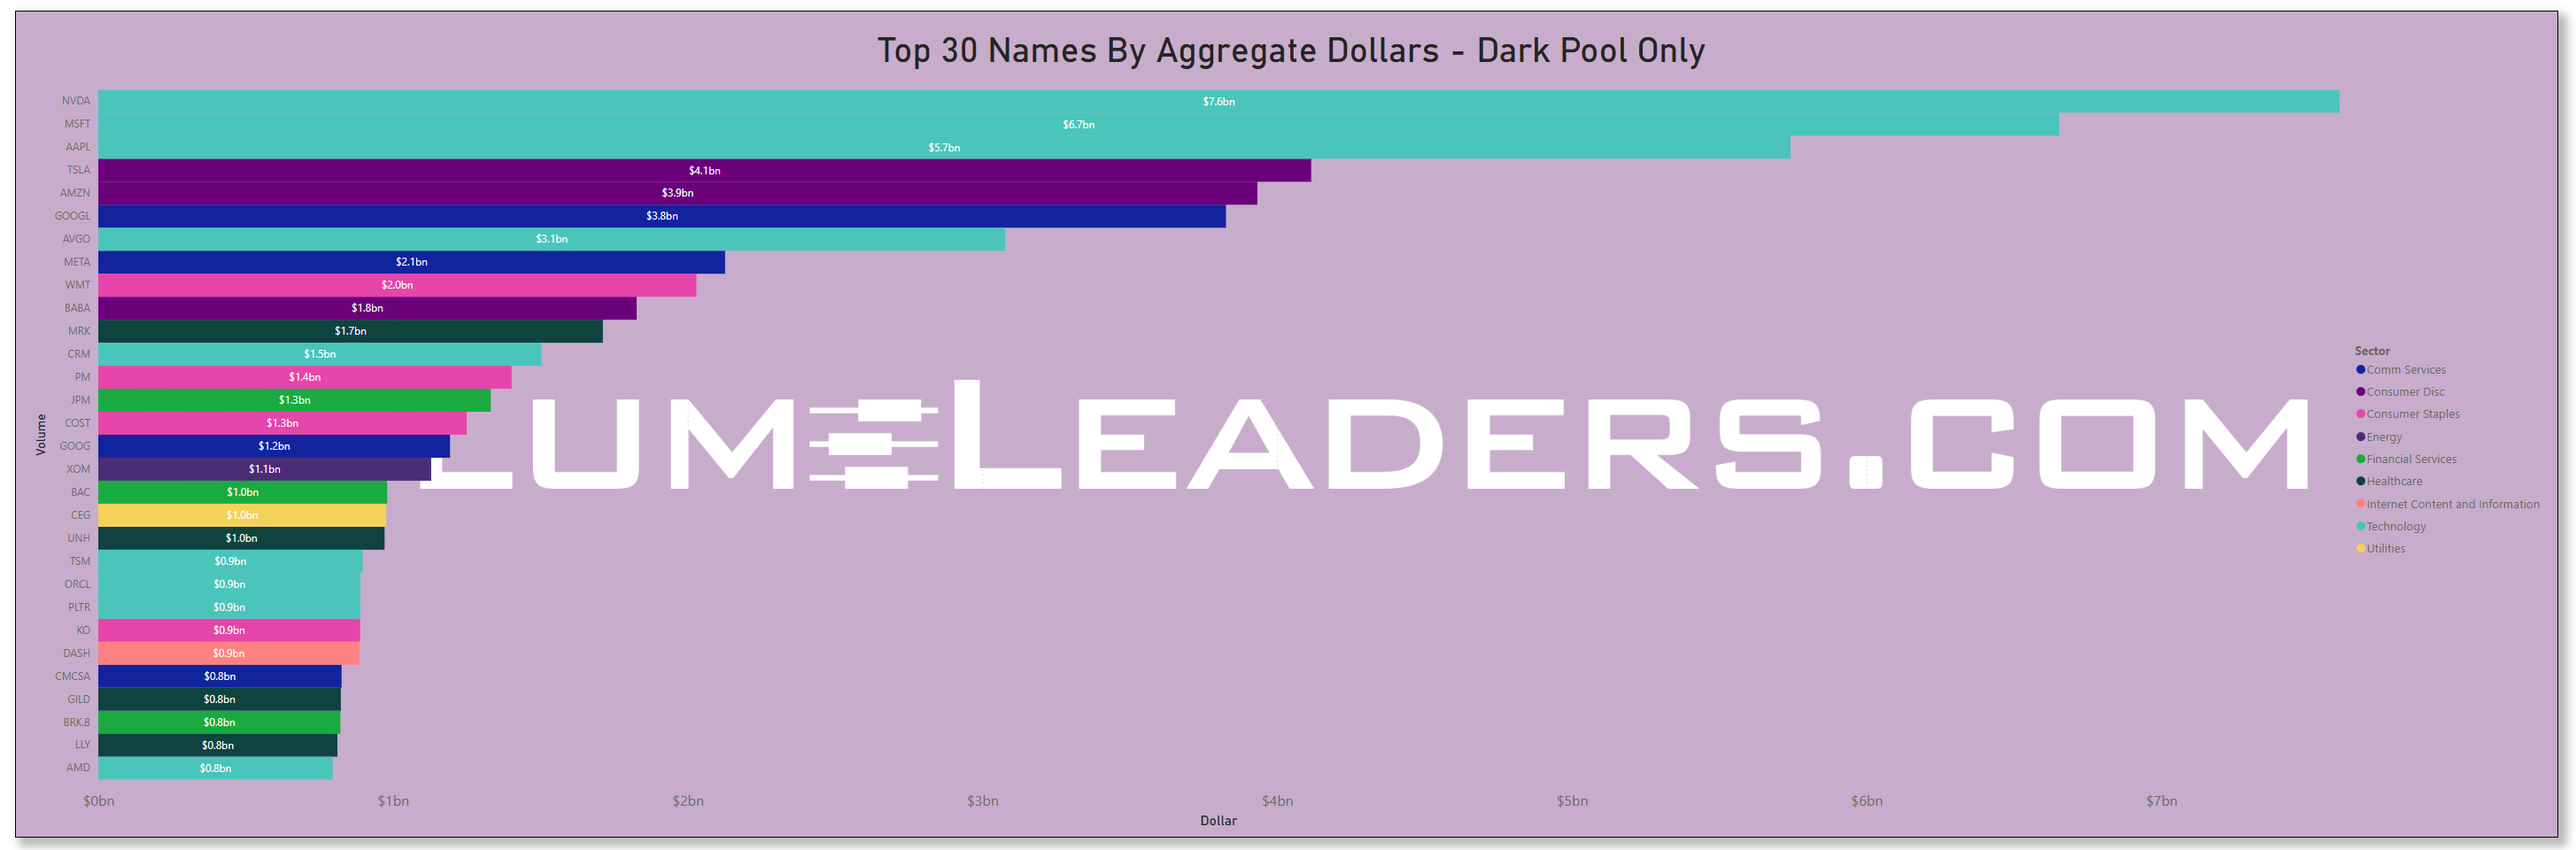
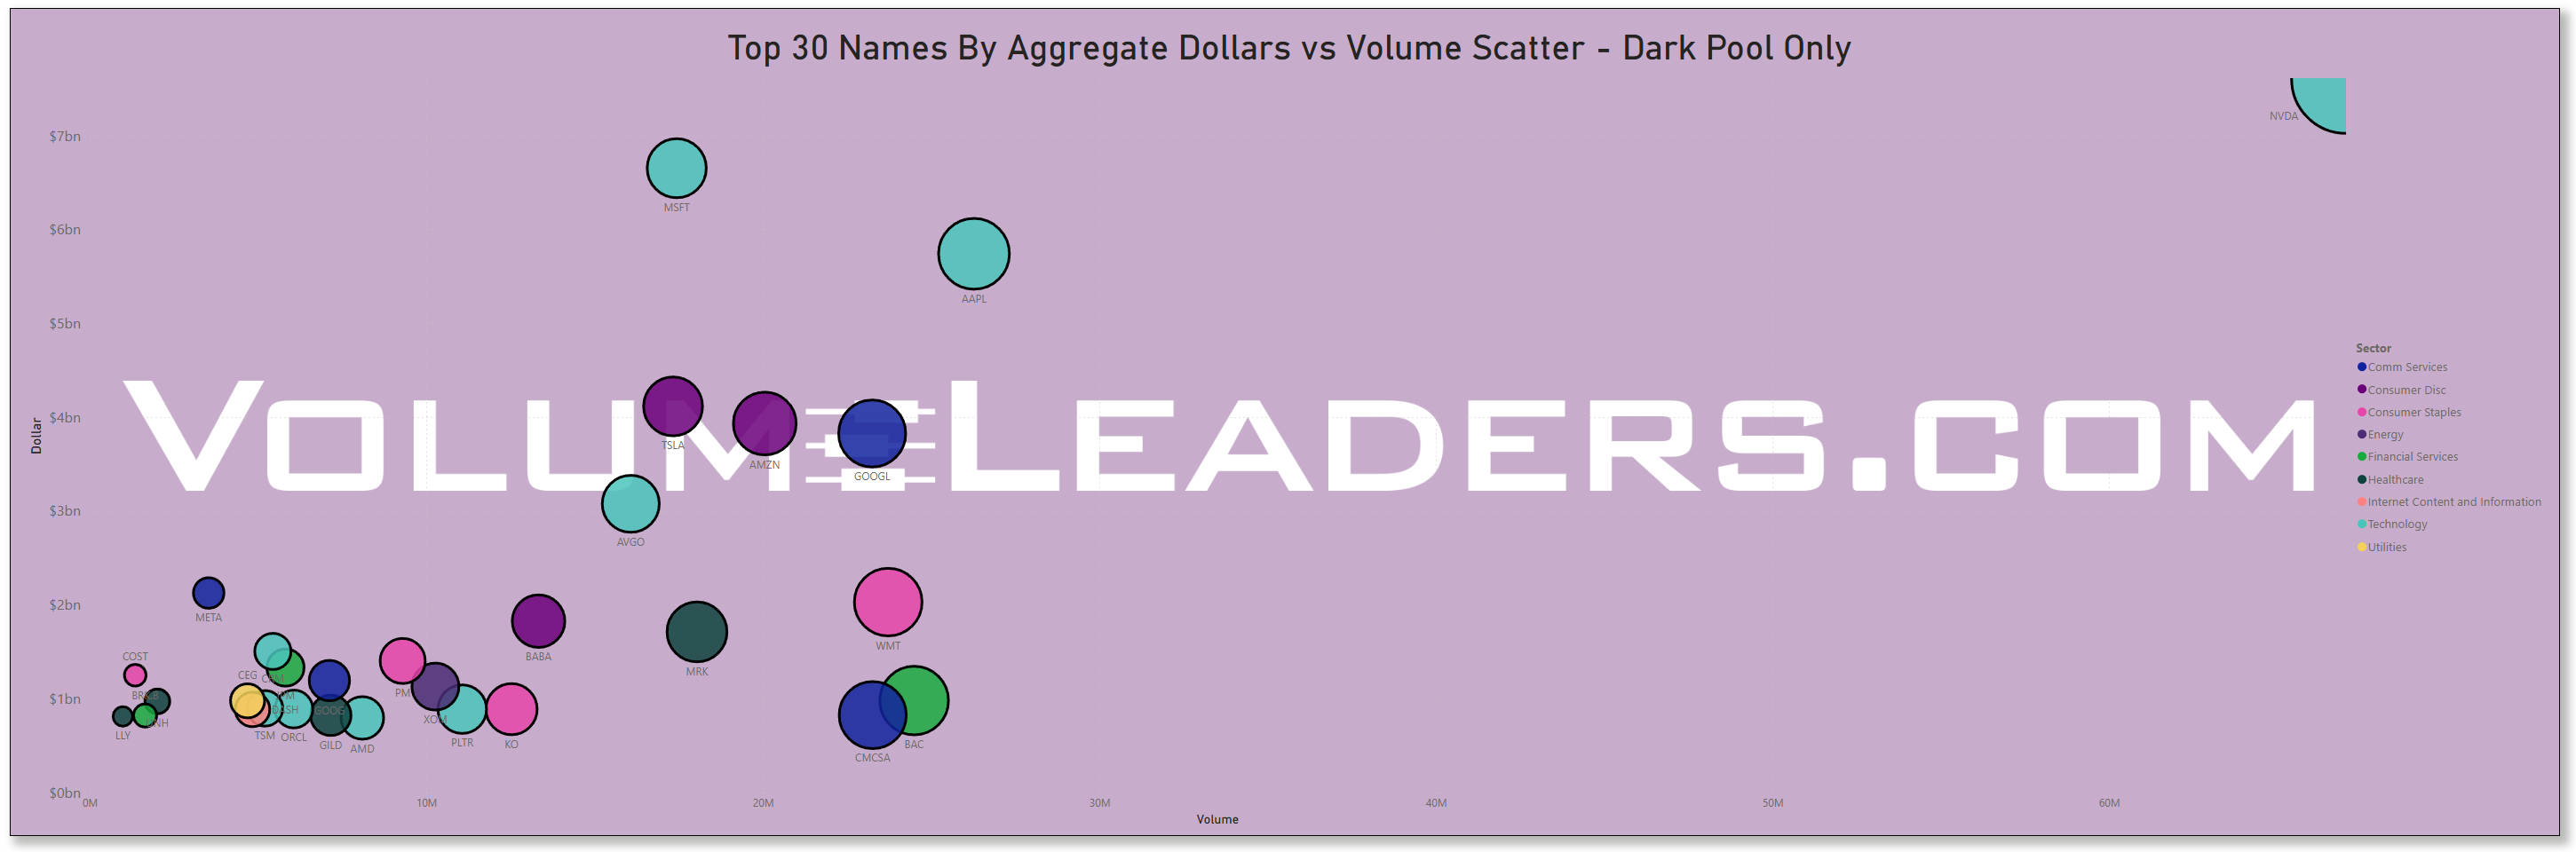
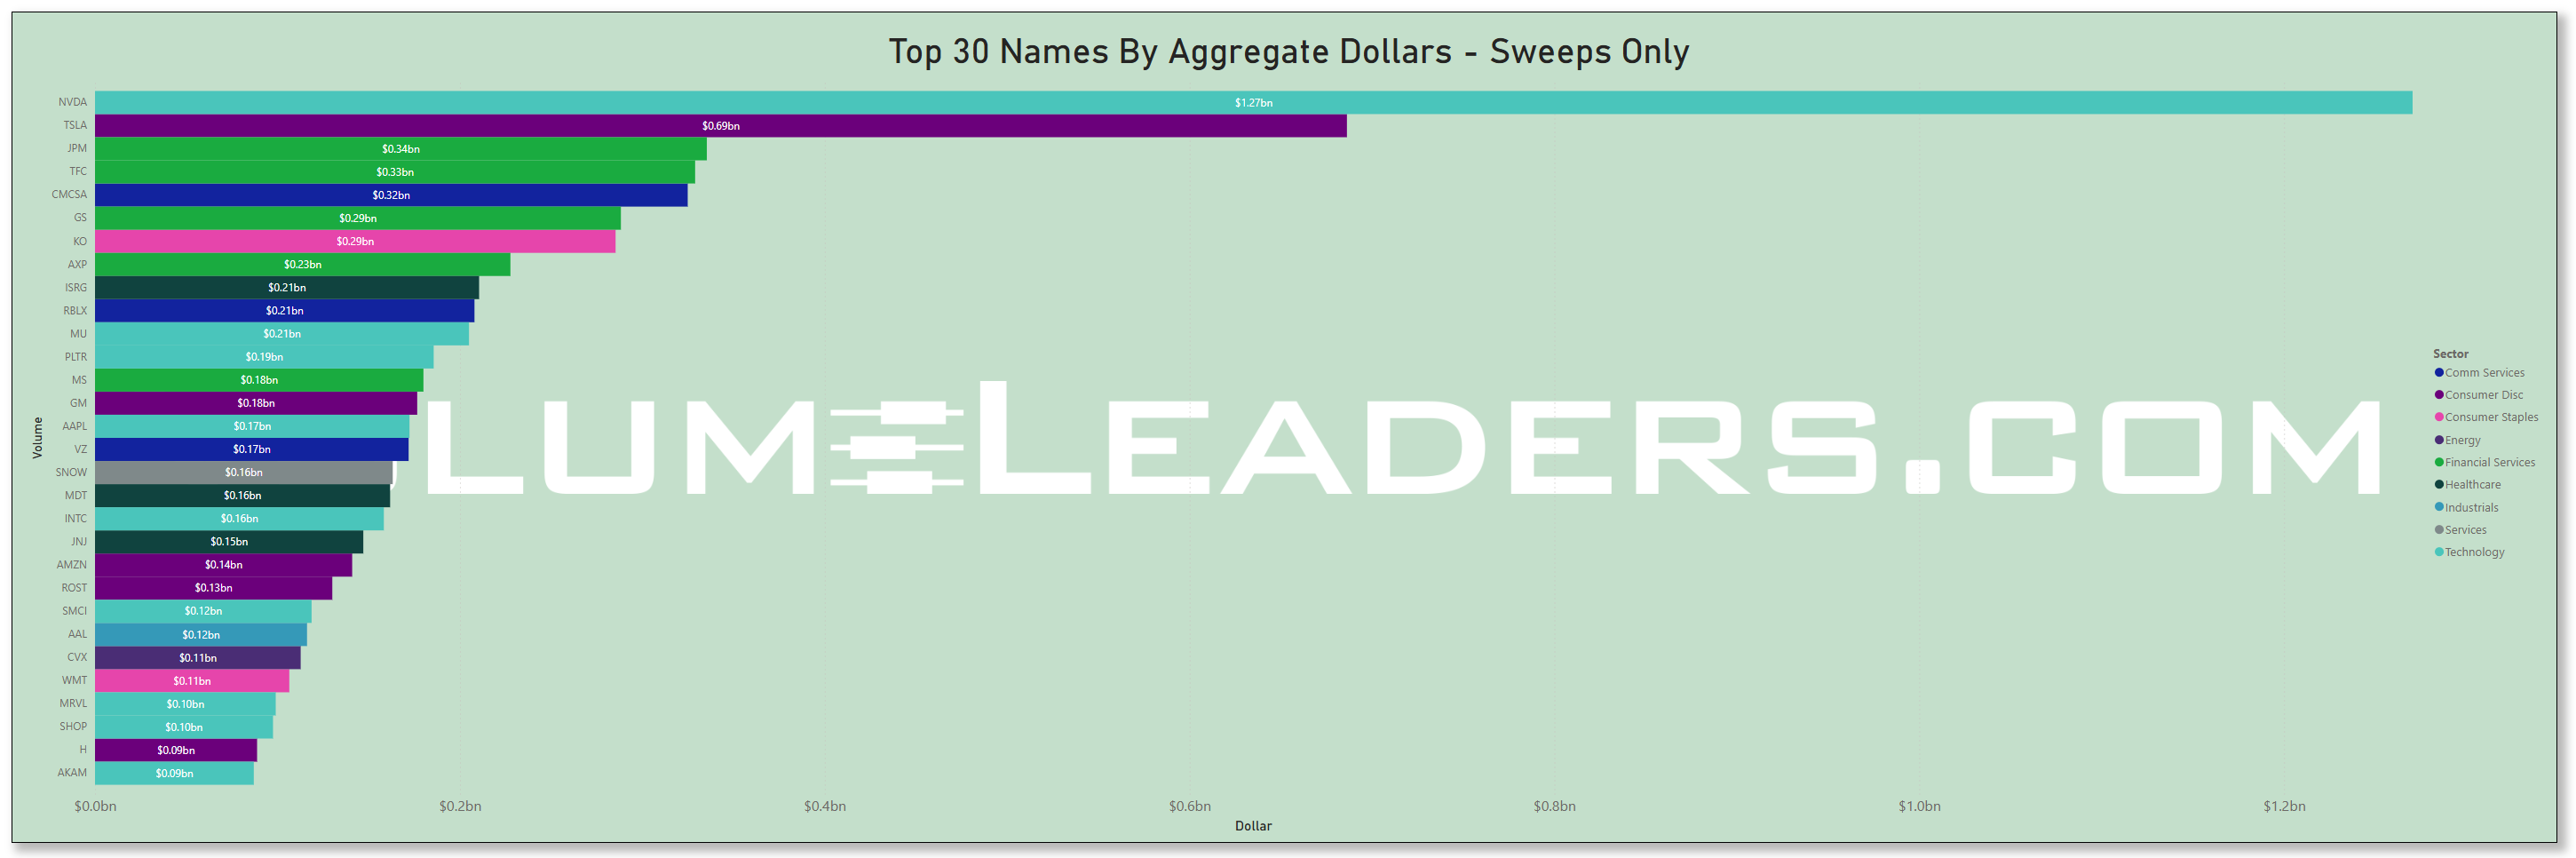
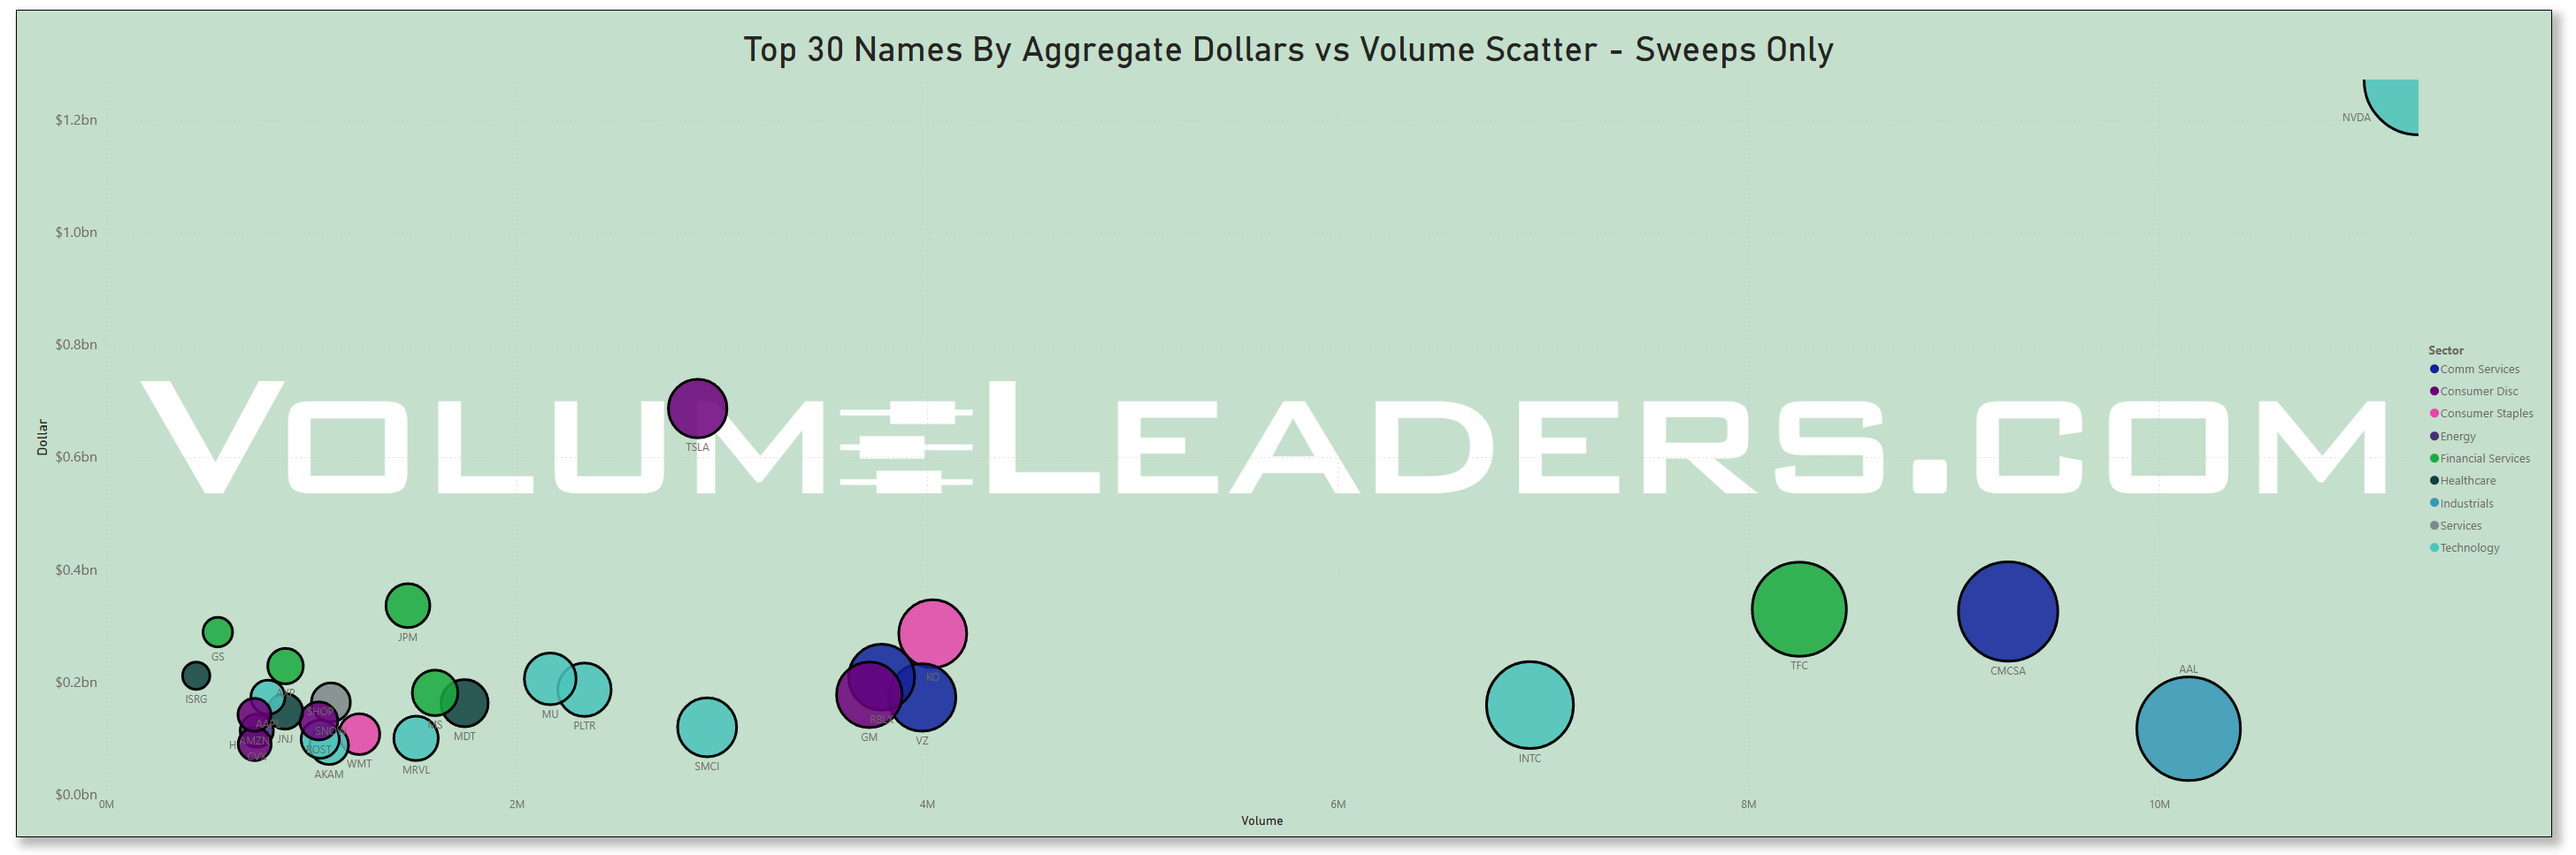
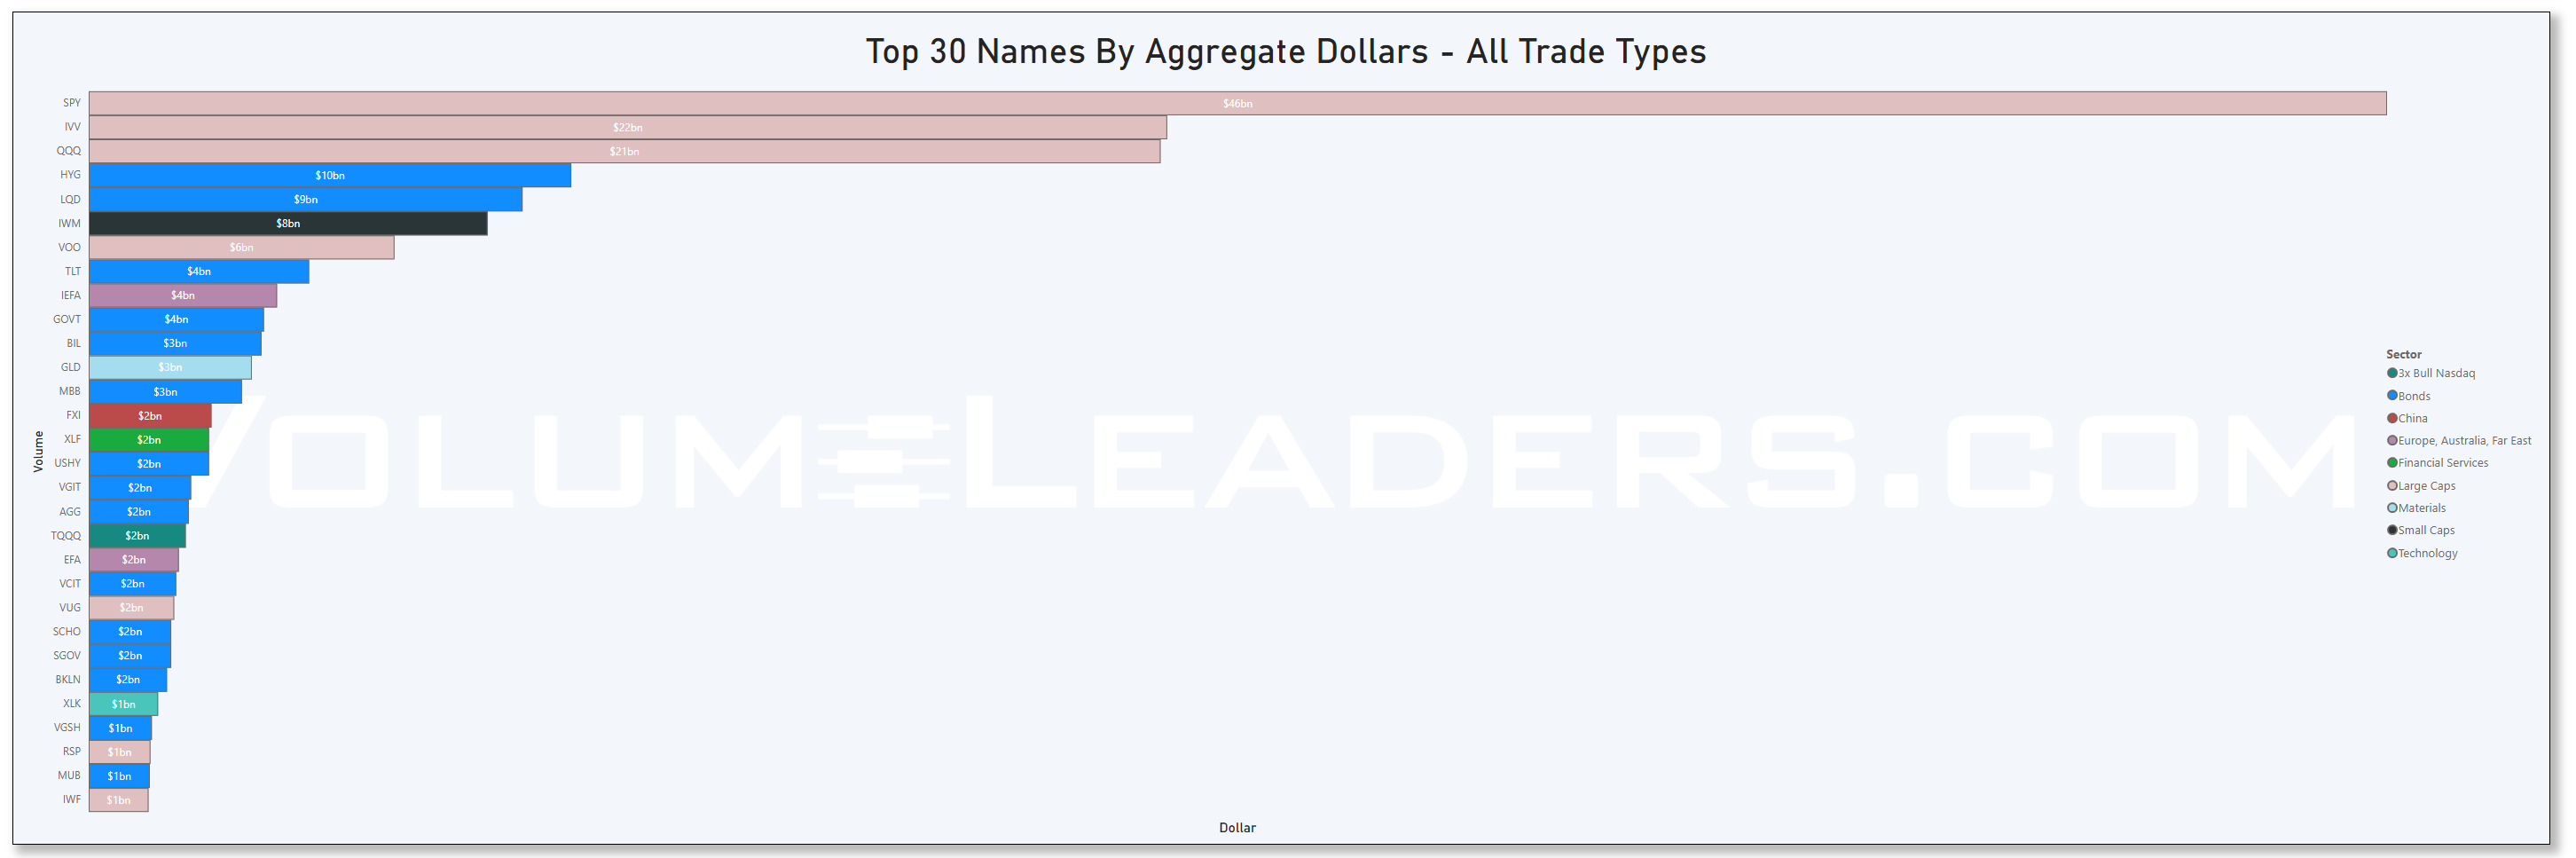
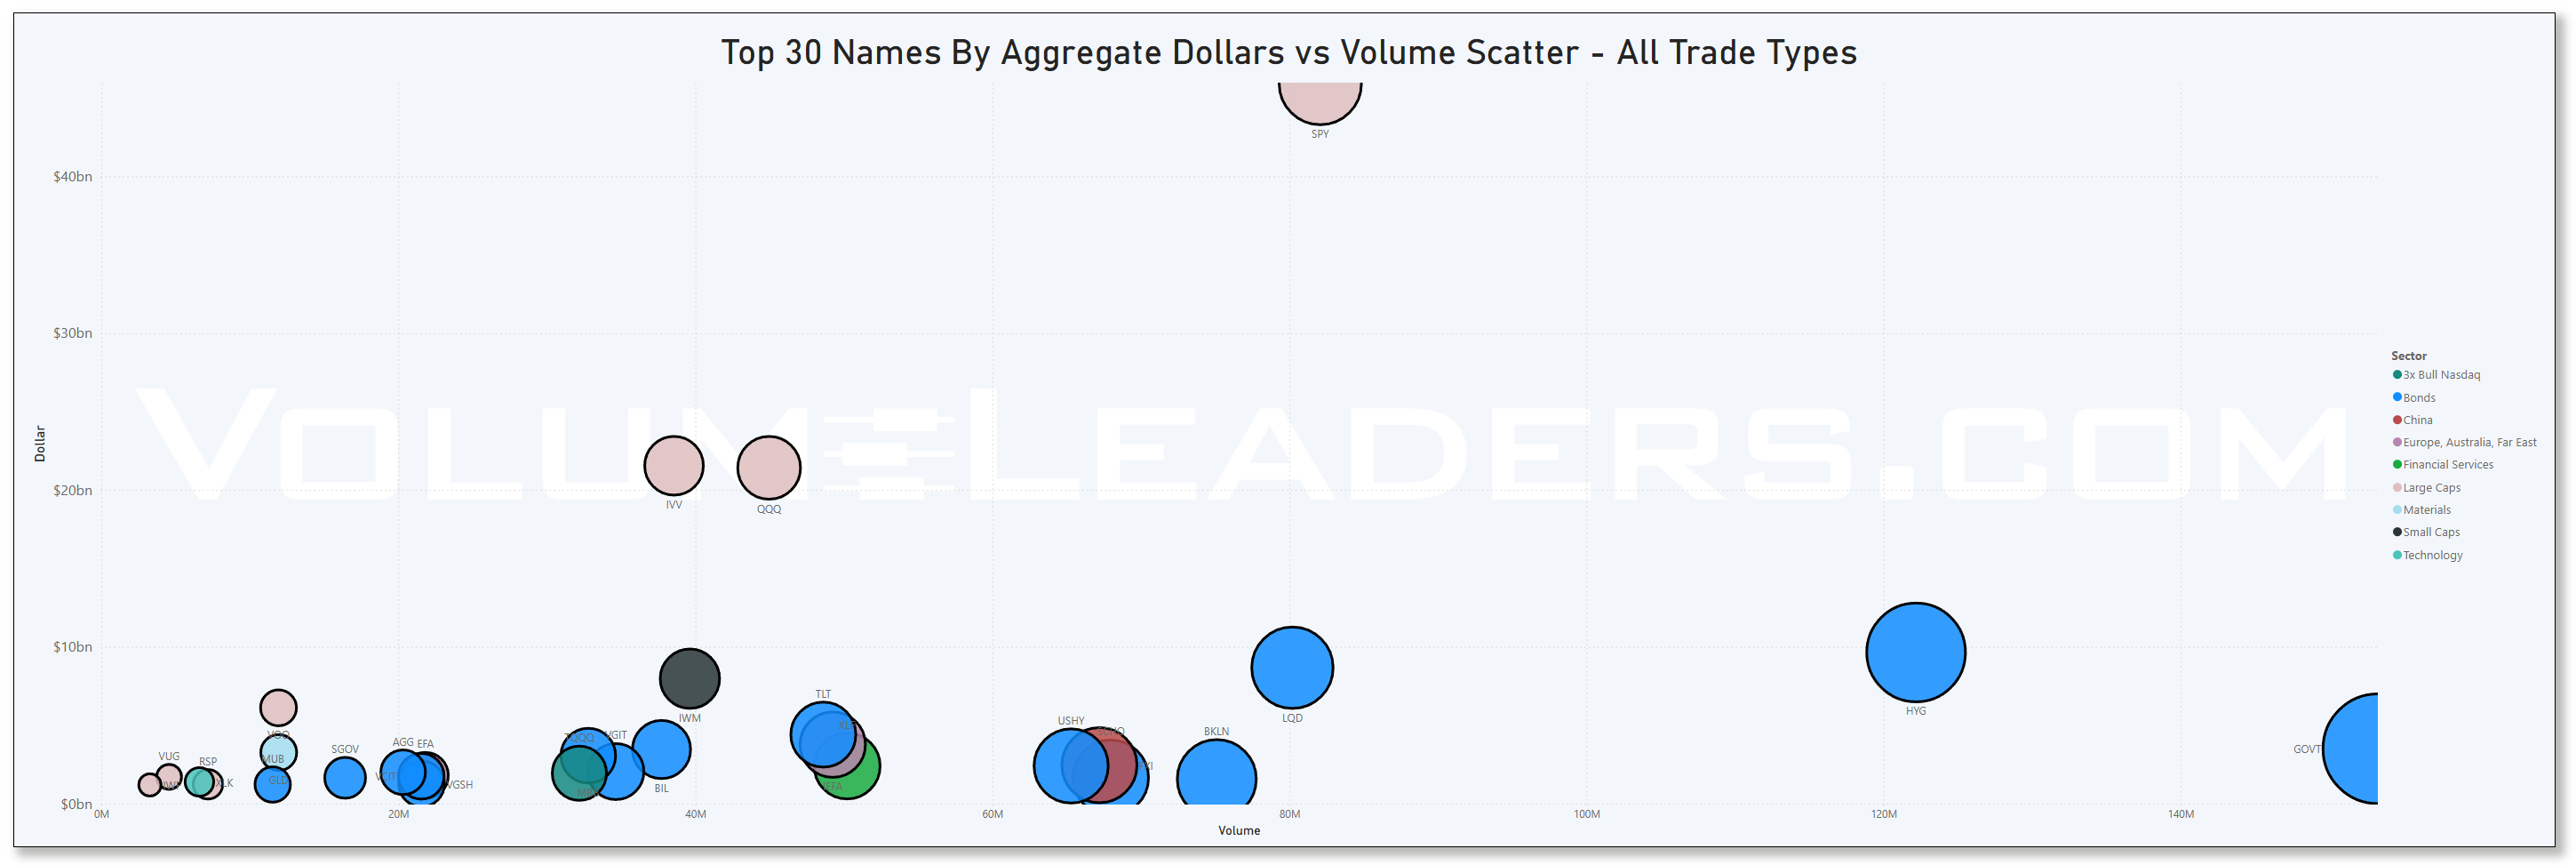
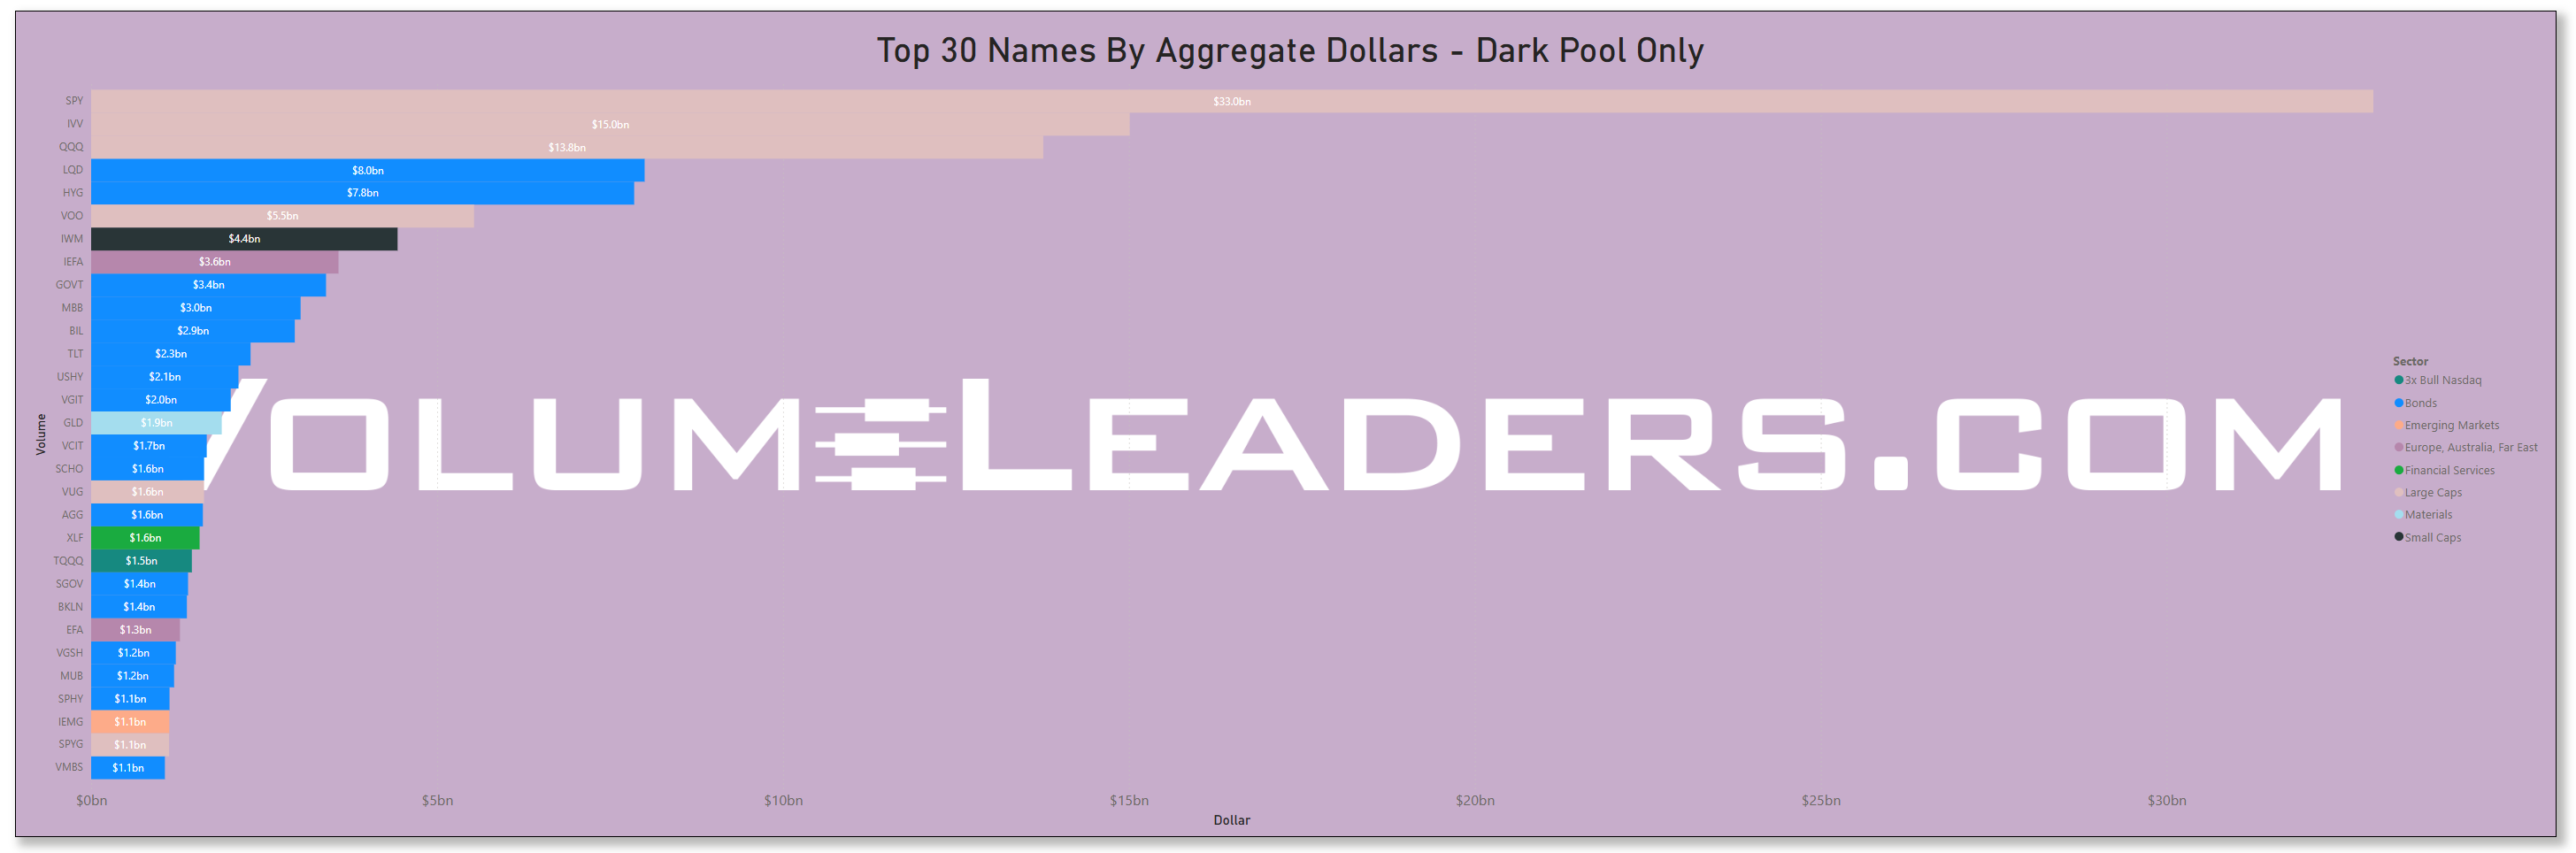
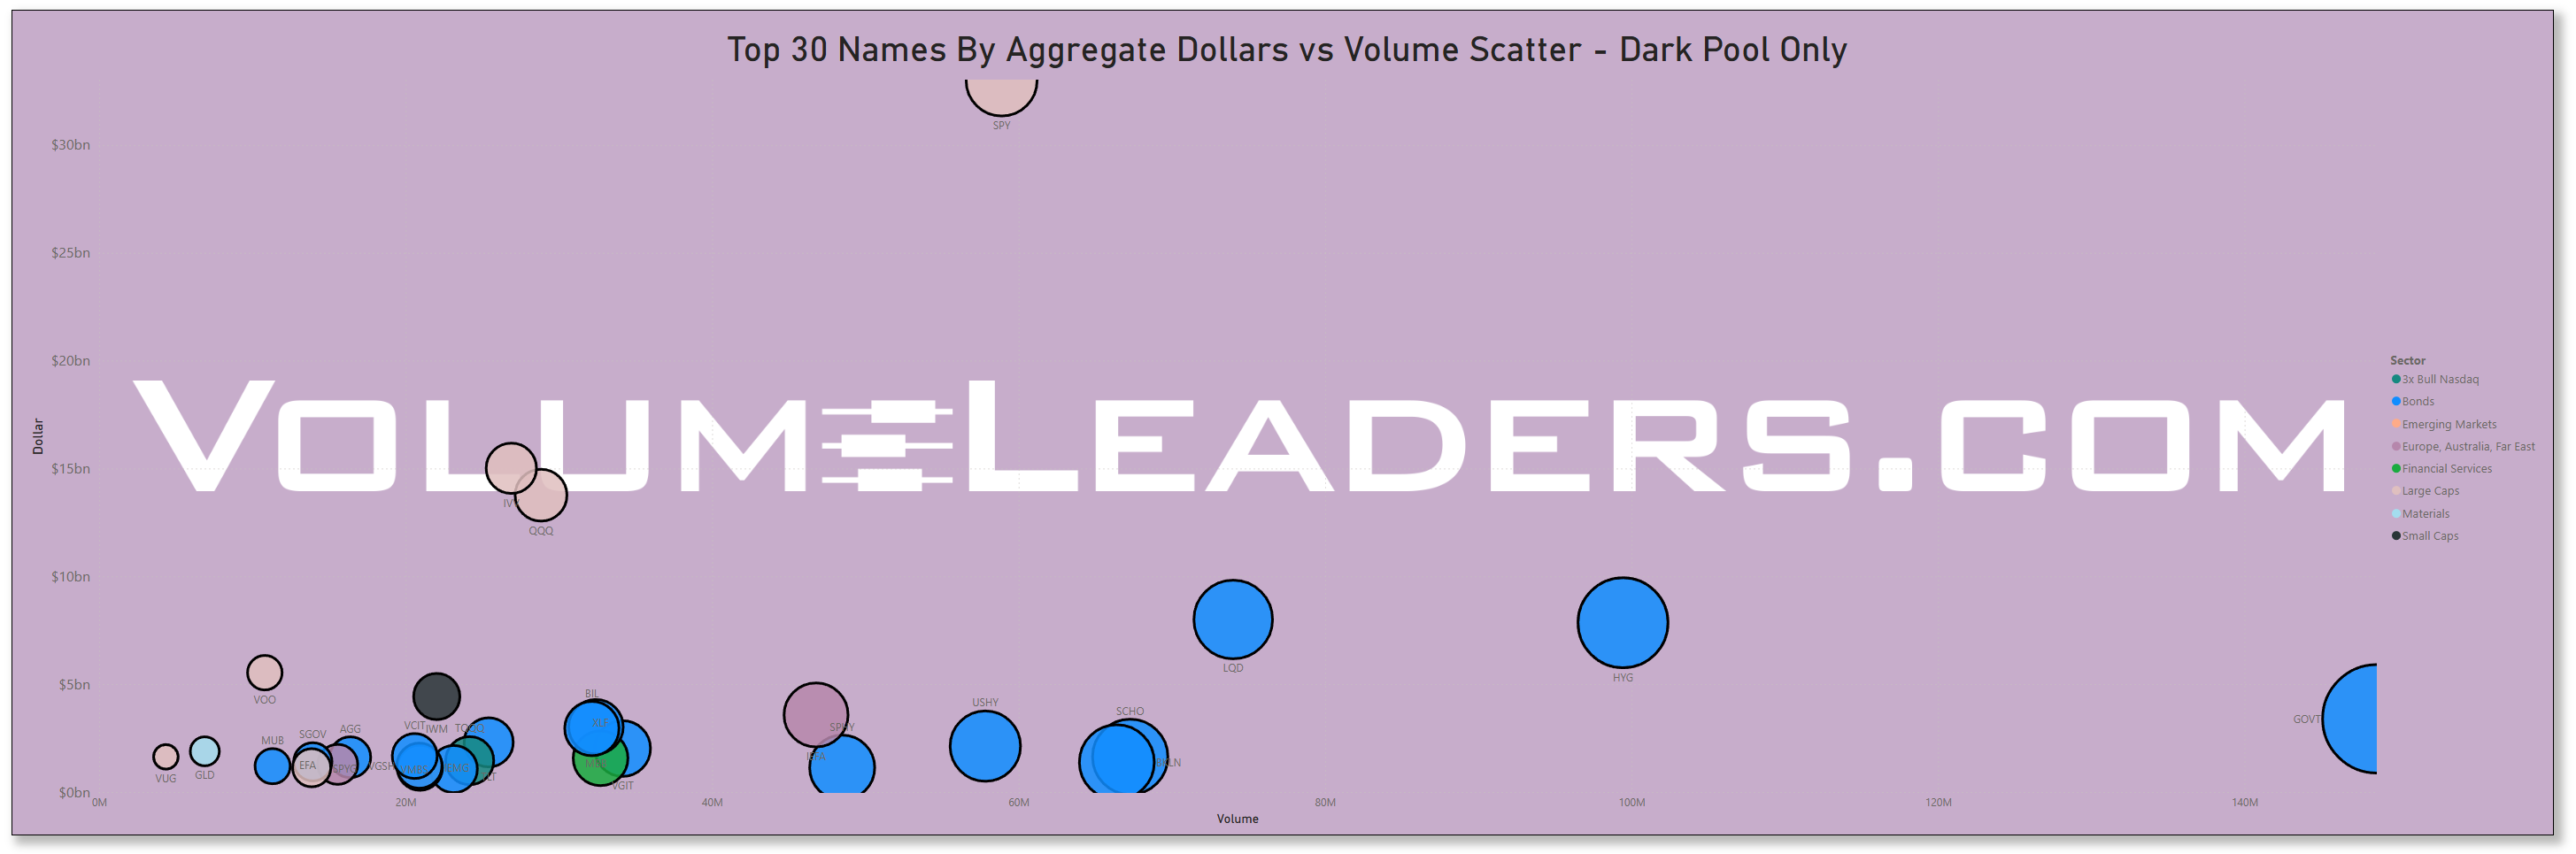
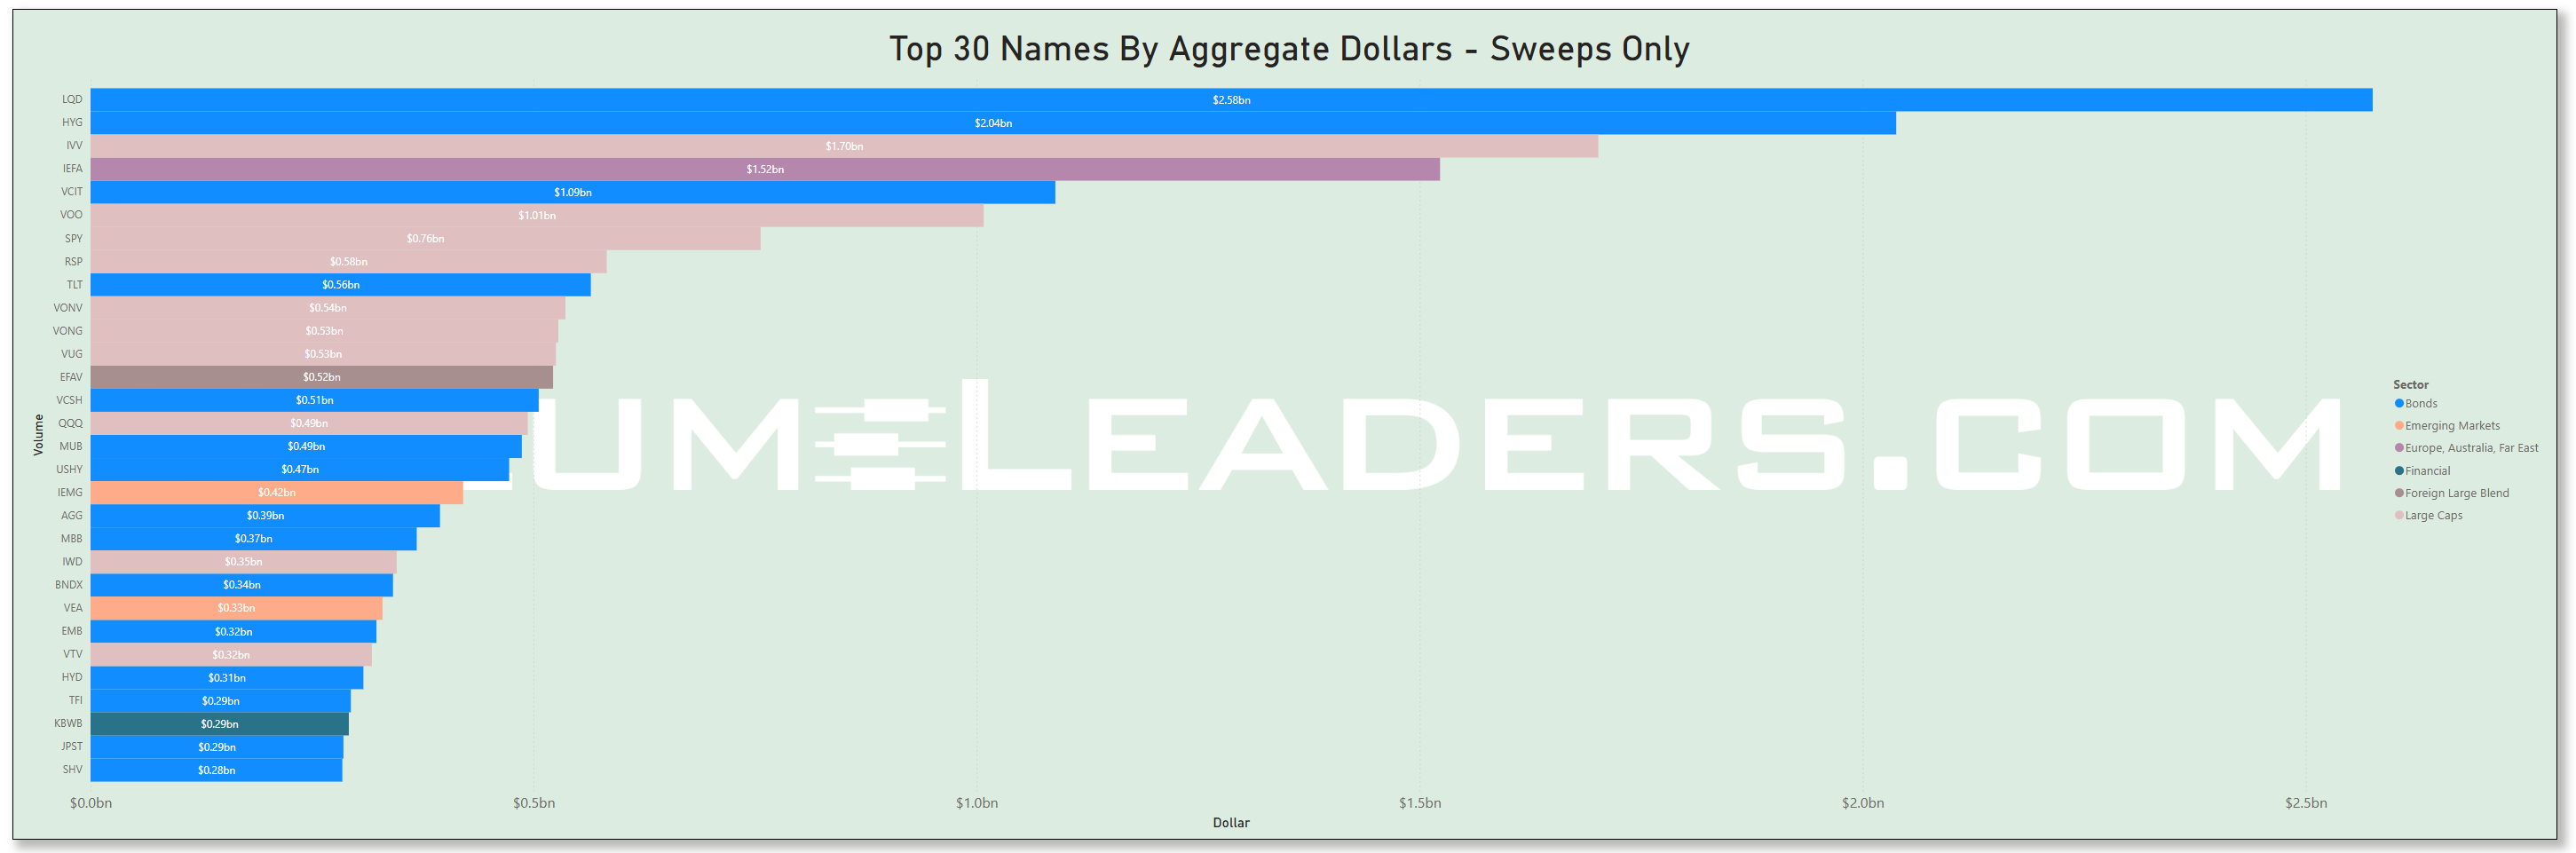
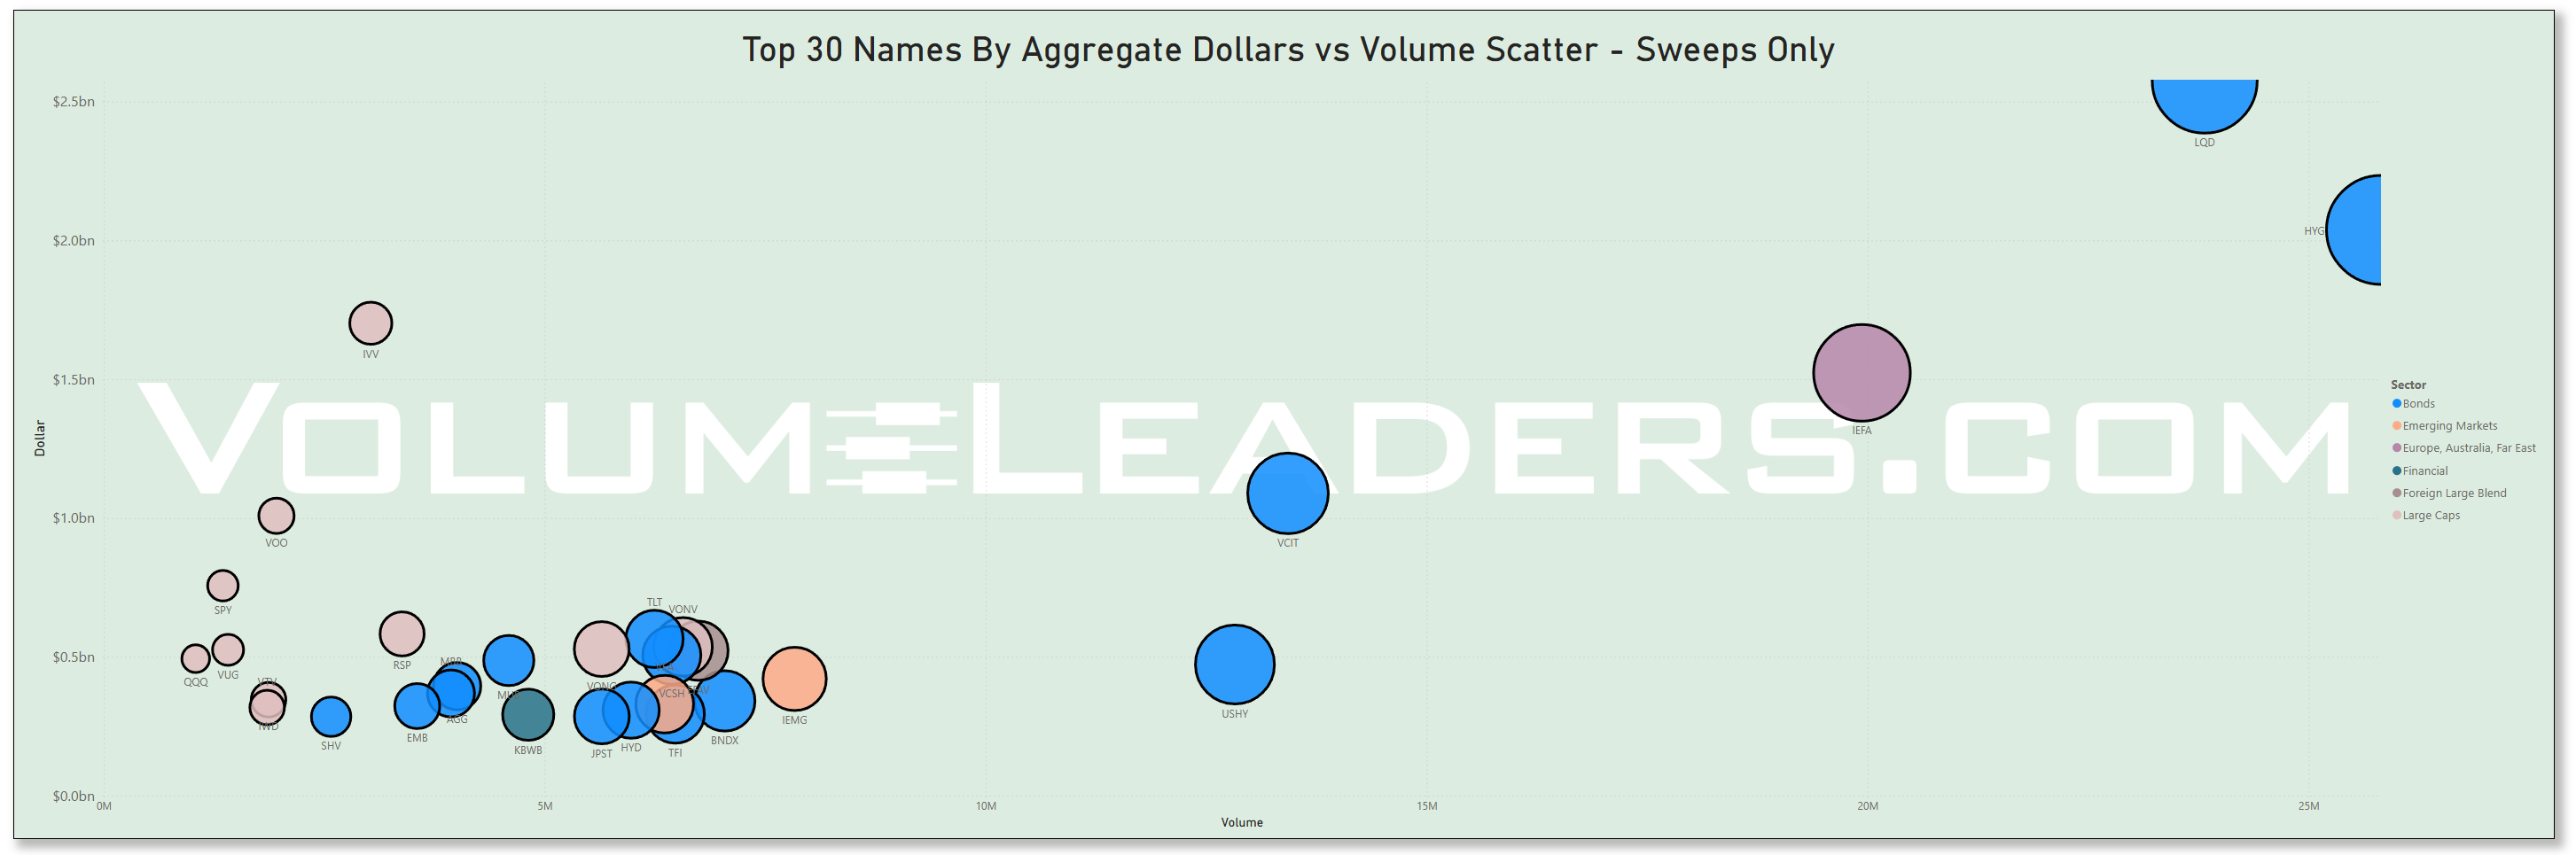
Many excellent trade ideas and sources of inspiration can be found in these prints below. While only the top 30 from each group are displayed, the complete results are accessible in VolumeLeaders.com for you to explore at your convenience any time. Remember to configure trade alerts within the platform to ensure institutional order flows that capture your interest or are significant to you aren’t missed. The blue charts encompass all types of trades, including blocks on lit exchanges; the purple charts exclusively depict dark pool trades; and the green charts represent sweeps only.
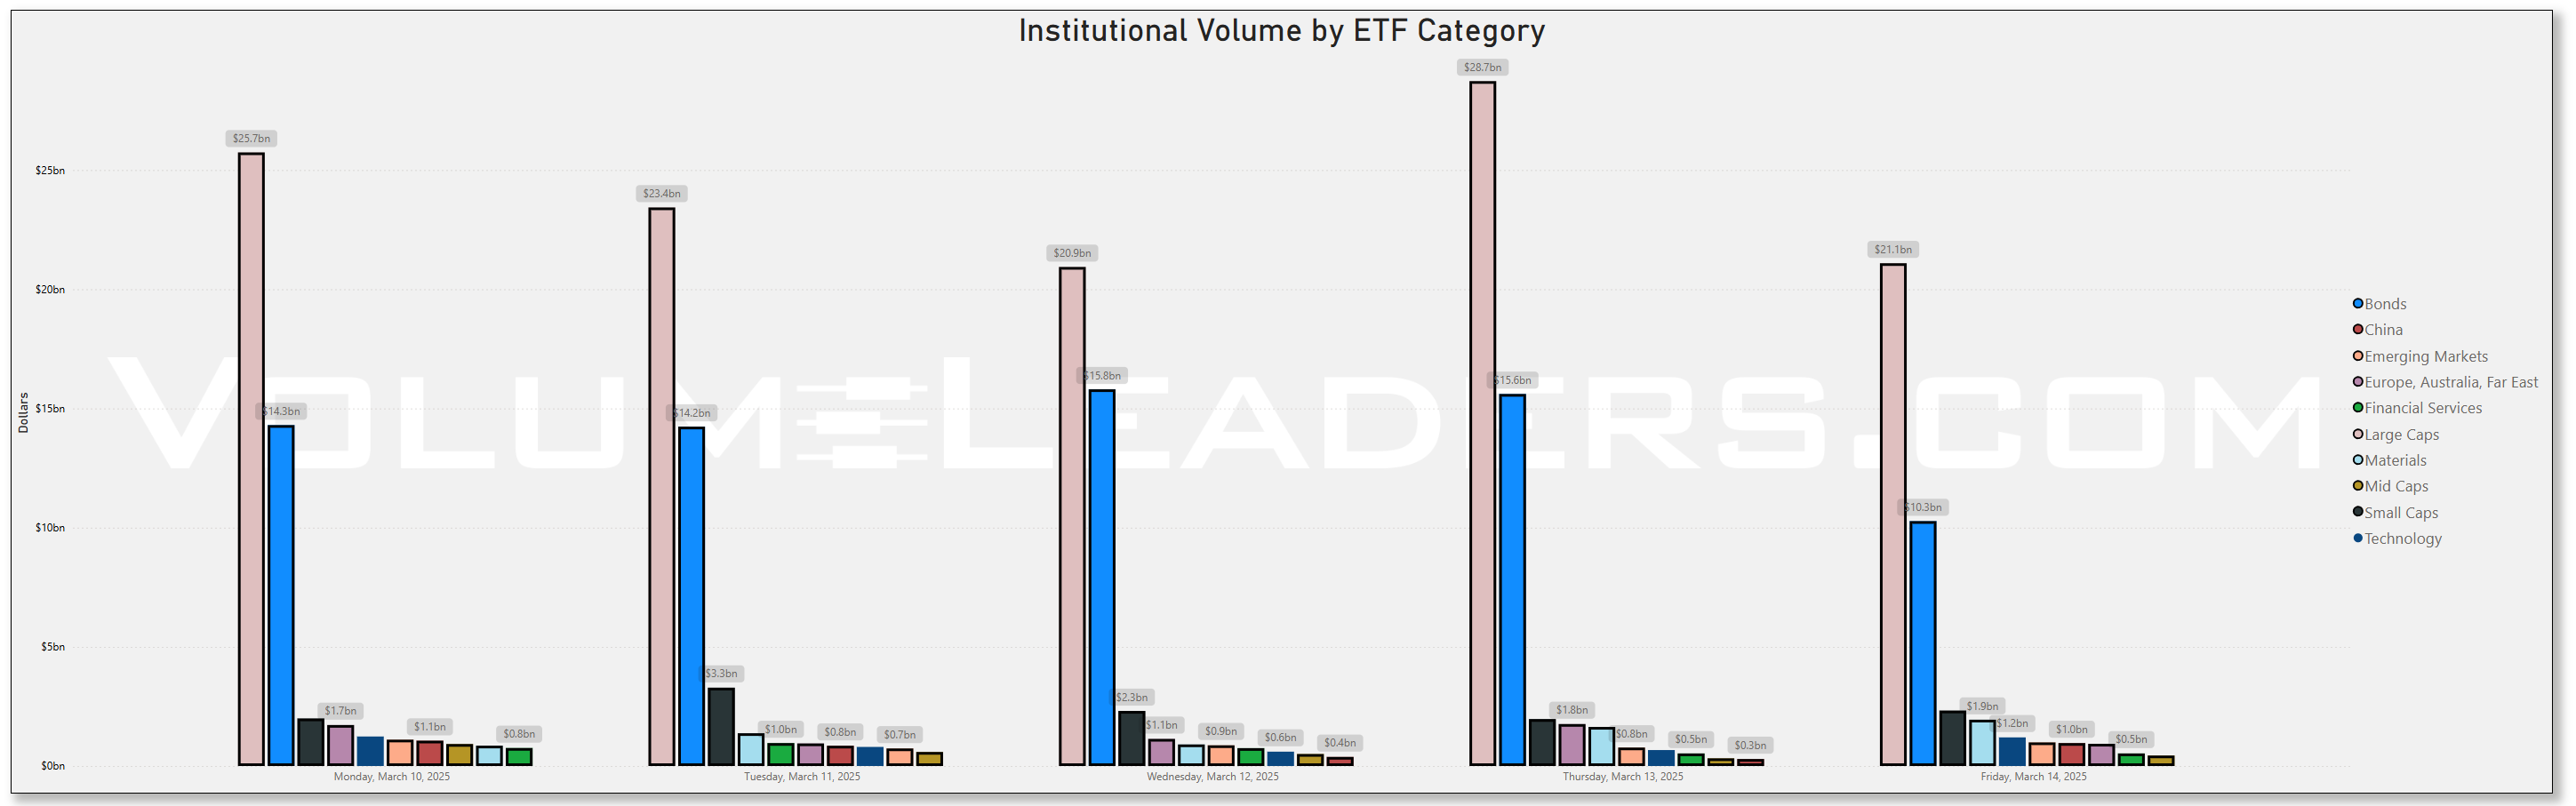
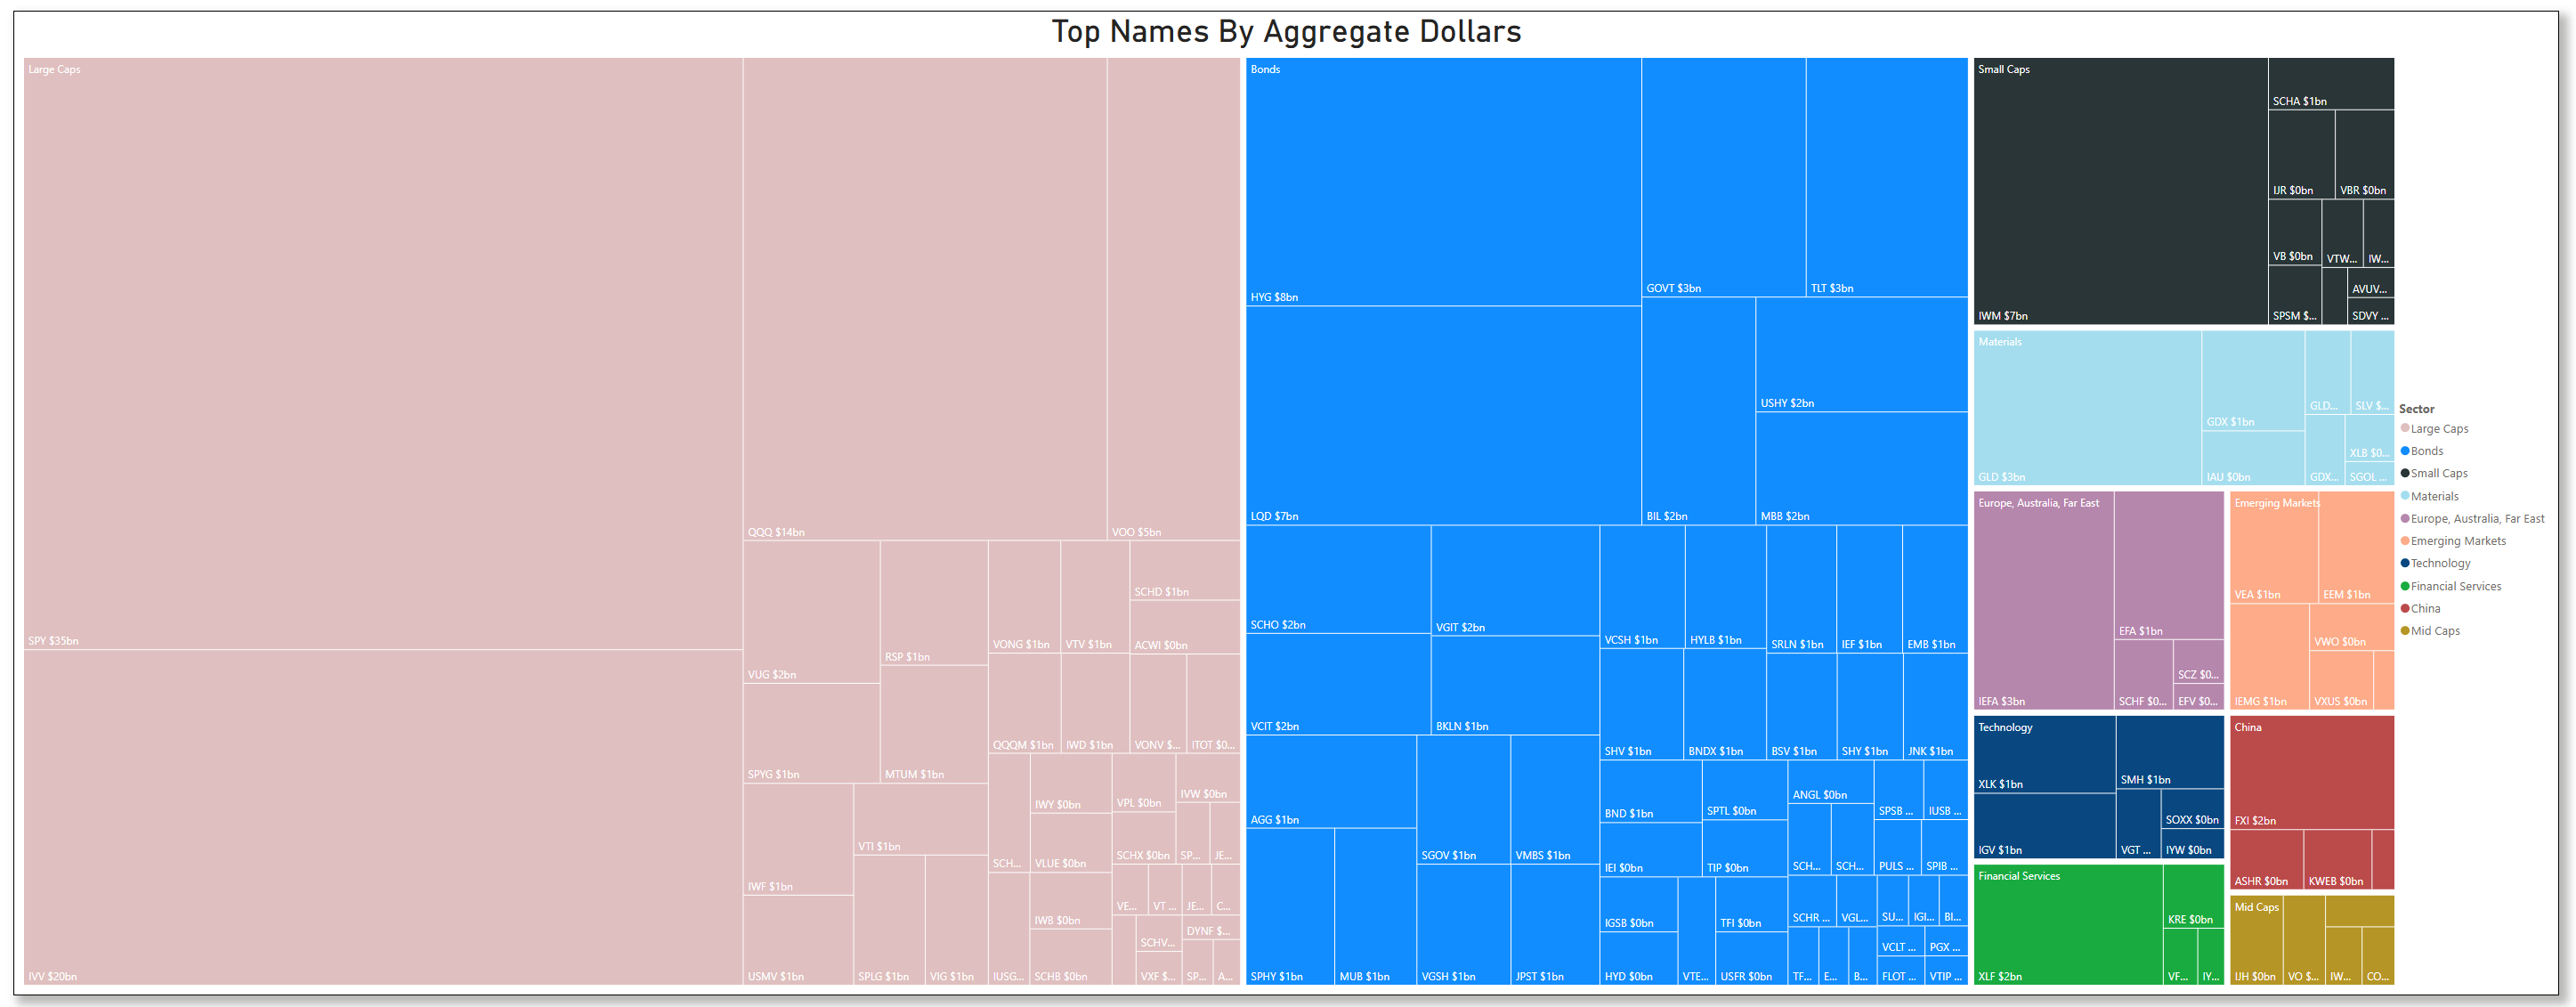
Top Institutional Order Flow In ETFs
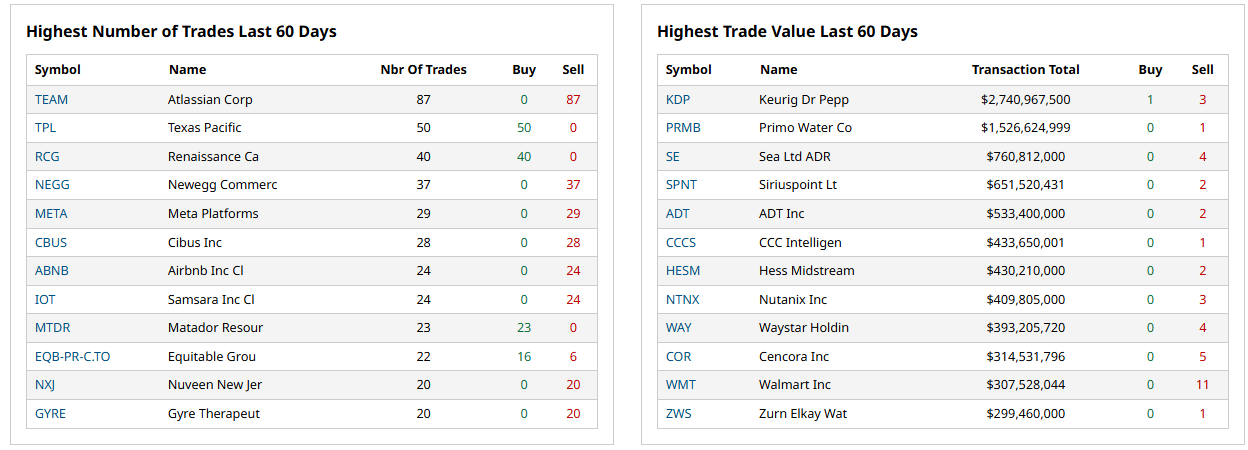
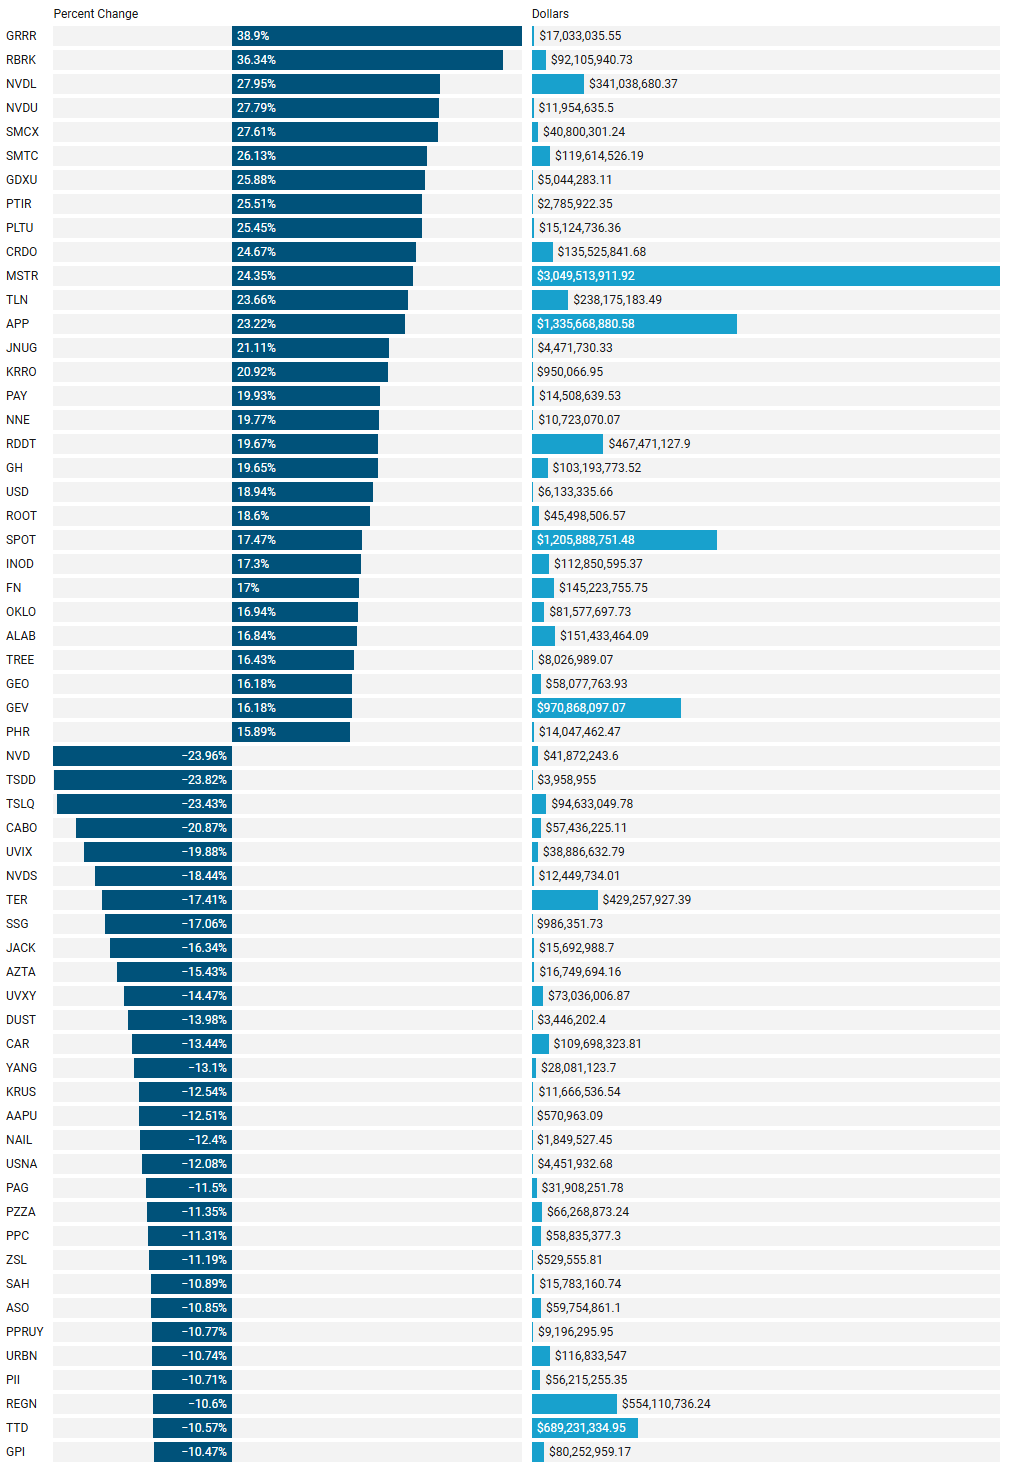
Last Week’s Institutionally-Backed Gainers & Losers
If you’re going to bet on a name, consider one that is officially endorsed by an institution! These are the top percent gainers (green) and percent losers (red) from this week’s open-to-close that had a trade price greater than $20 and institutional involvement. Continue watching tickers from this and prior stacks as these names frequently turn into multi-leg trades with a lot of movement!
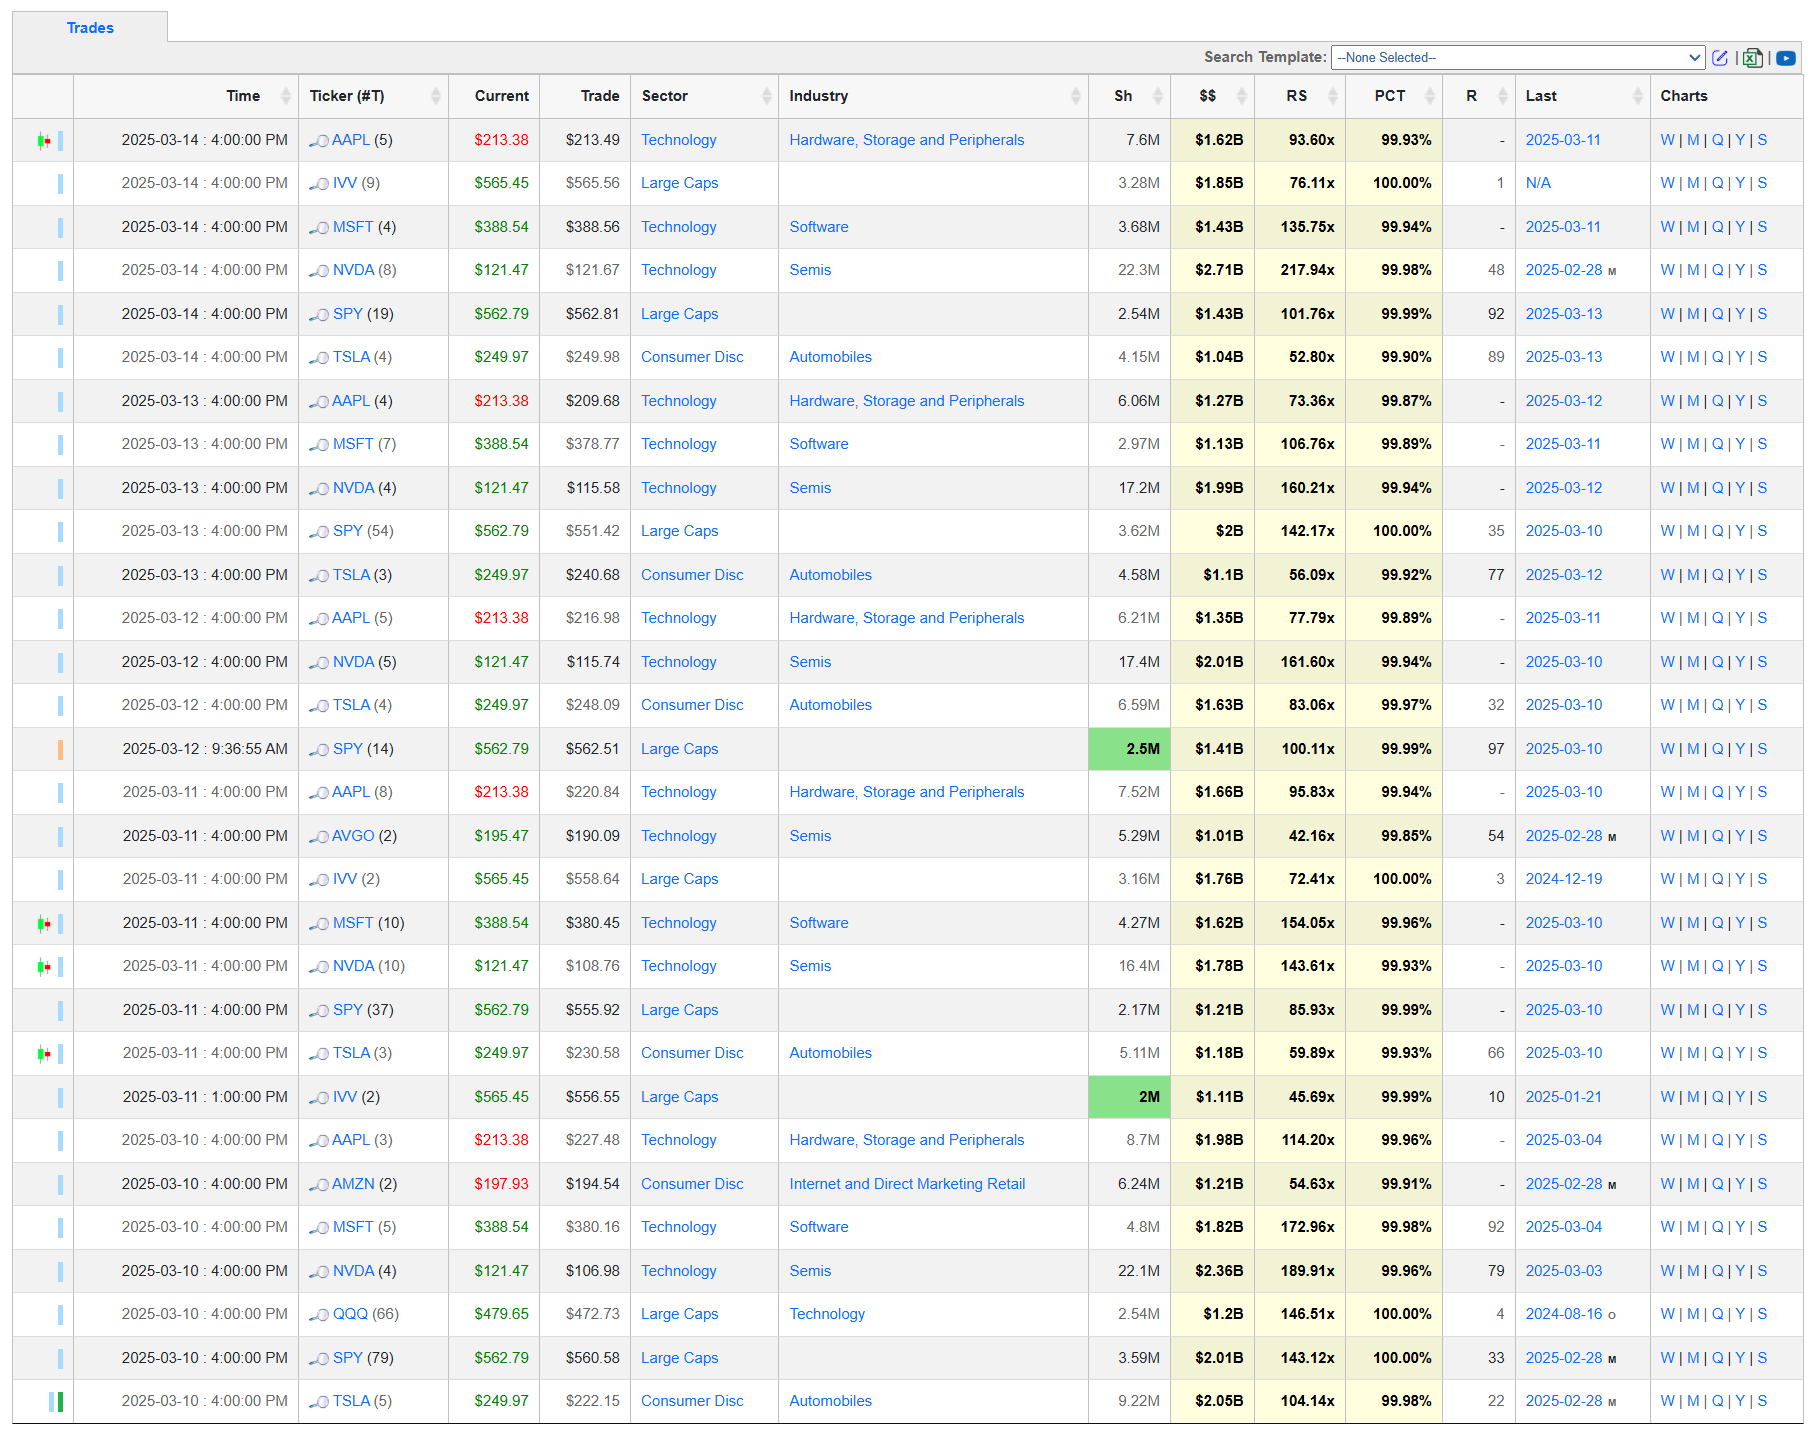
Last Week’s Billion-Dollar Prints
Tickers that printed a trade worth at least $1B last week get a special shout-out. These are massive commitments by institutions that should not be ignored.
Moneyflow Charts
Our unique Moneyflow charts work much like volume profile charts but we segment activity by trading week to provide valuable institutional participation information as a function of time and we normalize all plots to dollars - the one yardstick that consistently describes institutional involvement across all instruments. By examining how money flows across price levels over consecutive weeks, traders can identify important market structure developments and develop stunningly accurate plans for future price behavior.
Week-to-week analysis reveals how trading activity migrates across different price zones, showing the price development process and momentum changes. Large shifts between consecutive weeks often signal changing market sentiment, particularly when activity concentrates in new areas or distributes across large ranges.
For price predictions, large moneyflow nodes act as magnets for future price action, likely serving as support or resistance zones. They can also be quite choppy since institutions are frequently campaigning in these areas - accumulating or distributing within a range. Conversely, low activity areas between these nodes signal prices with little interest and often become zones where price is either rapidly rejected or price through moves quickly with little resistance. Price levels with consistent participation across multiple weeks indicate acceptance/fair-value, while single-week volume spikes that aren't revisited may signal rejection. The highest volume price level (Point of Control) frequently acts as a gravitational center for price to return to.
Key areas of interest for traders include shelves/clusters which represent potential support/resistance zones where institutional decisions to hold price were made; voids between nodes that serve as potential acceleration zones and are candidates for “filling” in future weeks; profile edges where volume tapers off, acting as significant barriers and area of no interest; dramatic week-to-week transitions indicating important market structure shifts; and the most recent week's moneyflow concentration showing where current control lies.
This analysis helps identify levels where institutional players have established positions, providing insight into potential support/resistance zones and areas where price might accelerate or reverse based on historical trading interest.
Note: Each color in the charts represents a week of institutional activity; Week 10 is the most recent trading week.
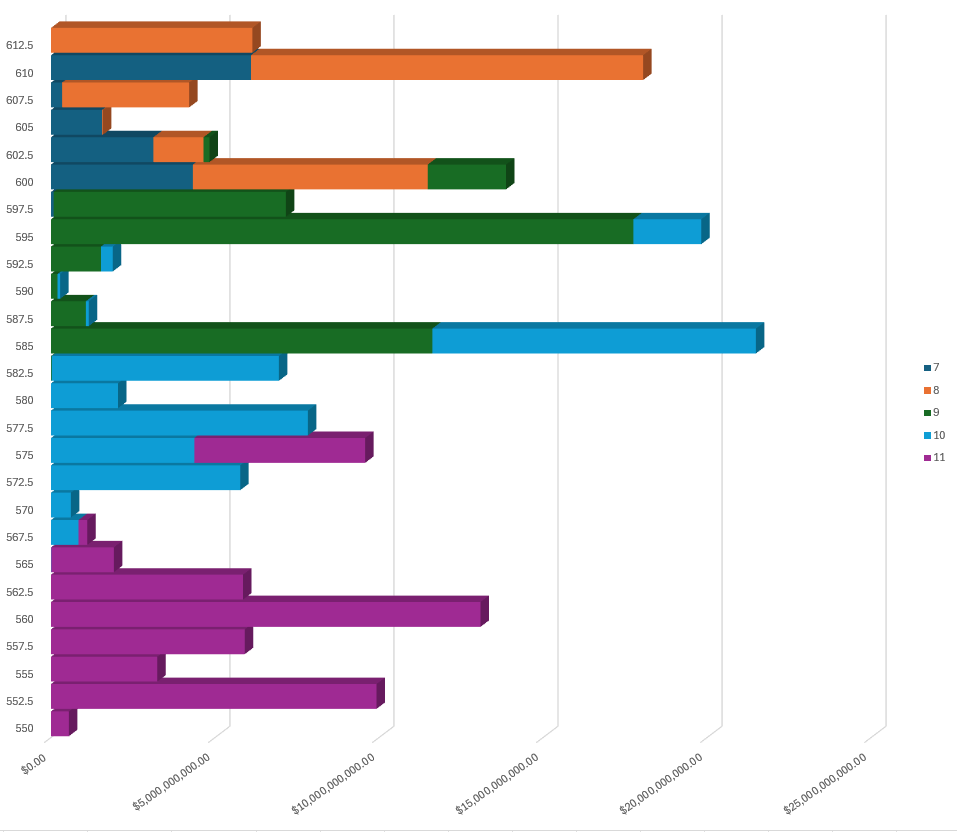
We’ve got 3 very clear auctions , divided neatly by LVNs, roughly 20 pts in range each. The largest purple bars (week 11) in the mid/upper 550s through about 565 indicate that a lot of business was done here. This region can probably offer short-term support if price pulls back. However, under 555 things get dicey in the profile and under 550 makes 530 a likelihood. In the absence of something exogenous, this seems less likely as it would greatly extend sellers who haven’t paused to reload on a pullback which is what we tend to see on deeper, extended declines. Anything is possible but VIX did release significantly into the week’s close as did SKEW. This doesn’t mean bulls have an easy road ahead of them. A notable cluster appears around 585 (the thick teal/green overlap; weeks 9 and 10) and this could be a highly resistive area if we trade into it from below.
In short, this volume profile shows acceptance of this week’s prices, making it a logical support shelf while we’re over 560. There is another big volume ceiling around 585 and then at 595, both making long-targets look difficult to attain. Watch how price behaves when it enters LVNs in this profile…price should reject immediately or price will glide through effortlessly and will offer clues about near‐term breakout or breakdown potential.
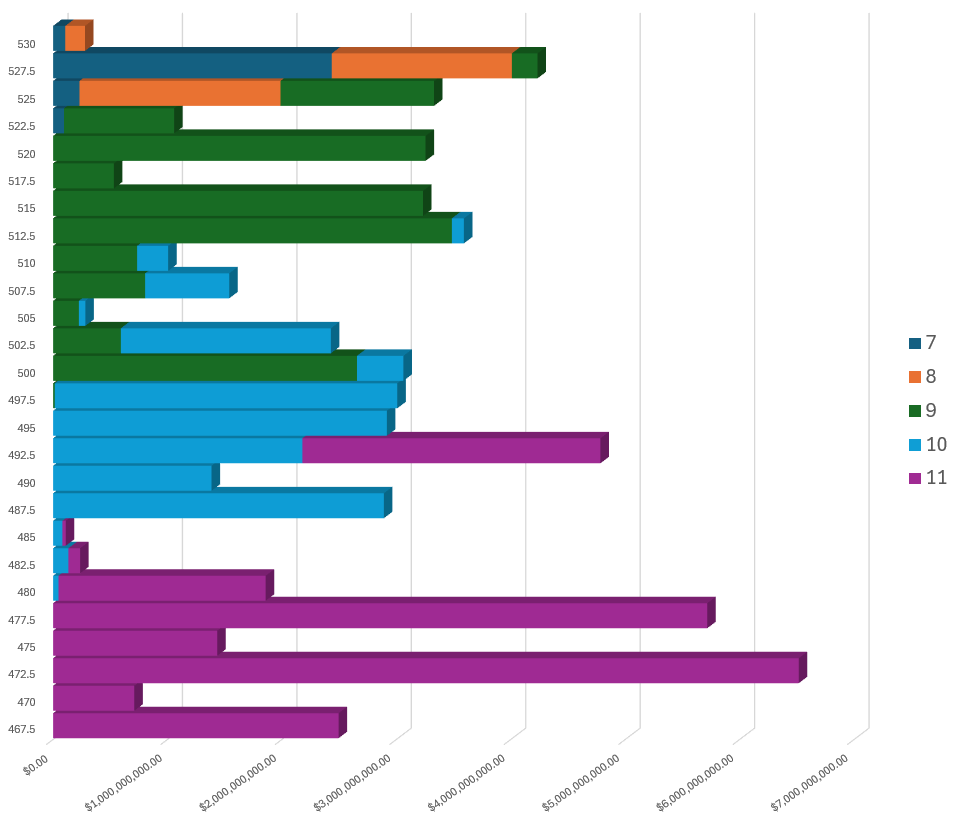
QQQ currently sits on upper side of a high‐volume node created by week 11 activity and is currently presenting as demand. The volume bars between about 482 and 485 are thinner compared to the zones below and above creating an LVN where we should carefully observe for any seller responsiveness. Price rarely loiters in these LVNs; expect a sudden rejection at these prices or a swift move through. Price over 485 invites the possibility of revisiting 505 but only after overcoming a highly resistive obstacle at 492.5. Sellers want to see an immediate rejection of that same overhead LVN and drive price below 470 and invite 450.
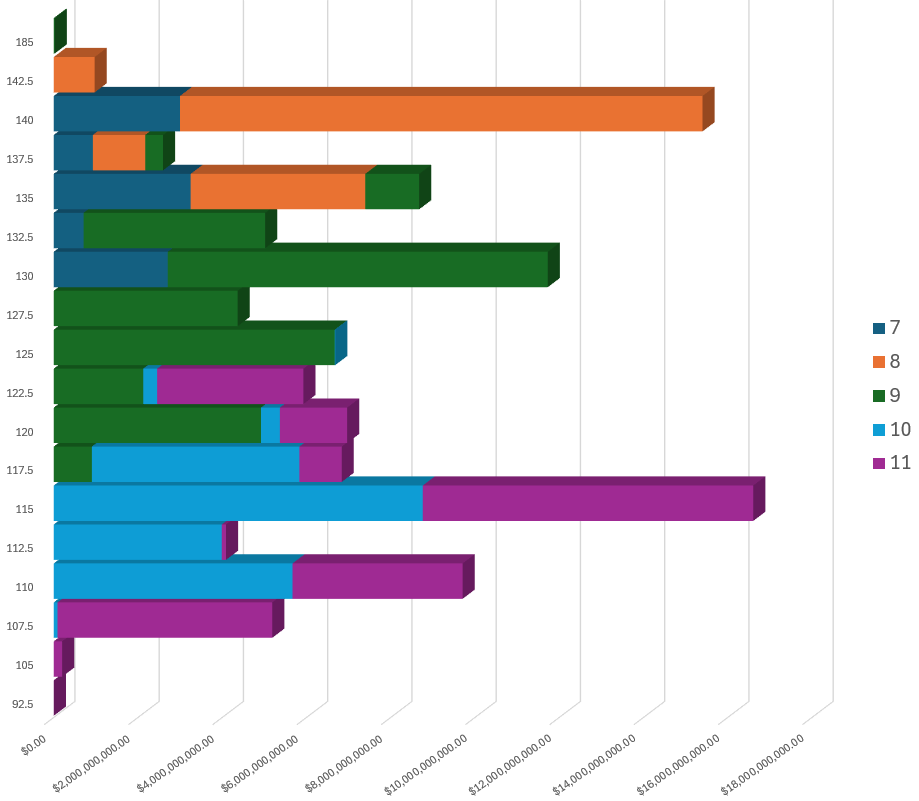
3 weeks of development on the lower portion of this profile and we have something that looks rather balanced with price lifting back to nearly the mid. 115 is currently presenting as demand and likely to be supportive on retests though under 112 becomes problematic for bulls. Price appears poised to test into 127.5 with a immediate uphill battle on the other side. If sellers are going to reload, 130 might be the best place. All things looking as they do now, I would not be surprised to see rips or dips fizzle and mean-revert to the middle.
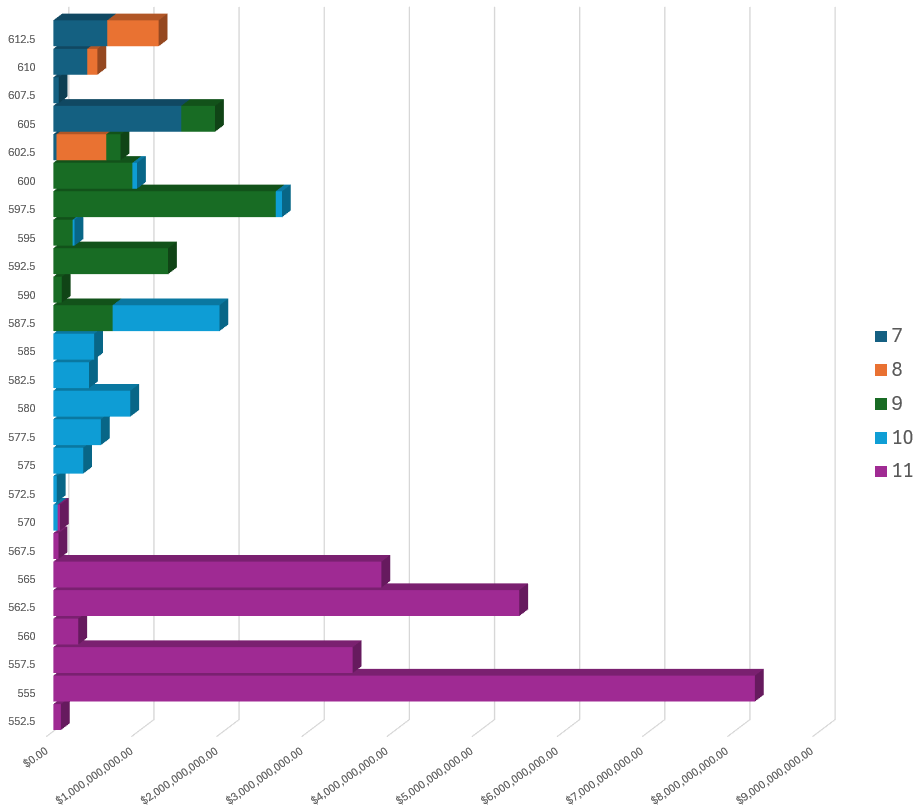
It was mentioned in the Discord that more business was done in this name at the lows than at the highs week 11’s range and it shows in the moneyflow chart. Also, we have a very significant amount of participation relative to recent weeks. Week 11 features a LVN right in the middle of this week’s range at 560 that creates what’s known as a double-distribution profile. This occurs when the market forms two distinct acceptance areas (each with relatively high volume) and a low‐volume trough in between them. Structurally, I view these as a weaker profile and it could very well mean we aren’t done with this area. However, as things look right now, price is poised favorably at the top of week 11’s range. If we start looking at prices over ~567, we could move swiftly through that low volume area between 567.5 and 575 and start testing prior seller holdouts at 580 and 587.5
Investments In Focus: Bull vs Bear Arguments
Institutions leave footprints that VolumeLeaders.com can illustrate for you while providing context to assess things like institutional conviction and urgency. Theses and data given below are not financial advice, just personal observations that may be wrong; consult a certified financial advisor before making any investment decisions.
K 0.00%↑
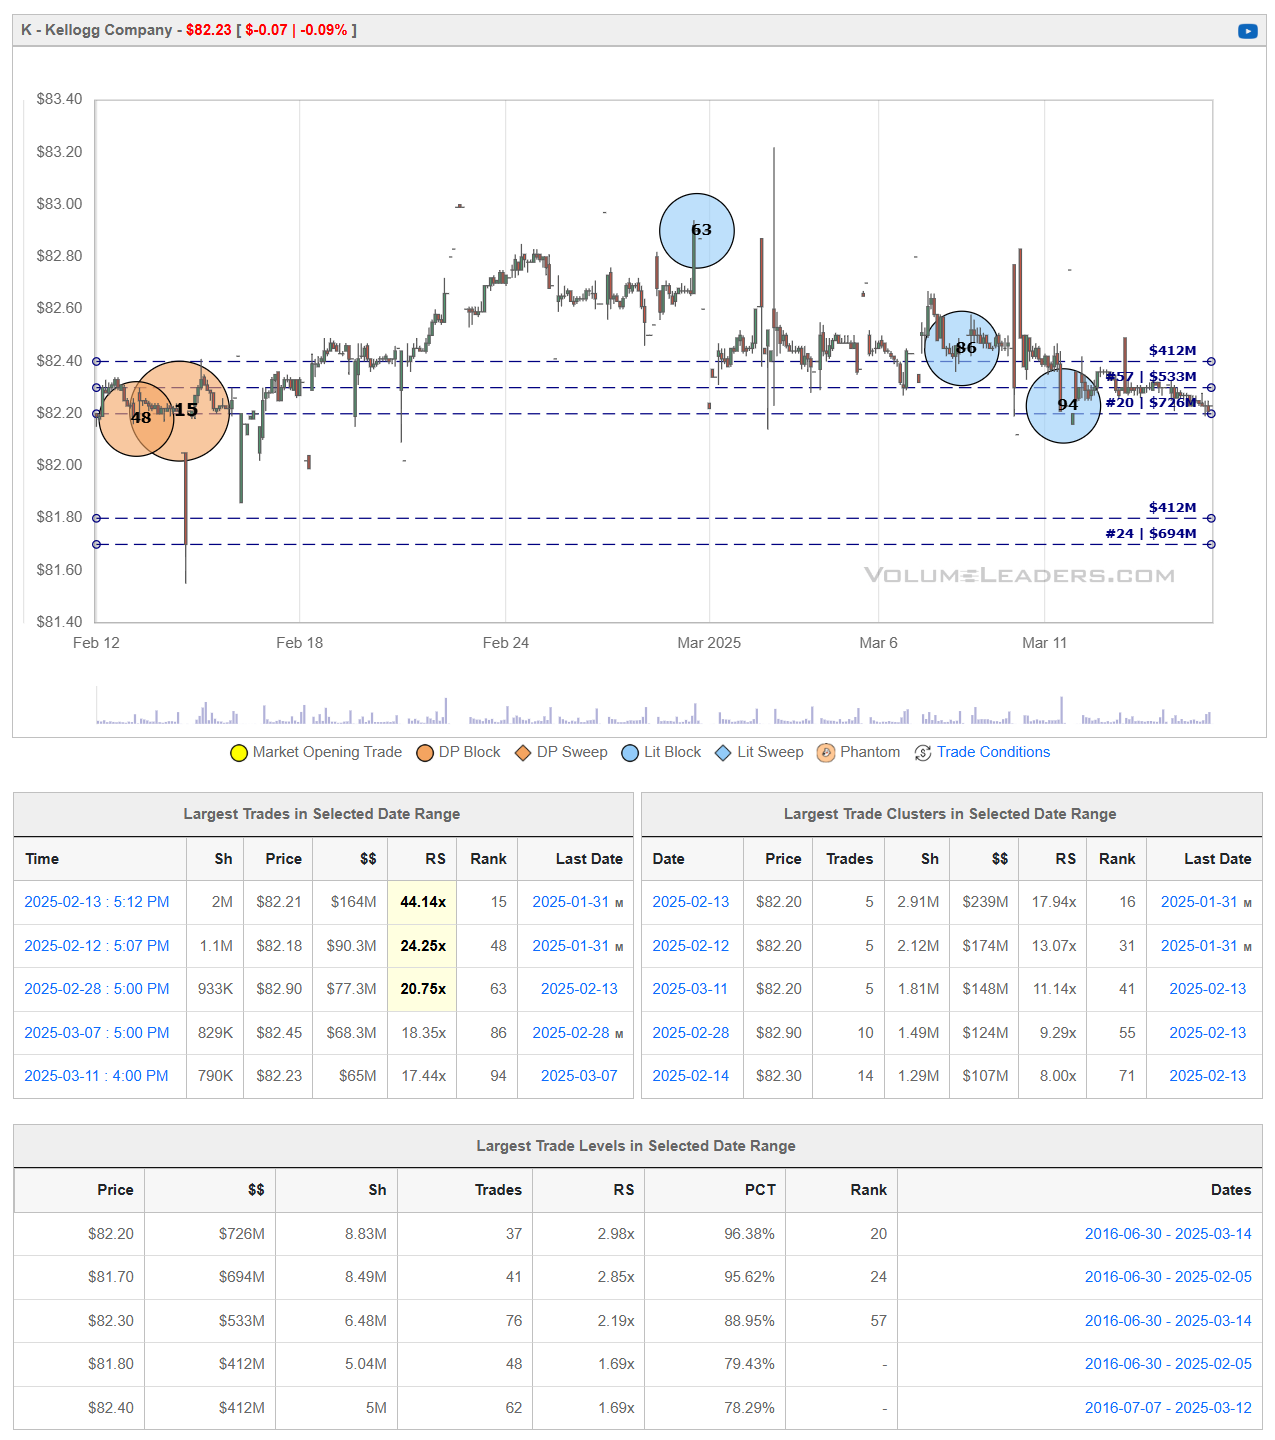
Kellanova (NYSE: K) is a global food company specializing in snacks, cereals, and plant-based foods. In October 2023, the company underwent a significant transformation by spinning off its North American cereal business into a separate entity, WK Kellogg Co (NYSE: KLG), allowing each company to focus on their respective markets and growth strategies.
Recent Developments:
Financial Performance: Kellanova has demonstrated strong financial performance, with its stock delivering an impressive 60% return over the past year, trading near its 52-week high of $83.22.
Insider Transactions: The W.K. Kellogg Foundation Trust, a significant shareholder, recently sold 114,583 shares of Kellanova's common stock at an average price of $82.2554 per share, totaling approximately $9.43 million. This sale was conducted under a 10b5-1 trading plan established on May 7, 2024.
Strategic Initiatives: To address declining U.S. cereal sales, Kellanova is introducing innovative products, such as donut-hole-shaped cereals with flavors from its existing brands like Apple Jacks and Frosted Flakes, aiming to revitalize its cereal segment.
Bullish Perspective:
Strong Market Position: Kellanova's impressive stock performance, with a 60% return over the past year, indicates robust market confidence and effective business strategies.
Product Innovation: The company's proactive approach to product development, such as introducing new cereal formats, demonstrates adaptability to changing consumer preferences and a commitment to rejuvenating its product lines.
Focused Business Strategy: The strategic spin-off of WK Kellogg Co allows Kellanova to concentrate on its core strengths in the global snacks and plant-based foods markets, potentially leading to more targeted growth and operational efficiencies.
Bearish Perspective:
Market Challenges: The broader food industry is experiencing headwinds, with major companies facing declining stock values despite a rising U.S. stock market. Factors such as inflation, changing consumer preferences, and competition from fast-food chains expanding their breakfast offerings pose challenges to traditional cereal products.
Consumer Trends: There is a noticeable decline in breakfast cereal consumption in the U.S., particularly among millennials who prefer alternatives like smoothies and avocado toast. This shift necessitates continuous innovation and marketing efforts to maintain market share.
Insider Selling: The recent sale of shares by the W.K. Kellogg Foundation Trust, while conducted under a pre-established trading plan, might raise concerns among investors regarding insider confidence in the company's future performance.
In summary, Kellanova exhibits a strong market presence and commitment to innovation, positioning itself well in the evolving food industry. However, challenges such as shifting consumer preferences, industry-wide pressures, and insider trading activities warrant careful consideration by investors.
LRCX 0.00%↑
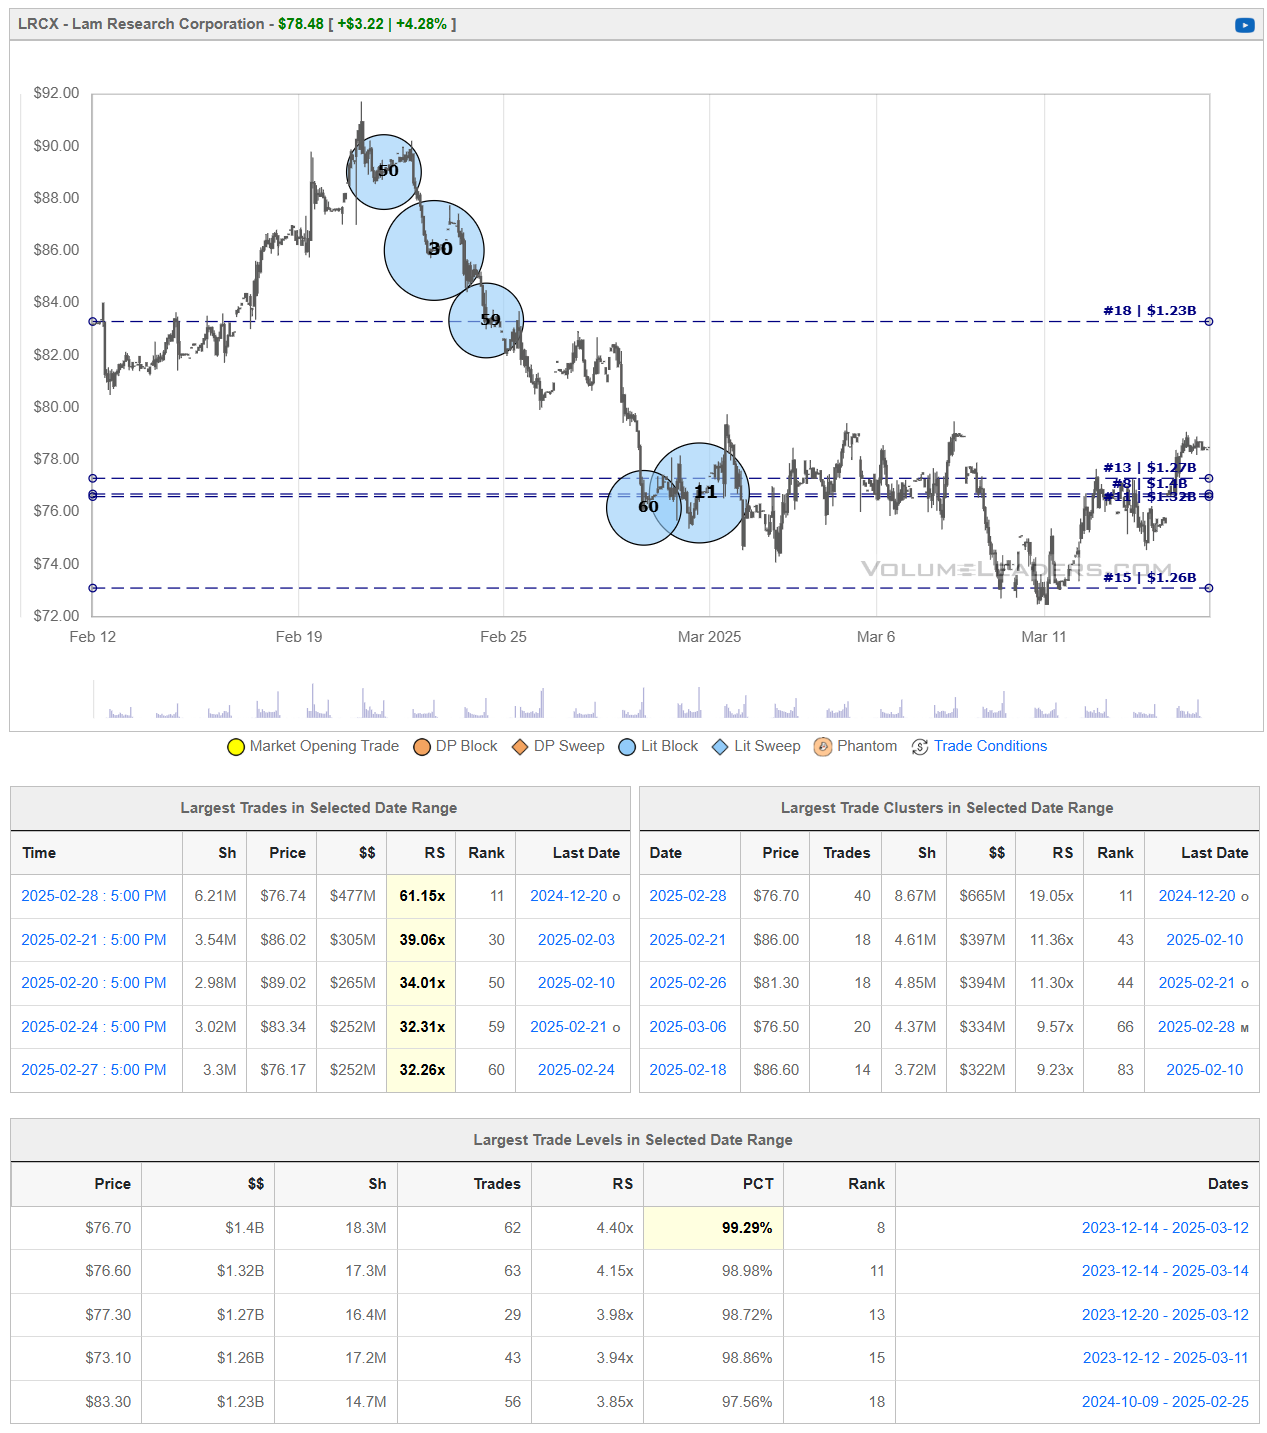
Lam Research Corporation (NASDAQ: LRCX) is a leading supplier of wafer fabrication equipment and services to the semiconductor industry, specializing in etch, deposition, and cleaning solutions. The company's technologies are integral to the manufacturing of virtually every advanced chip, enabling the scaling and performance improvements that drive the digital age.
Recent Developments:
Financial Performance: In the quarter ending December 29, 2024, Lam Research reported revenue of $4.38 billion, a 5% increase from the previous quarter. The U.S. GAAP gross margin stood at 47.4%, with an operating income representing 30.5% of revenue. Diluted earnings per share (EPS) were $0.92, marking a 7% sequential increase.
Technological Advancements: The company has made significant strides in high-resolution patterning by establishing a 28nm pitch through its innovative dry photoresist technology. This advancement enhances the precision and efficiency of semiconductor manufacturing processes, positioning Lam Research at the forefront of industry innovation.
Global Expansion: Lam Research announced plans to invest over $1 billion in India's Karnataka state to bolster the semiconductor ecosystem. This strategic move aligns with India's ambitions to become a significant player in the global semiconductor supply chain and reflects Lam's commitment to expanding its global footprint.
Ethical Recognition: The company was honored as one of the World's Most Ethical Companies® in 2025 by Ethisphere, underscoring its dedication to ethical business practices and corporate governance.
Bullish Perspective:
AI-Driven Demand: Lam Research is poised to benefit from the growing demand for artificial intelligence (AI) infrastructure. The proliferation of AI applications necessitates advanced semiconductor technologies, driving the need for Lam's equipment and services.
Technological Leadership: The company's advancements in dry photoresist technology and collaborative robotics, such as the Dextro™ cobot, demonstrate its commitment to innovation. These technologies enhance manufacturing efficiency and yield, providing a competitive edge.
Strong Financials: Consistent revenue growth and robust profit margins reflect Lam's operational excellence and market demand for its products. The company's financial health supports continued investment in research and development, fueling future growth.
Bearish Perspective:
Geopolitical Risks: U.S. export restrictions targeting China's semiconductor industry could impact Lam Research's revenue from the Chinese market. These measures may limit the company's access to a significant customer base, affecting overall sales.
Market Volatility: The semiconductor industry is cyclical, with periods of high demand followed by downturns. Economic fluctuations can lead to reduced capital expenditures by chip manufacturers, potentially decreasing demand for Lam's equipment.
Intense Competition: The semiconductor equipment market is highly competitive, with players like Applied Materials and ASML holding substantial market shares. Continuous innovation is required to maintain and grow Lam's market position.
In summary, Lam Research Corporation's technological innovations and strategic investments position it well to capitalize on emerging trends in the semiconductor industry, particularly the expansion of AI applications. However, investors should remain mindful of geopolitical tensions and industry cyclicality that could pose challenges to sustained growth.
TD 0.00%↑
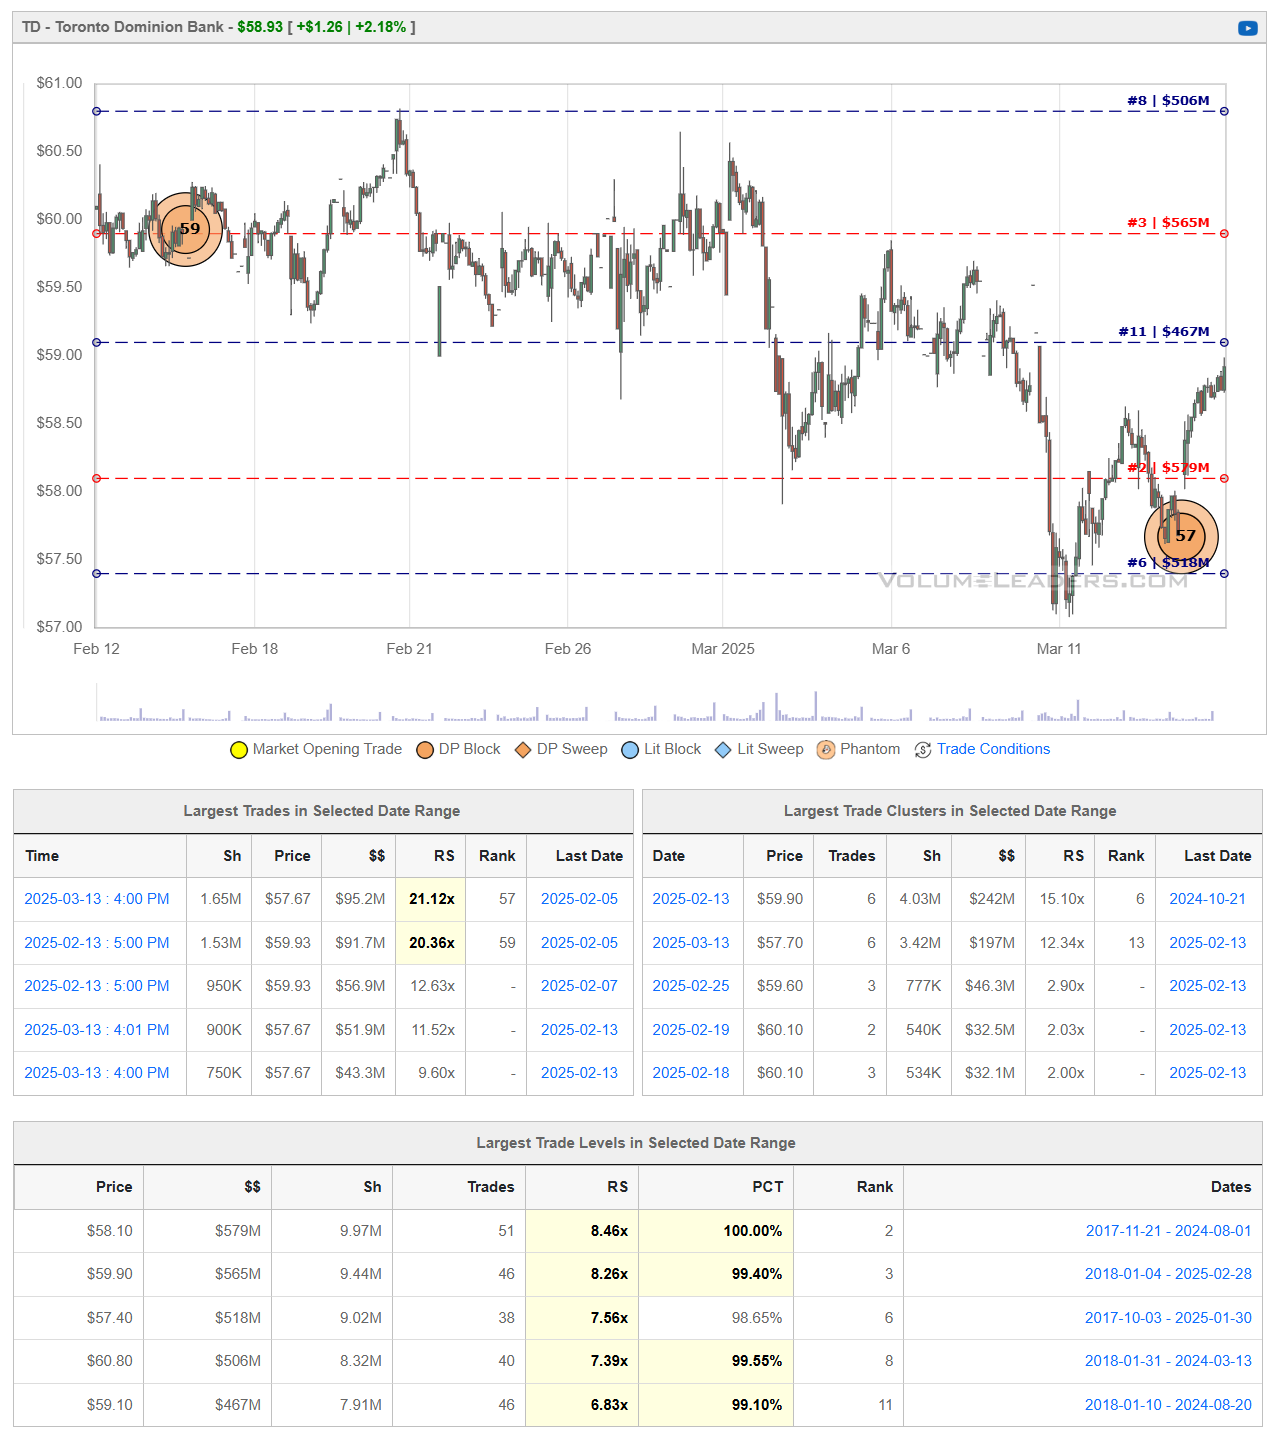
Toronto-Dominion Bank (NYSE: TD), commonly known as TD Bank, is one of Canada's largest financial institutions, offering a wide range of banking products and services across Canada, the United States, and internationally.
Recent Developments:
Executive Leadership Changes: On March 13, 2025, TD Bank announced significant changes in its U.S. Consumer Bank leadership. Allison Robinson was appointed as Head of Retail Distribution, and Andrew Stuart as Head of U.S. Consumer Products, Auto Finance, and Wealth. These appointments are aimed at strengthening the bank's consumer banking operations in the U.S.
Financial Performance: In the first quarter of 2025, TD Bank reported earnings per share (EPS) of CAD 2.02, surpassing analyst expectations of CAD 1.961. This performance was bolstered by strong results in wealth management and capital markets, reflecting the bank's diversified revenue streams.
Regulatory Challenges: TD Bank has faced significant regulatory issues in its U.S. operations. In October 2024, the bank agreed to pay a $3 billion settlement with U.S. authorities over inadequate anti-money laundering controls, marking one of the largest penalties in such cases. This settlement has led to increased scrutiny and operational adjustments within the bank's U.S. division.
Strategic Divestment: In February 2025, TD Bank announced plans to divest its 10.1% stake in Charles Schwab, valued at approximately $15.4 billion. This strategic decision aims to reallocate capital towards core banking operations and enhance shareholder value.
Bullish Perspective:
Strong Financial Performance: TD Bank's ability to exceed earnings expectations demonstrates its robust business model and effective management. The bank's diversified revenue streams, particularly in wealth management and capital markets, provide resilience against economic fluctuations.
Strategic Capital Allocation: The planned divestment of the Charles Schwab stake indicates a focus on core banking operations and a commitment to optimizing capital allocation. This move is expected to enhance shareholder value and support future growth initiatives.
Leadership Enhancements: The recent executive appointments in the U.S. Consumer Bank division reflect TD's commitment to strengthening its leadership team, which could lead to improved operational efficiency and customer satisfaction in the competitive U.S. market.
Bearish Perspective:
Regulatory and Compliance Risks: The substantial penalties related to anti-money laundering lapses highlight significant compliance shortcomings. Ongoing regulatory scrutiny may lead to increased operational costs and could impact the bank's reputation.
Market Volatility: The financial sector is susceptible to economic downturns and market fluctuations. TD Bank's exposure to both Canadian and U.S. markets means it must navigate varying economic conditions, which could affect profitability.
Operational Challenges in the U.S.: The bank's U.S. operations have faced challenges, including regulatory fines and leadership changes. Ensuring effective risk management and compliance in this region remains a critical concern.
In summary, Toronto-Dominion Bank showcases strong financial performance and strategic initiatives aimed at focusing on core operations and enhancing leadership. However, investors should remain cautious of regulatory challenges and market volatility that could impact the bank's future performance.
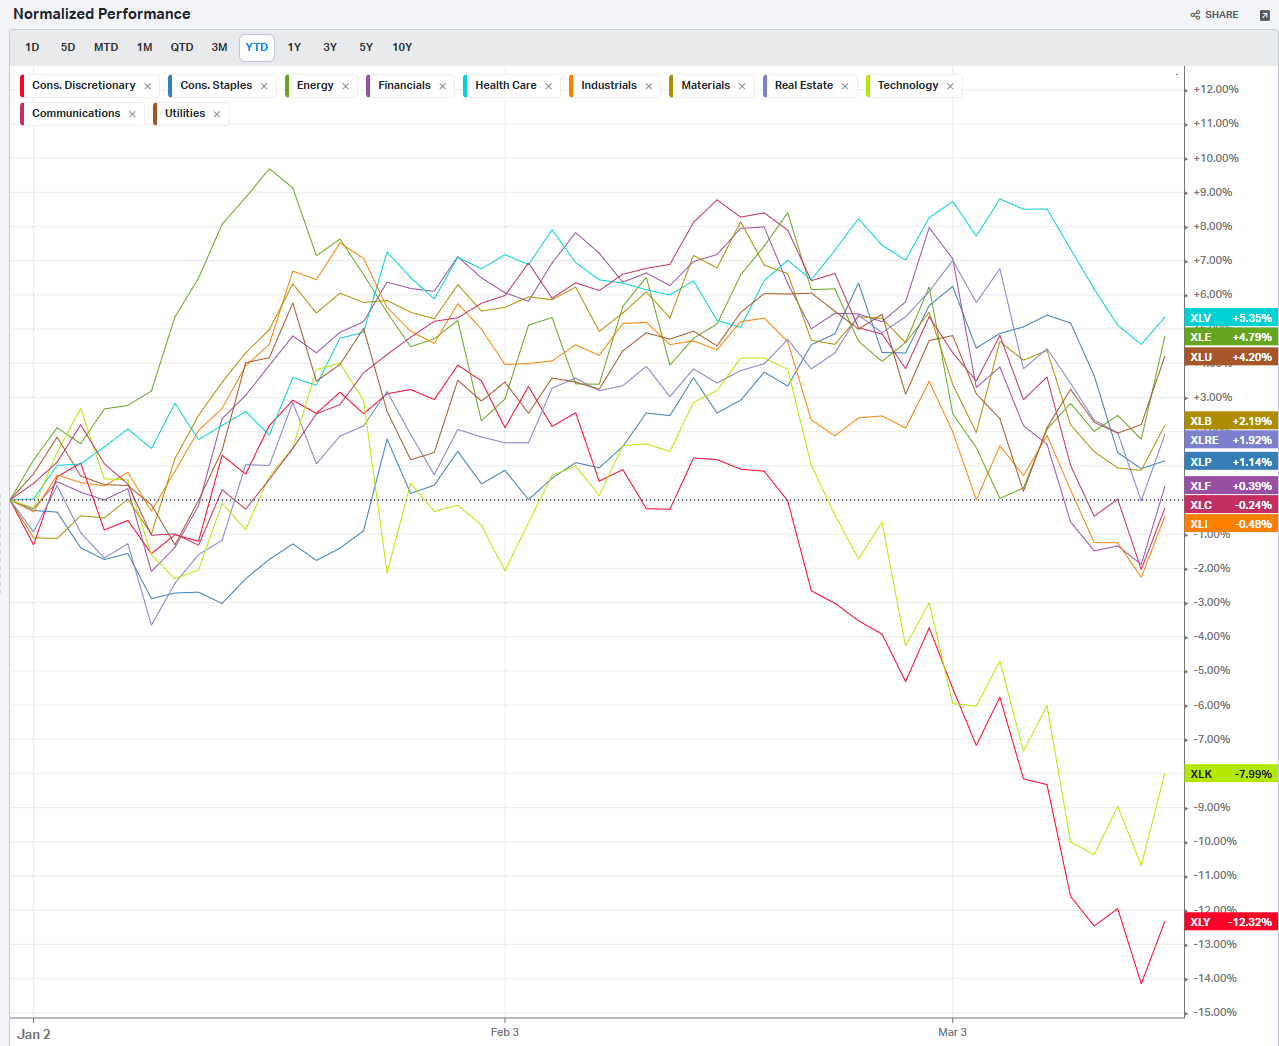
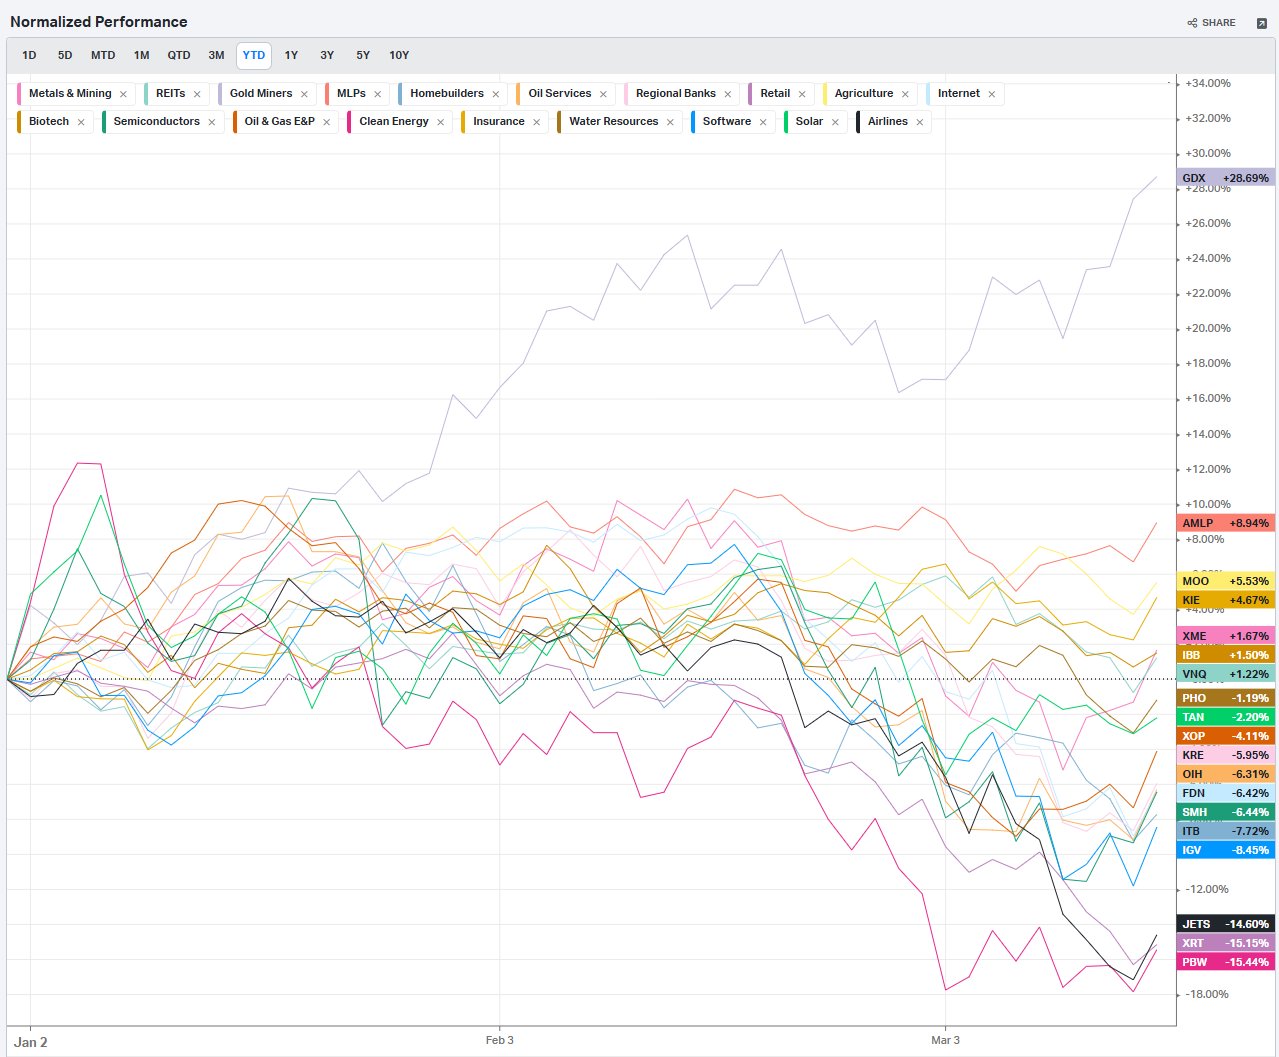
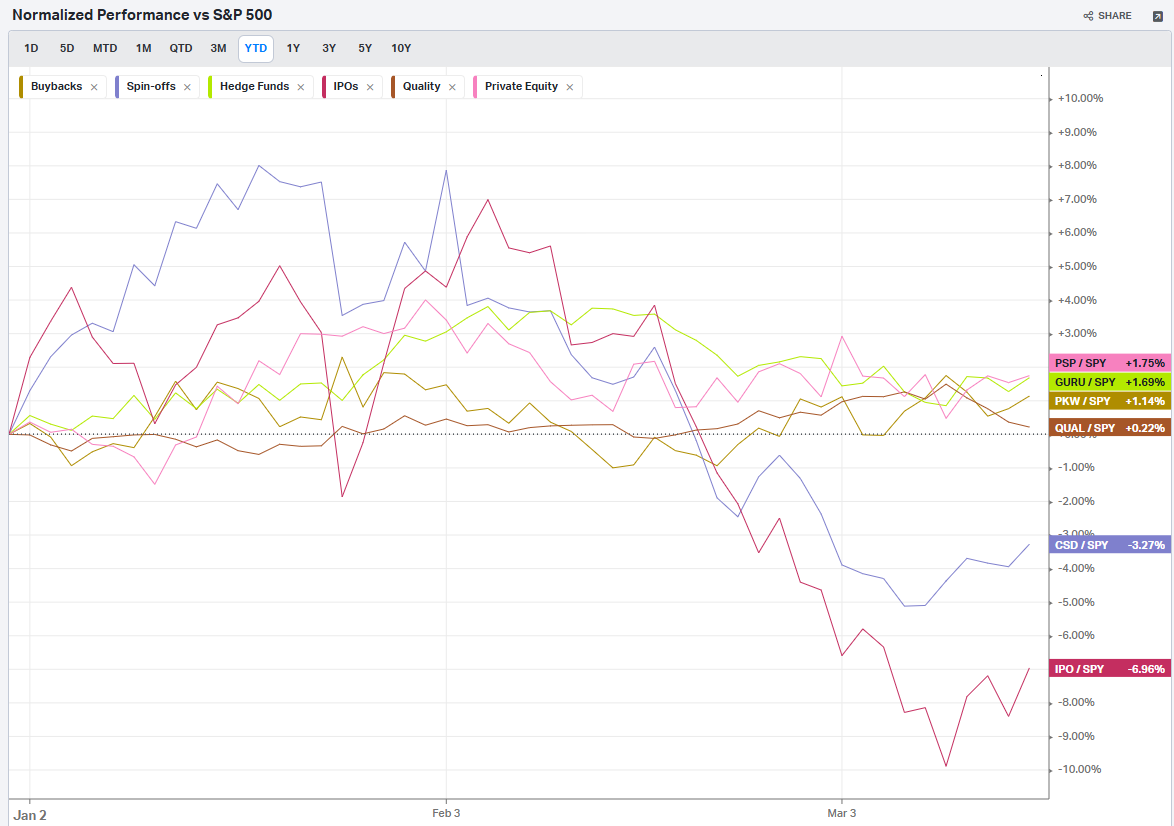
Summary Of Thematic Performance YTD
VolumeLeaders.com provides a lot of pre-built filters for thematics so that you can quickly dive into specific areas of the market. These performance overviews are provided here only for inspiration. Consider targeting leaders and/or laggards in the best and worst sectors, for example.
S&P By Sector
S&P By Industry
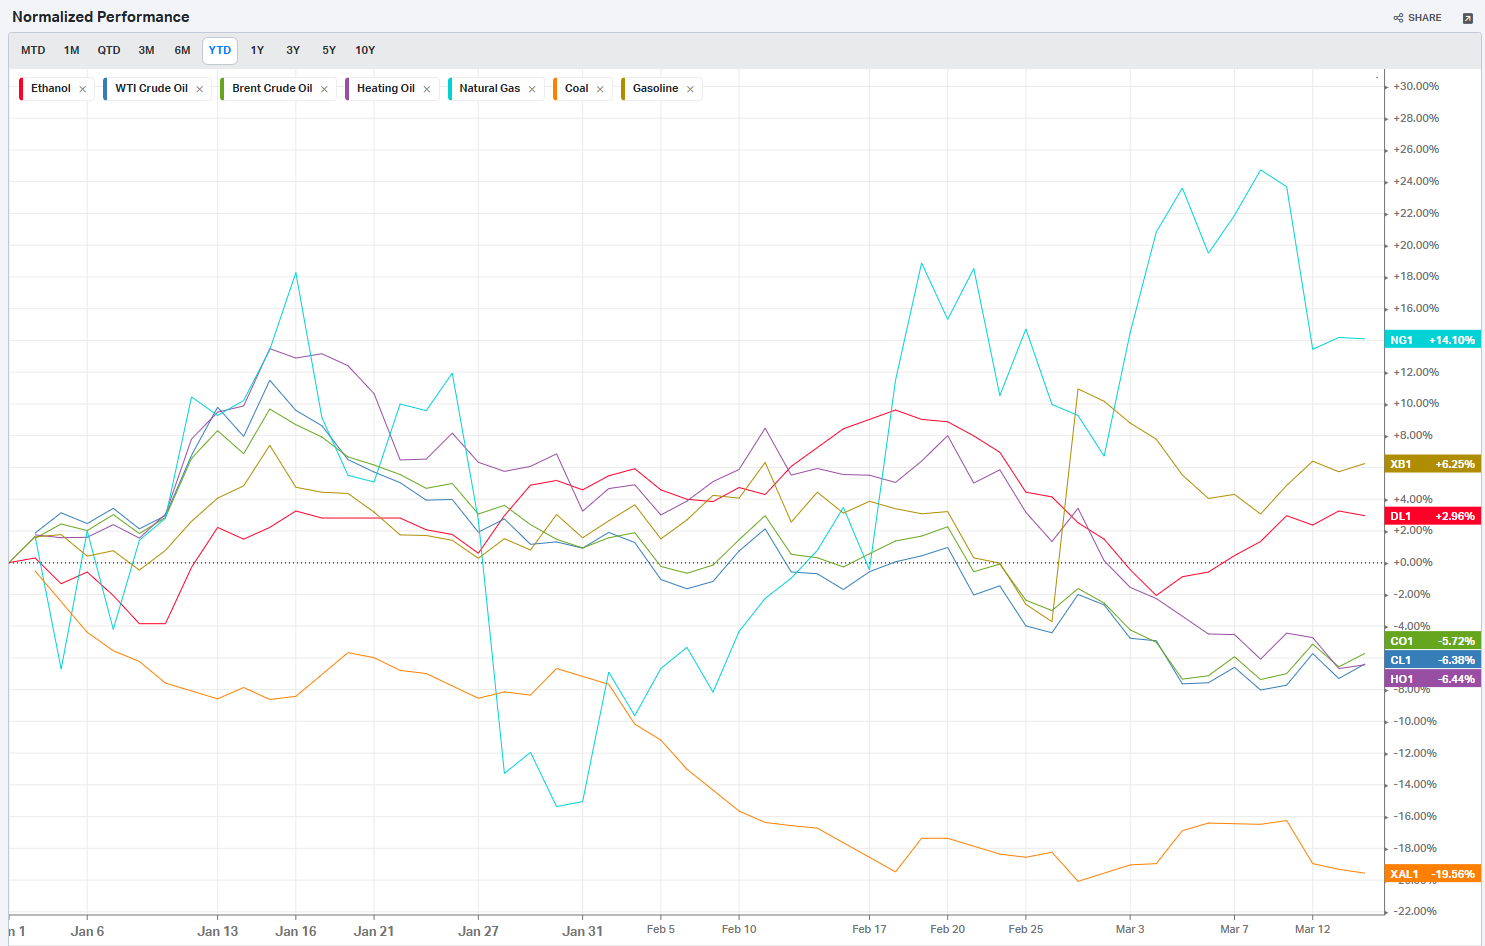
Commodities: Energy
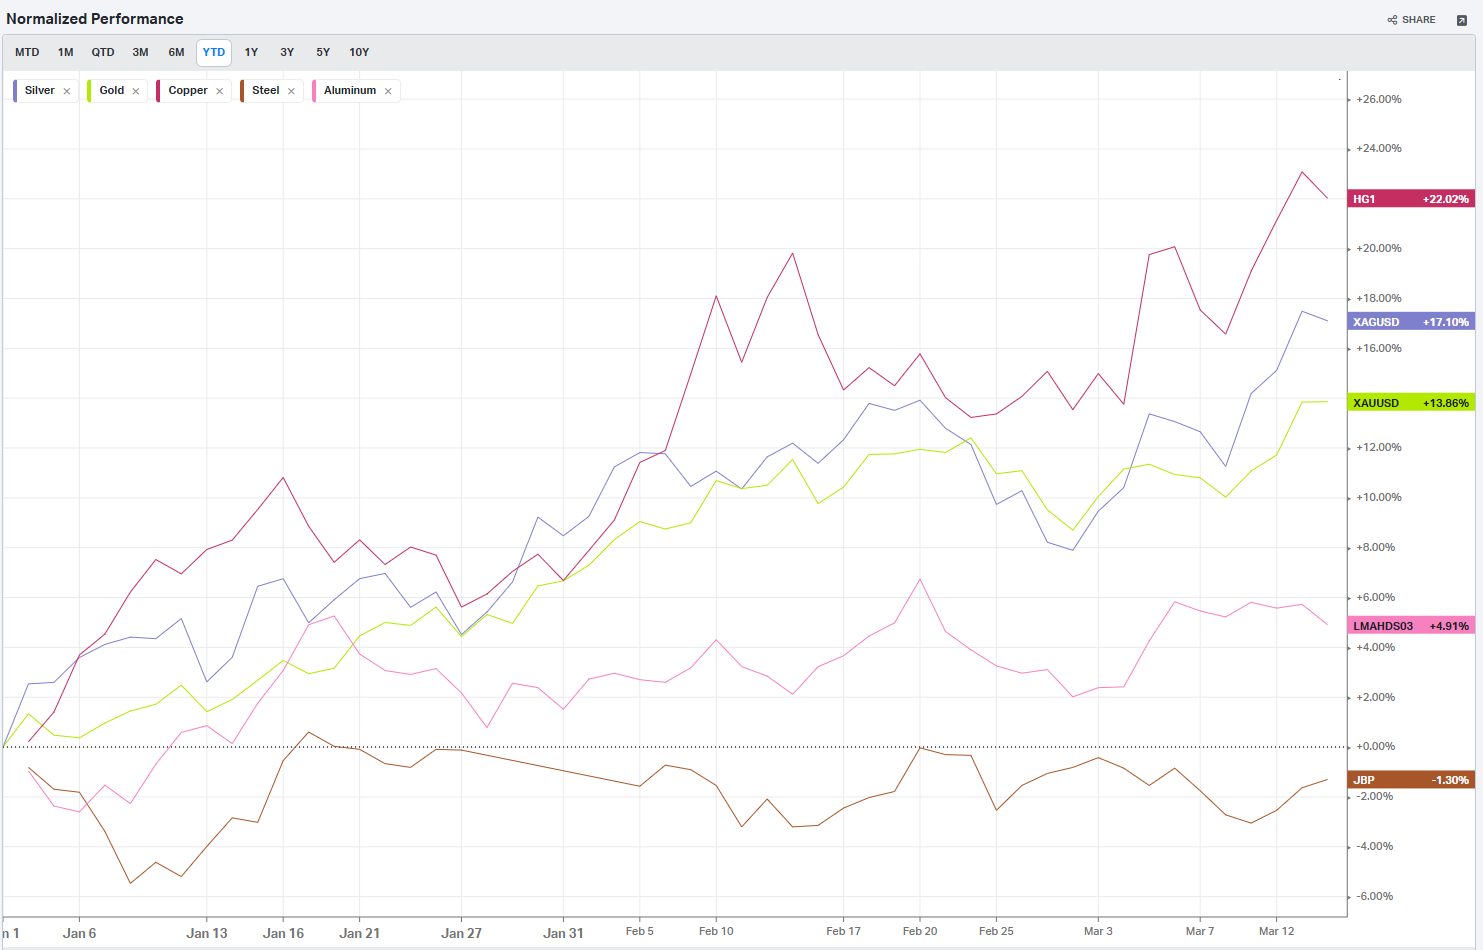
Commodities: Metals
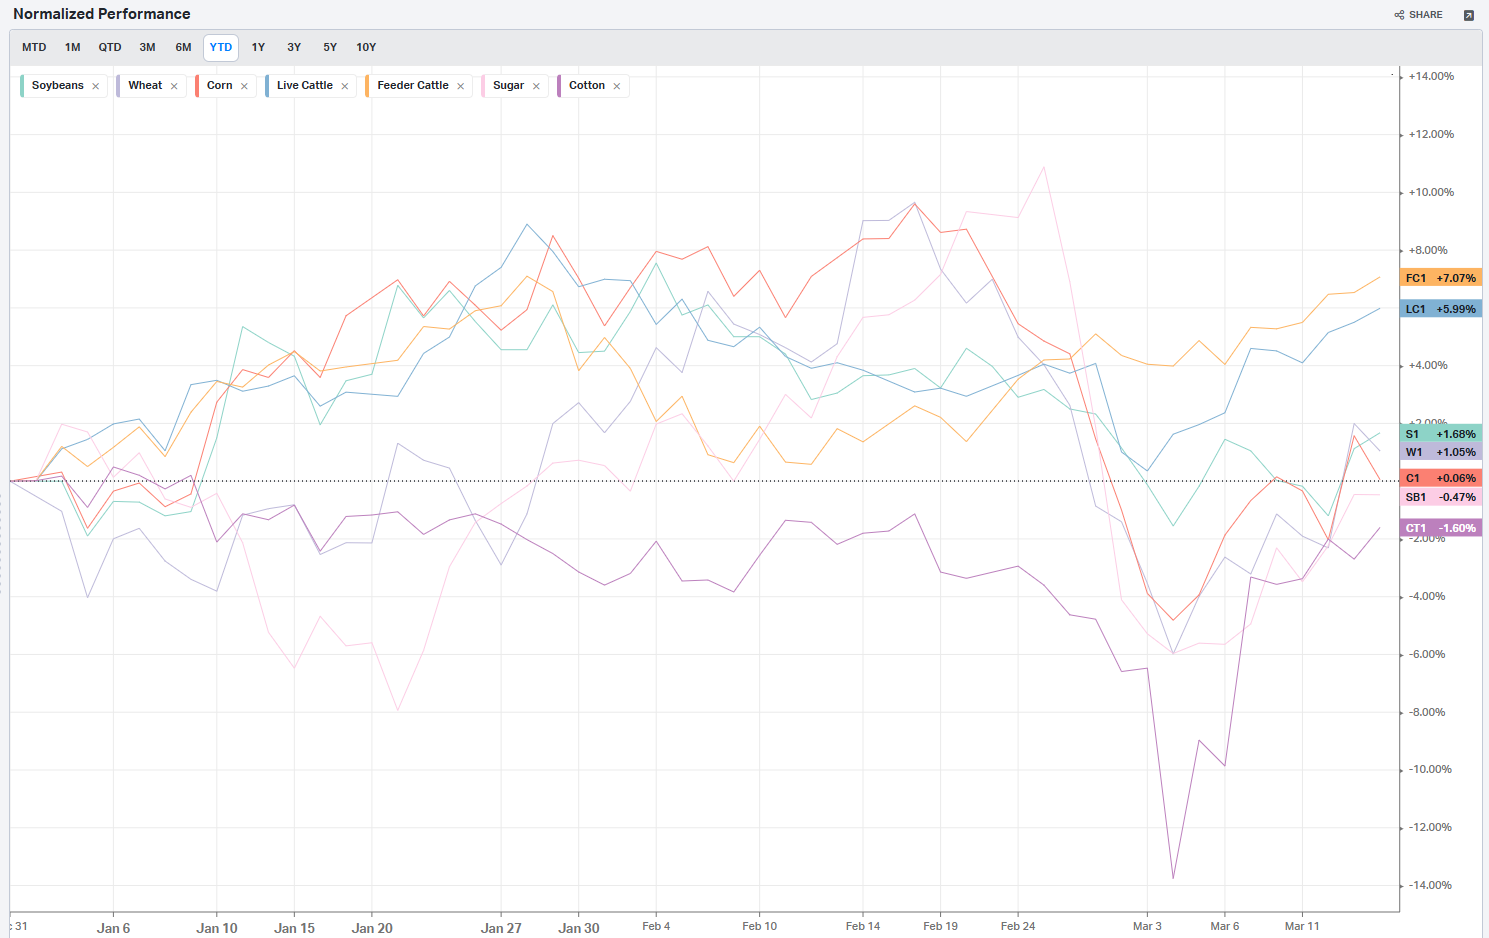
Commodities: Agriculture
Country ETFs
Currencies
Global Yields
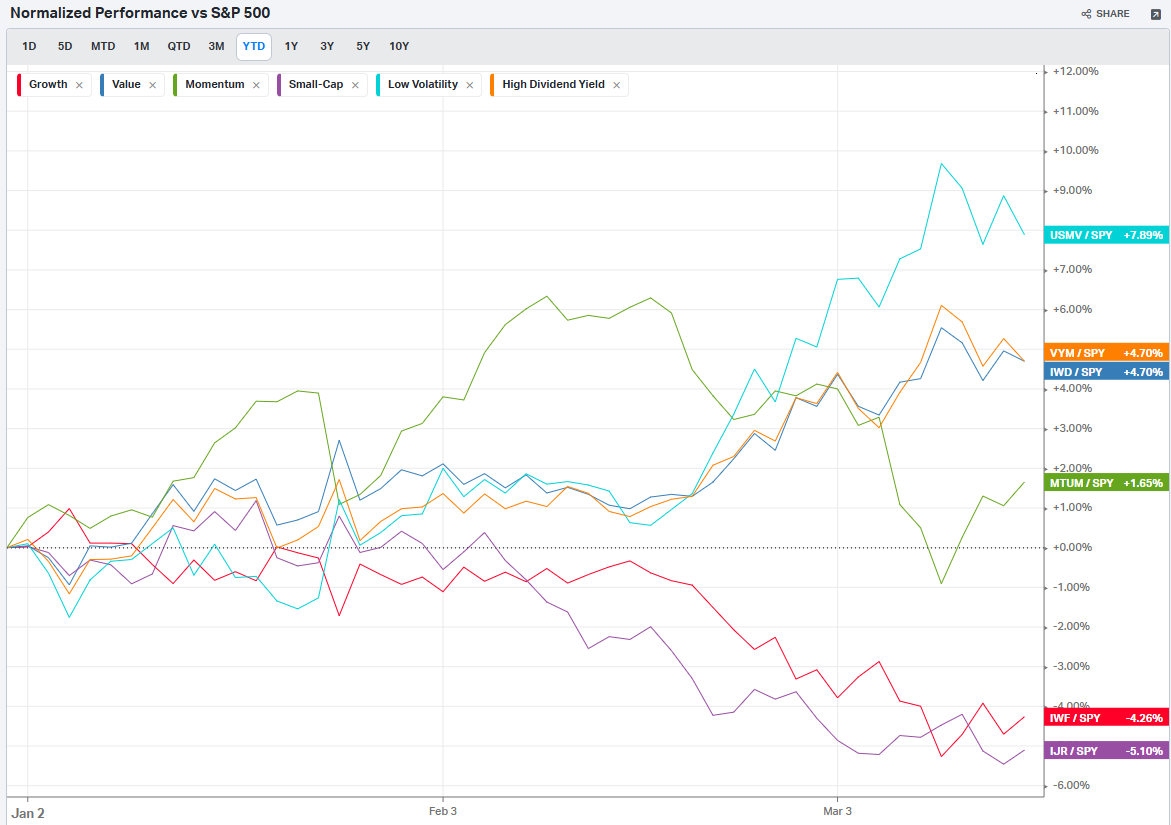
Factors: Style
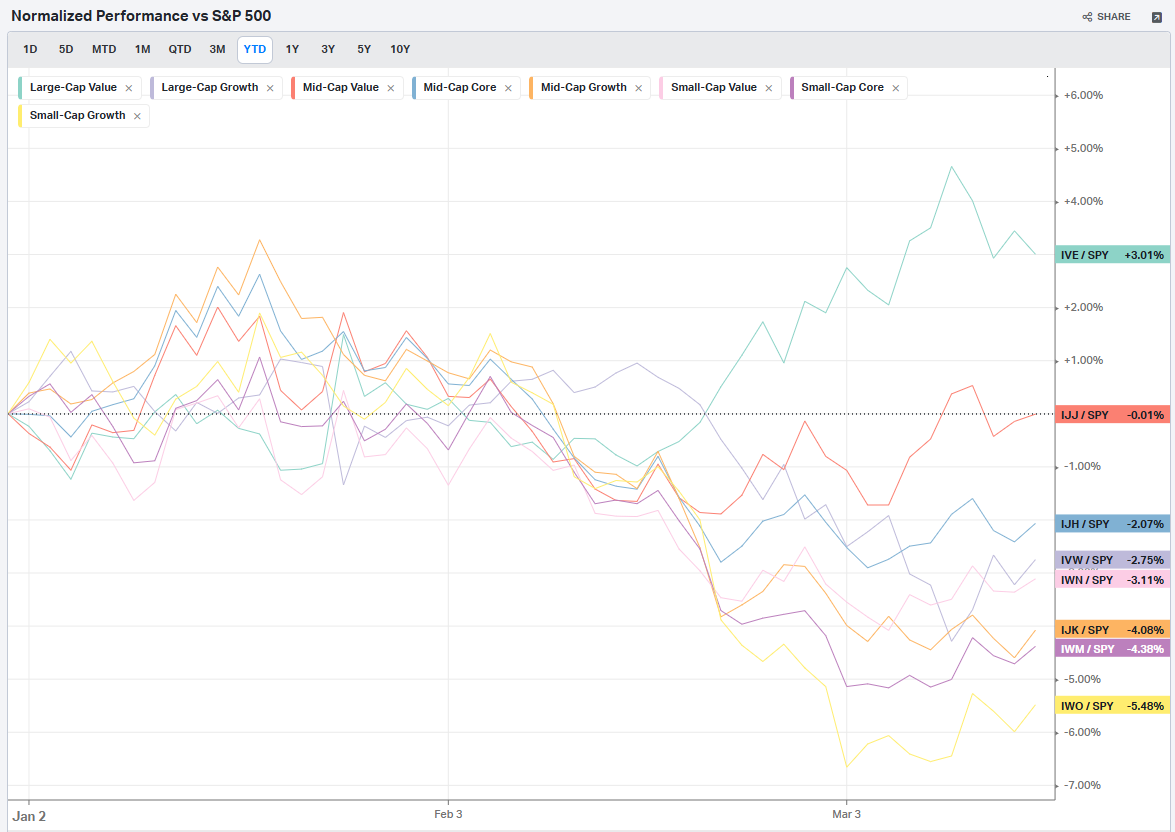
Factors: Size vs Value
Factors: Qualitative
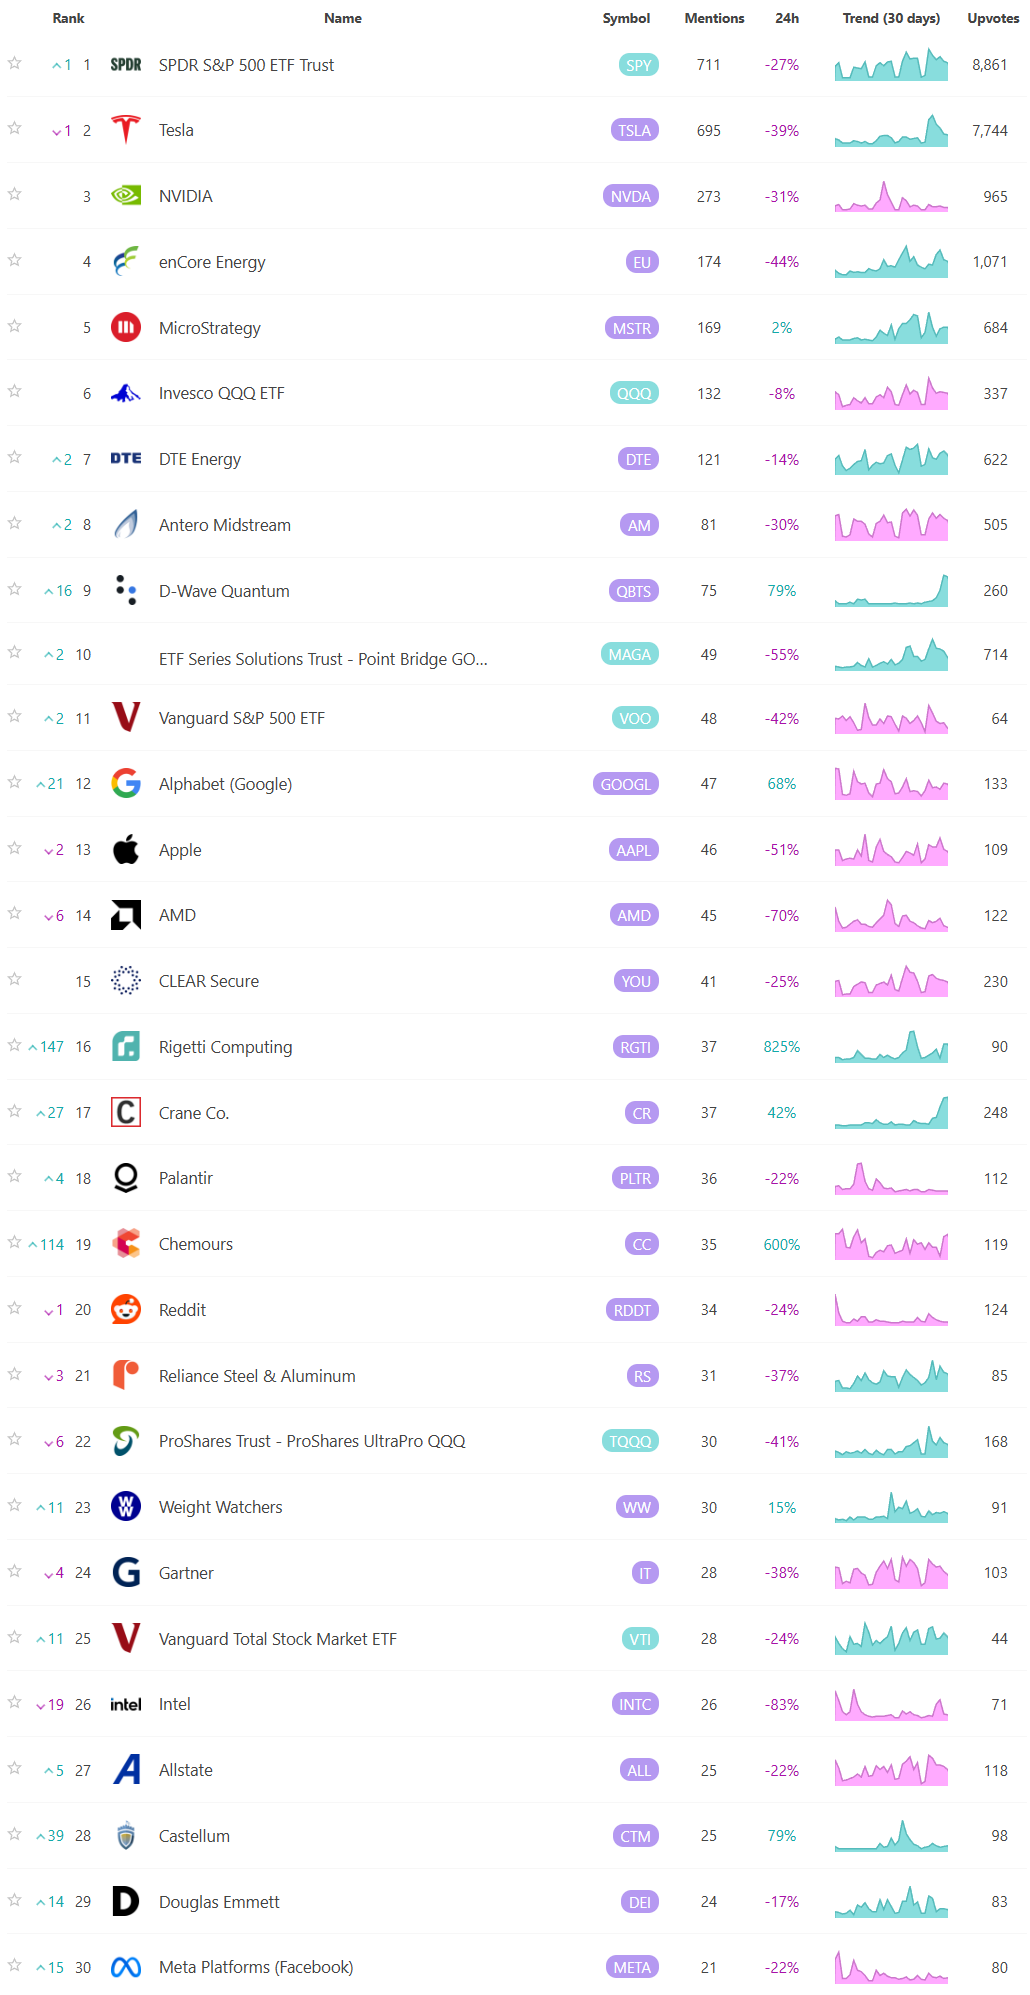
Social Media Favs
Analyzing social sentiment can provide valuable insights for investment strategies by offering a pulse on public perception, mood, and market sentiment that traditional financial indicators might not capture. Here’s how social sentiment analysis can enhance investment decisions:
Market Momentum: Positive or negative social sentiment can signal impending momentum shifts. When public opinion on a stock, sector, or asset class changes sharply, it can create buying or selling pressure, especially if that sentiment becomes widespread.
Early Detection of Trends: Social sentiment data can help investors spot trends before they show up in technical or fundamental data. For example, increased positive chatter around a particular company or sector might indicate growing interest or excitement, which could lead to price appreciation.
Gauge Retail Investor Impact: With the rise of retail investor platforms, collective sentiment on social media can lead to significant price movements (e.g., meme stocks). Understanding how retail investors view certain stocks can help in identifying high-volatility opportunities.
Event Reaction Monitoring: Social sentiment can provide real-time reactions to news events, product releases, or earnings reports. Investors can use this information to gauge market reaction quickly and adjust their strategies accordingly.
Complementing Quantitative Models: By adding a social sentiment layer to quantitative models, investors can enhance predictions. For example, a model that tracks historical price and volume data might perform even better when factoring in sentiment trends as a measure of market psychology.
Risk Management: Negative sentiment spikes can be a signal of potential downturns or increased volatility. By monitoring sentiment, investors might avoid or hedge against investments in companies experiencing a public relations crisis or facing negative perceptions.
Long-Term Sentiment Trends: Sustained sentiment trends, whether positive or negative, often mirror longer-term market cycles. Tracking sentiment trends over time can help identify shifts in investor psychology that could affect longer-term investments or sector rotations.
For these reasons, sentiment analysis, when combined with other tools, can provide a comprehensive view of both immediate market reactions and underlying investor attitudes, helping investors position themselves strategically across various time frames. Here are the most mentioned/discussed tickers on Reddit from some of the most active Subreddits for trading:
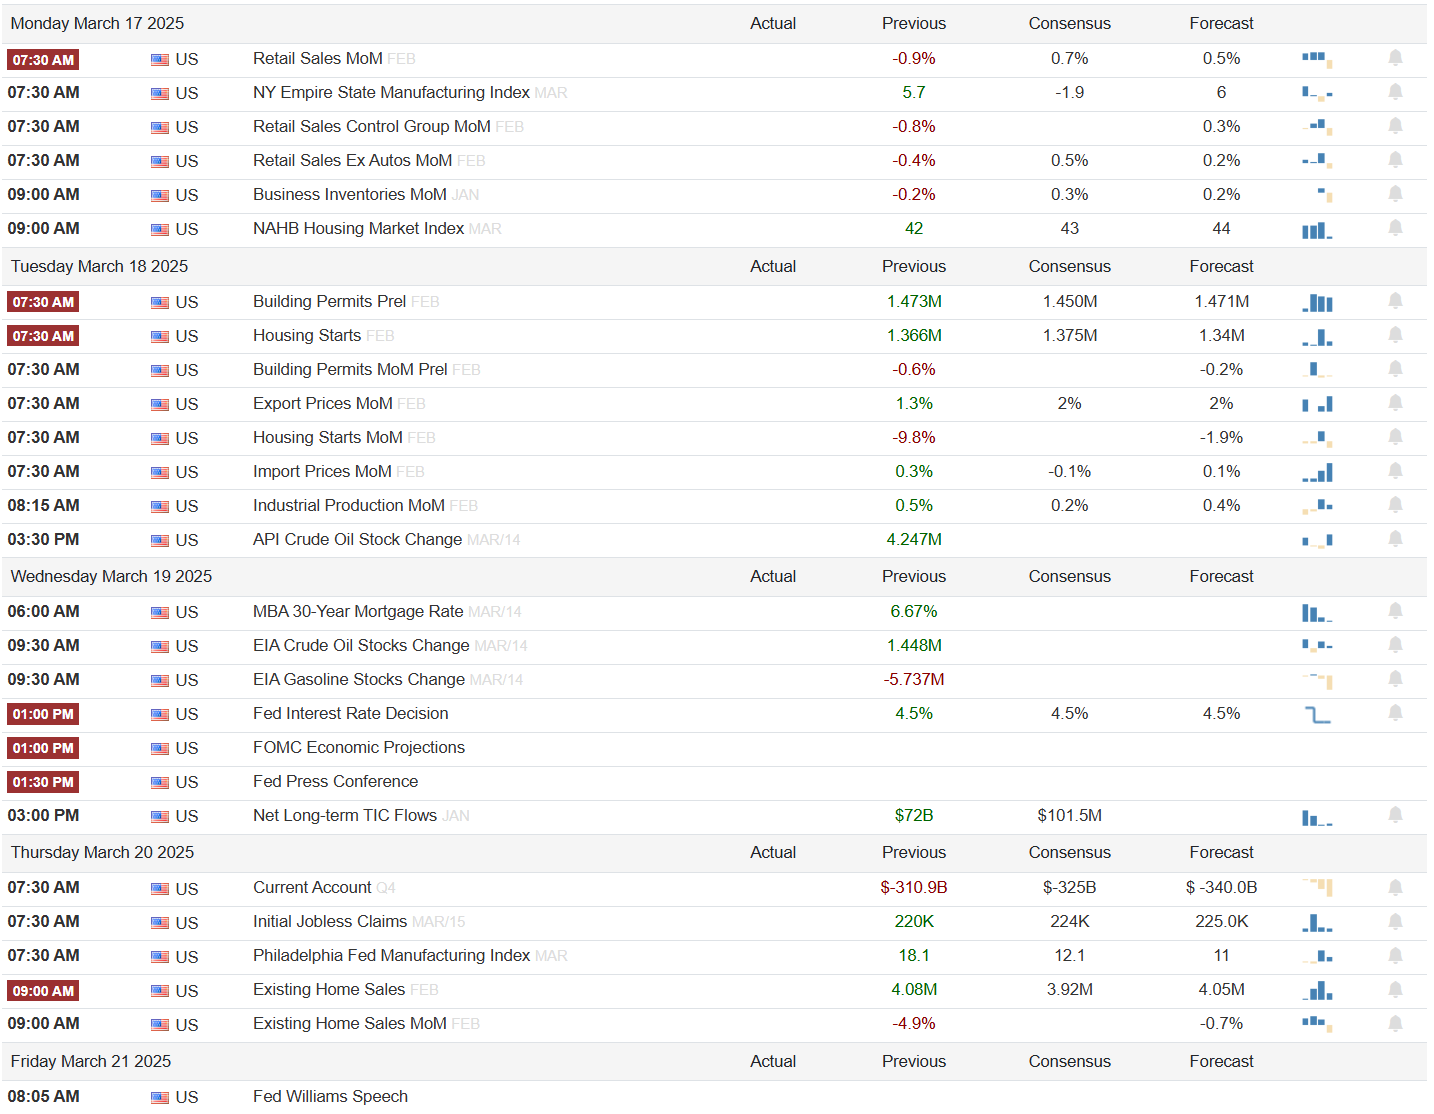
Events On Deck This Week
Here are key events happening this week that have the potential to cause outsized moves in the market or heightened short-term volatility.
Econ Events By Day of Week
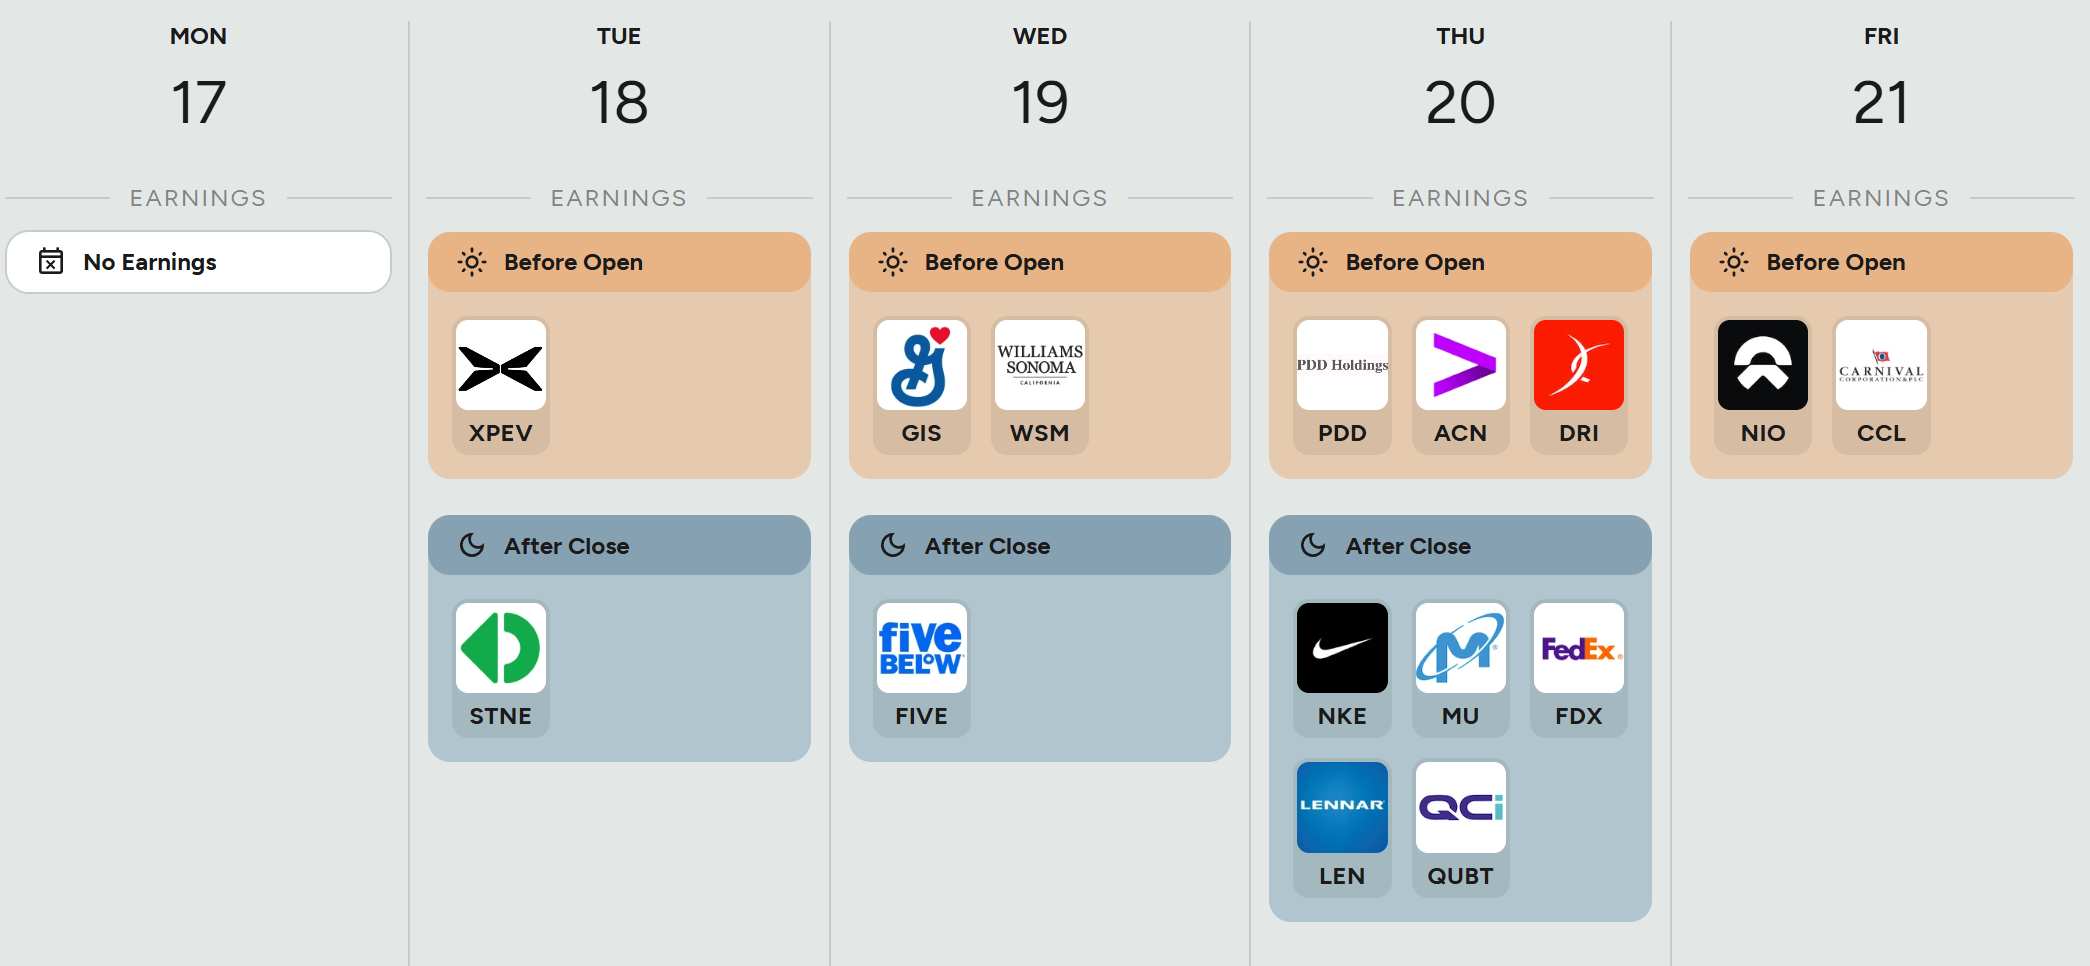
Anticipated Earnings By Day of Week
Thank you for being part of our community and for taking the time to read this publication. Your engagement and insights mean a great deal to all of us, and we're genuinely grateful to share this space with such dedicated and thoughtful readers. Wishing you a productive and successful week ahead in the markets. May the coming days bring clarity and great opportunities. Happy trading!