

Market Momentum: Your Weekly Financial Forecast & Market Prep
Issue 31 / What to expect Feb 03, 2025 thru Feb 07, 2025

In This Issue
Market-On-Close: All of last week’s market-moving news and macro context in under 5 minutes + futures-snapshots
Special Coverage: AI Investing & Lessons From The Recent Deepseek Controversy
The Latest Investor Sentiment Readings
Institutional Support & Resistance Levels For Major Indices: Exactly where to look for support and resistance this week in SPY, QQQ, IWM & DIA
Institutional Activity By Sector: Institutional order flow by sector including the top institutionally-backed names in those sectors. We break it all down and provide the key insights and take-aways you need to navigate institutional positioning this week.
Top Institutional Order Flow In Individual Names: All of the largest sweeps and blocks on lit exchanges and hidden dark pools
Investments In Focus: Bull vs Bear arguments for TDOC, TROW, INOD
Top Institutionally-Backed Gainers & Losers: An explosive watchlist for day traders seeking high-volatility
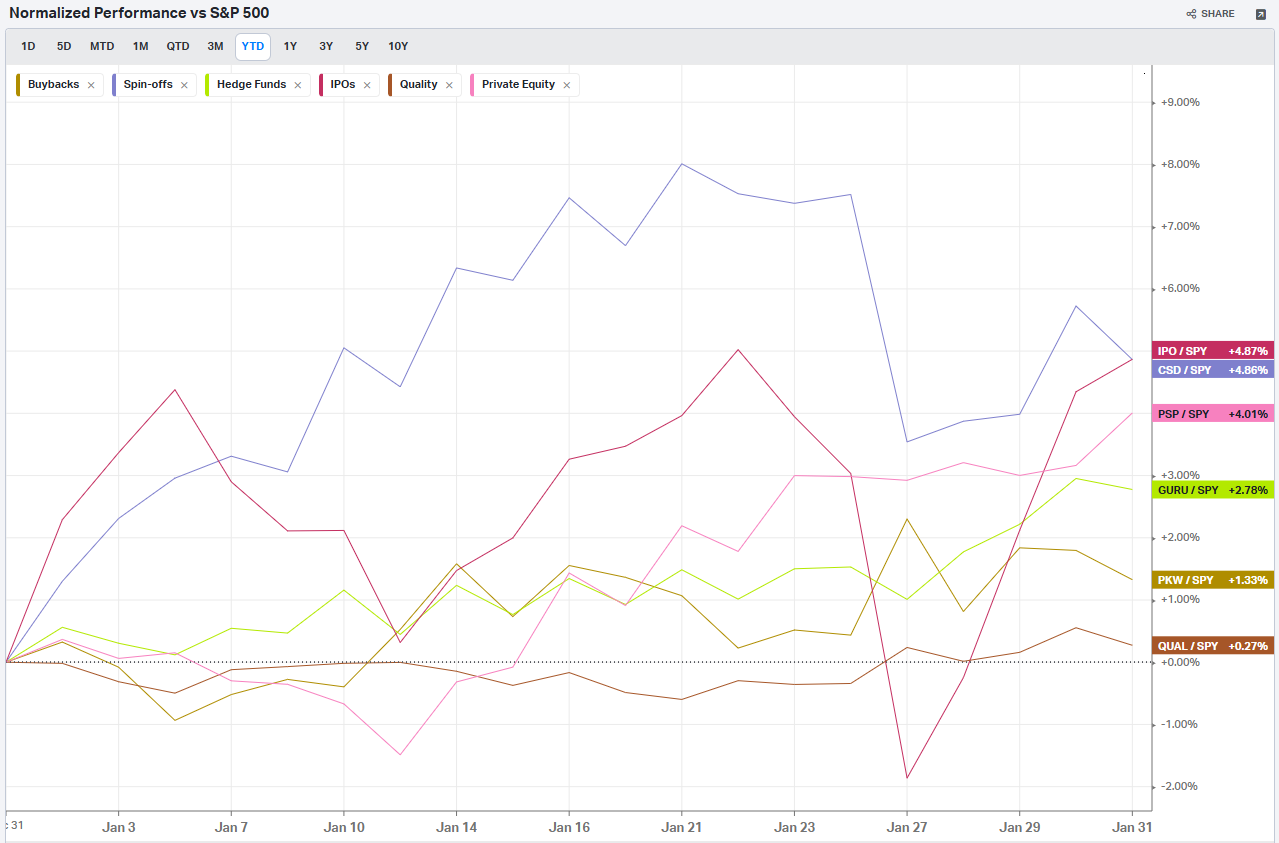
Normalized Performance By Thematics YTD (Sector, Industry, Factor, Energy, Metals, Currencies, and more): which corners of the markets are beating benchmarks, which ones are overlooked and which ones are over-crowded
Key Econ Events and Earnings On-Deck For This Week

Market-On-Close
A Week of Turbulence: Navigating the U.S. Financial Markets
The final week of January 2025 was marked by significant volatility in the U.S. financial markets, driven by a confluence of corporate earnings reports, geopolitical developments, and economic data releases. This period underscored the intricate interplay between policy decisions, market sentiment, and economic indicators.
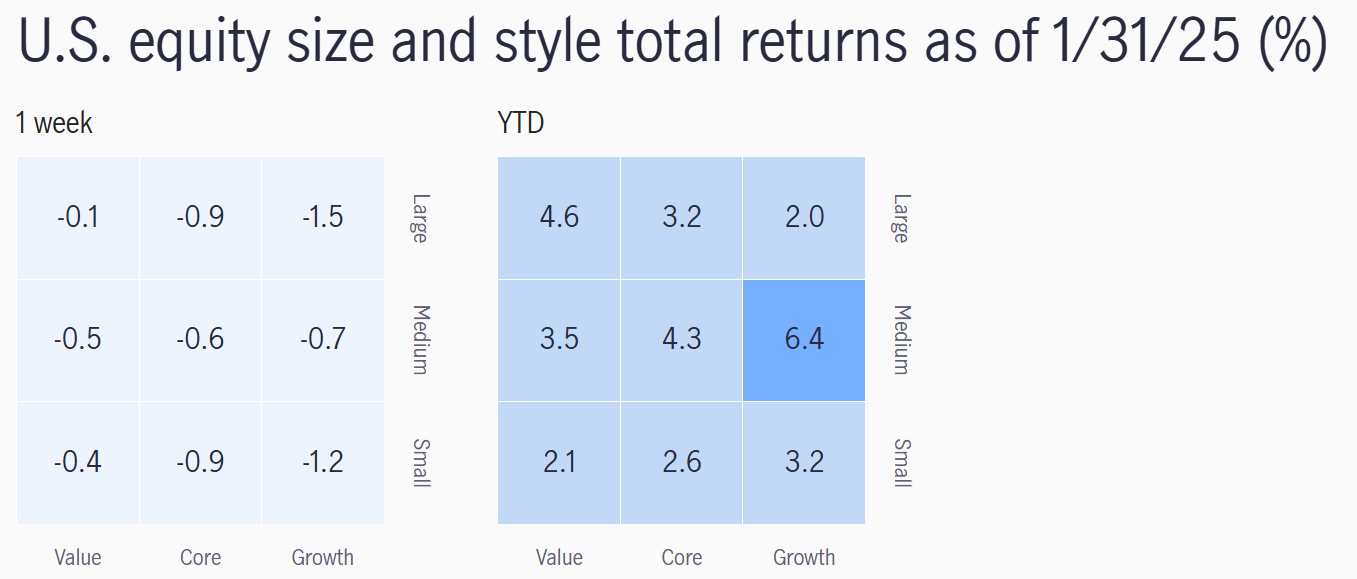
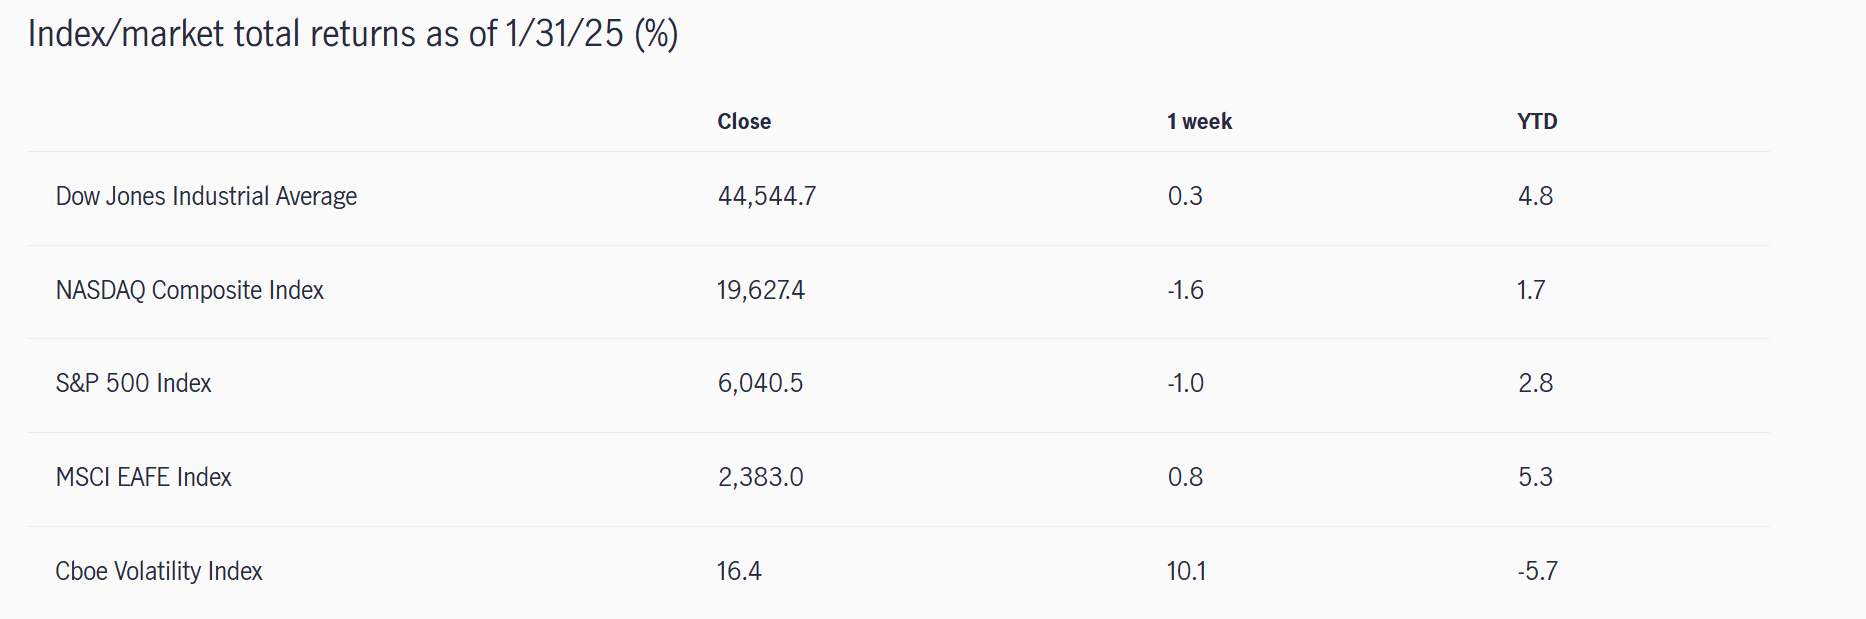
Market Performance Overview
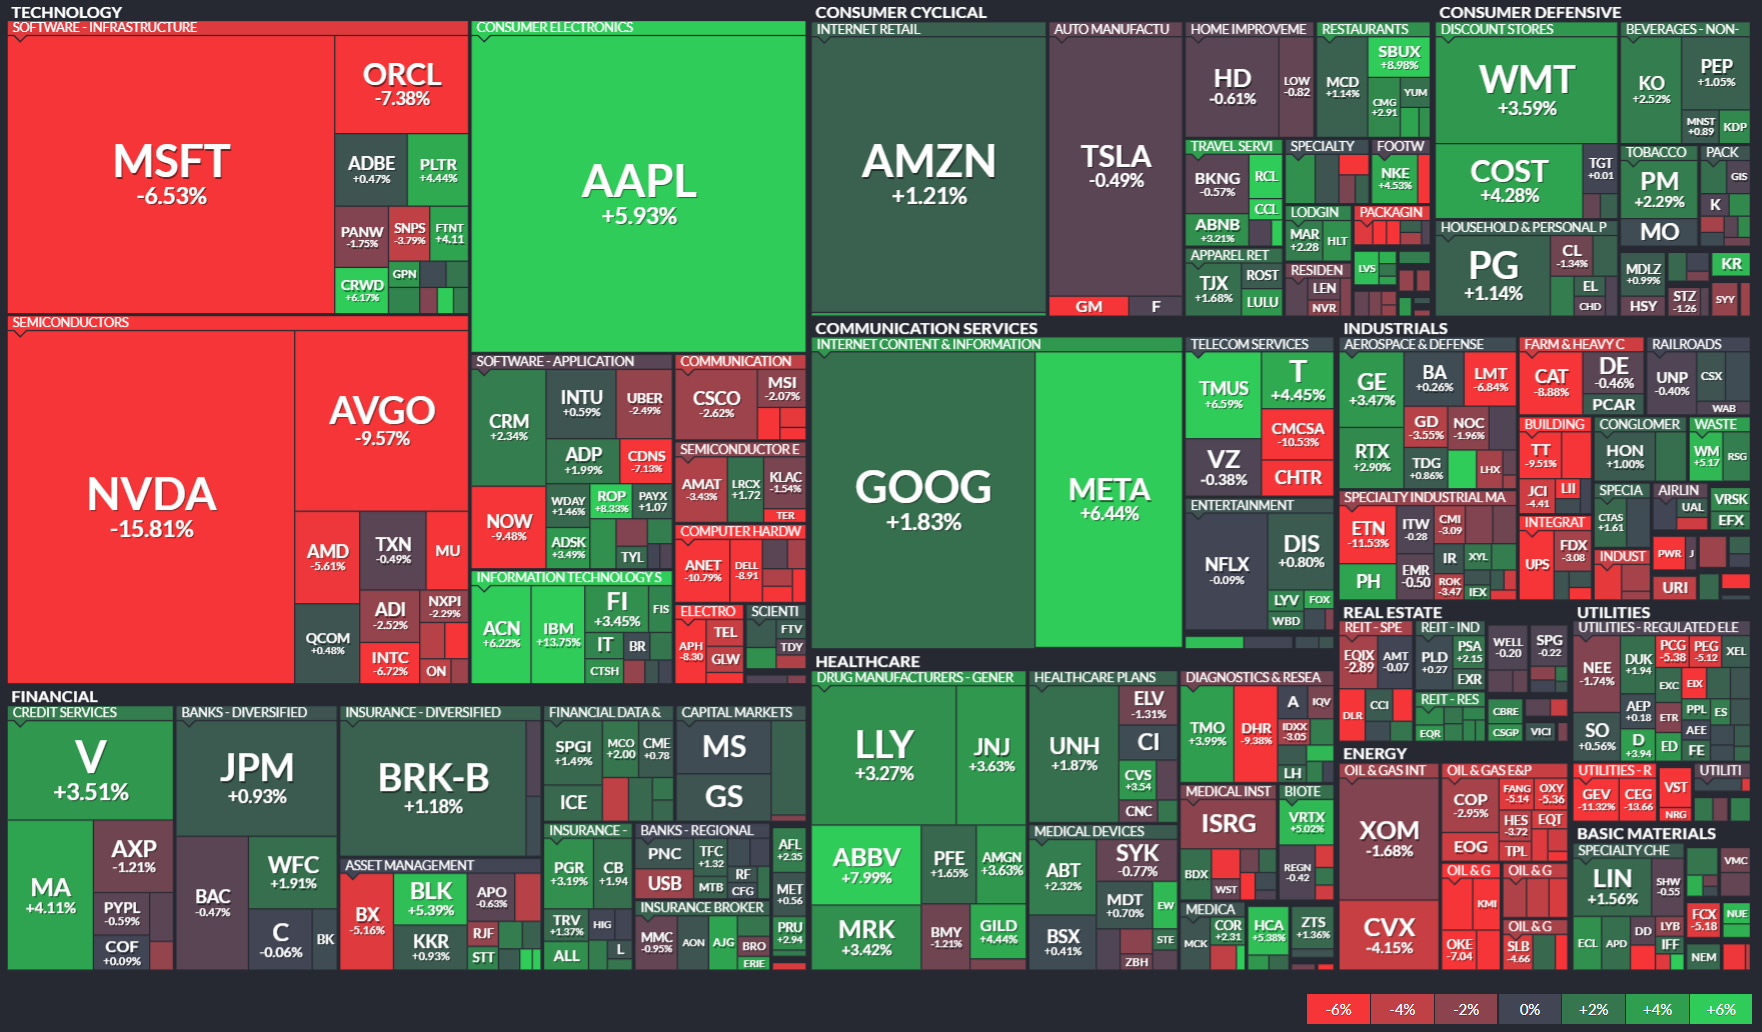
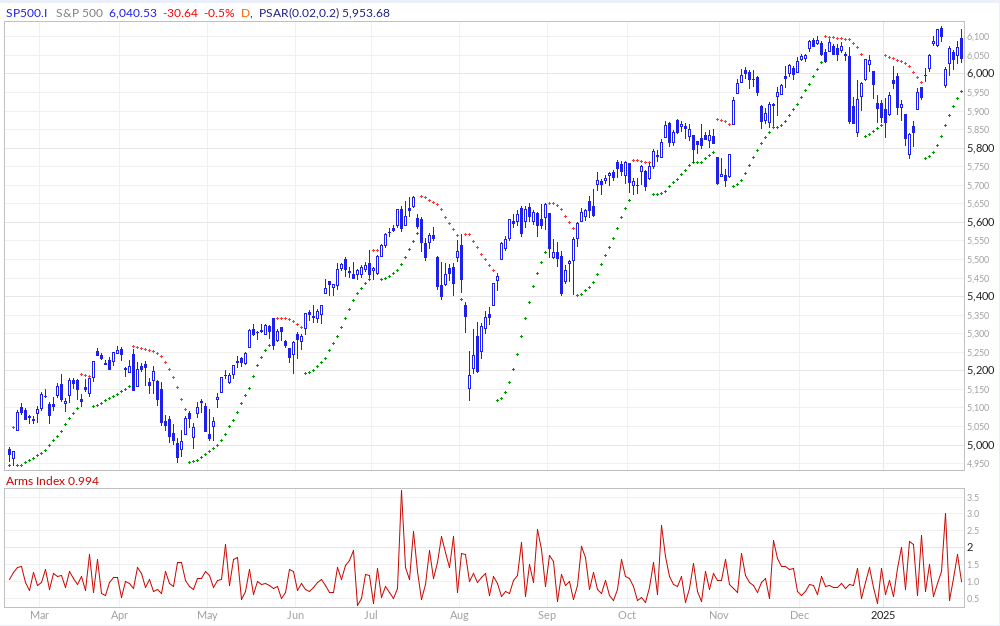
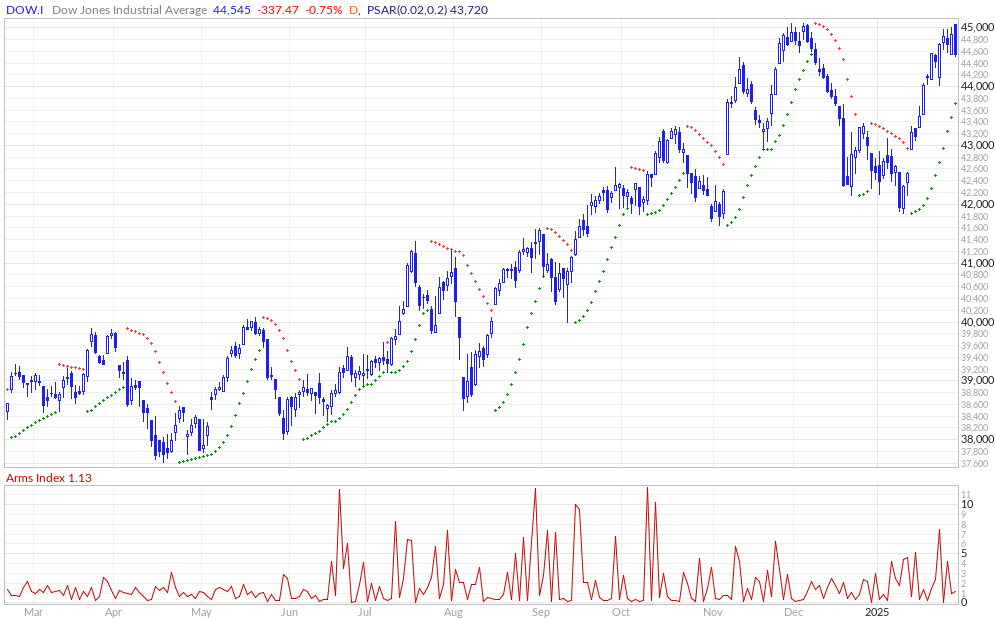
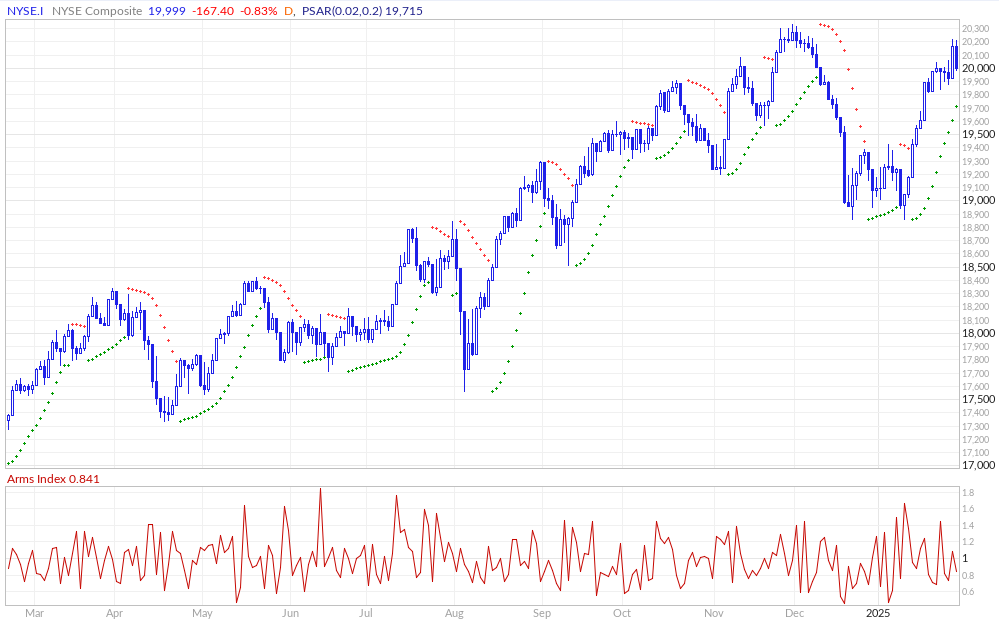
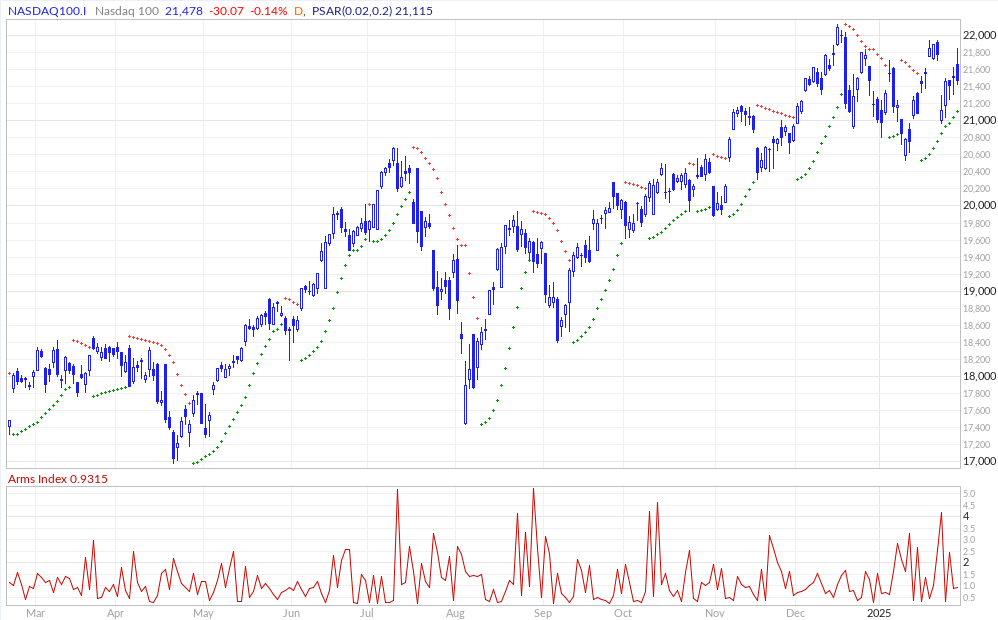
On Friday, January 31, the major U.S. stock indices closed lower, erasing earlier gains. The S&P 500 Index declined by 0.50%, the Dow Jones Industrial Average fell by 0.75%, and the Nasdaq Composite decreased by 0.14%. This downturn was primarily attributed to the White House's announcement that President Trump would proceed with imposing tariffs of 25% on imports from Mexico and Canada, and 10% on goods from China, effective February 1. The immediate implementation of these tariffs heightened concerns about potential economic disruptions and inflationary pressures.
Corporate Earnings and Sector Movements
The week was pivotal for corporate earnings, with several major companies reporting their fourth-quarter results. Apple Inc. reported earnings that slightly exceeded analysts' expectations, despite a miss in iPhone sales. The company's gross margin reached an all-time high, bolstered by growth in its services segment. However, the announcement of impending tariffs overshadowed these positive results, contributing to the broader market decline.
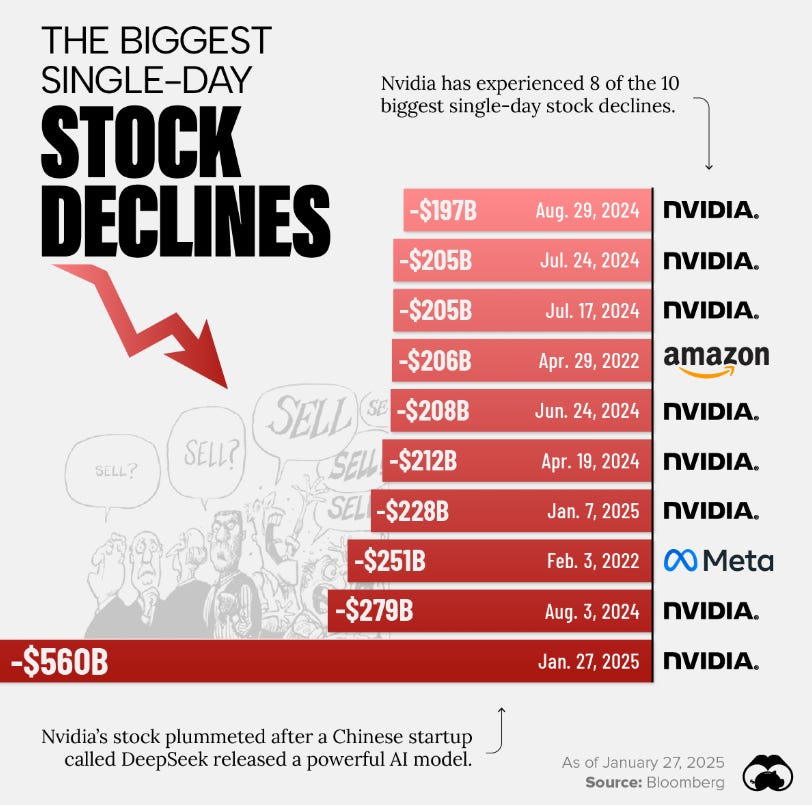
NVIDIA Corporation faced a significant setback, with its shares plummeting by 17% following the emergence of DeepSeek, a Chinese artificial intelligence startup. DeepSeek's new AI model, which reportedly operates with greater efficiency and lower costs, posed a competitive threat to U.S. tech companies, leading to a broad sell-off in the technology sector.

In contrast, IBM experienced a 13% surge in its stock price, driven by investor confidence in its AI strategy. The company's focus on integrating AI into its product offerings resonated with the market, highlighting the growing importance of artificial intelligence across industries.
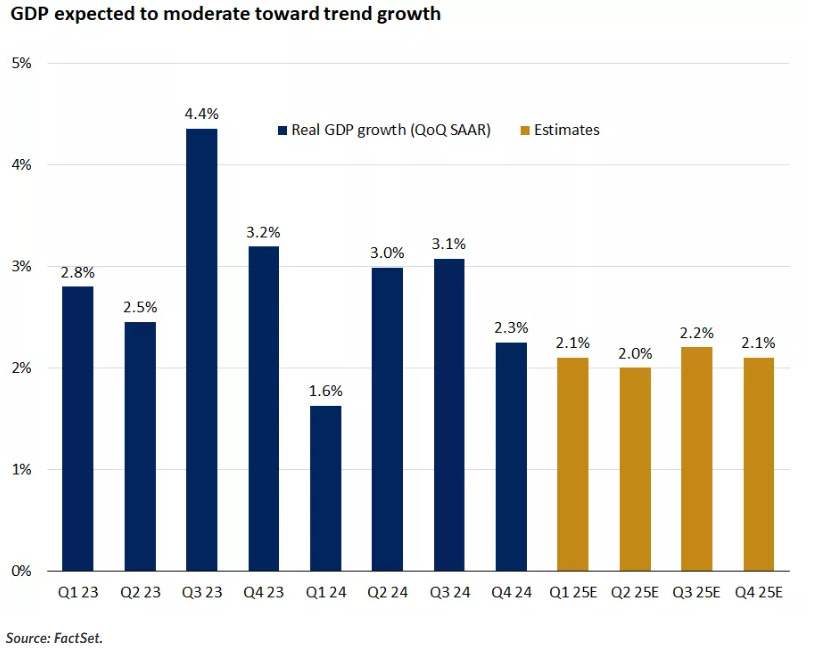
Economic Indicators and Federal Reserve Actions
The U.S. economy demonstrated resilience, with fourth-quarter GDP growing at an annualized rate of 2.3%, slightly below the anticipated 2.4%. Consumer spending remained robust, increasing at a 4.2% annualized rate—the highest since the first quarter of 2023. However, declines in investment and exports moderated overall growth. For the entire year of 2024, the economy expanded by 2.8%, marginally below the 2.9% growth in 2023.
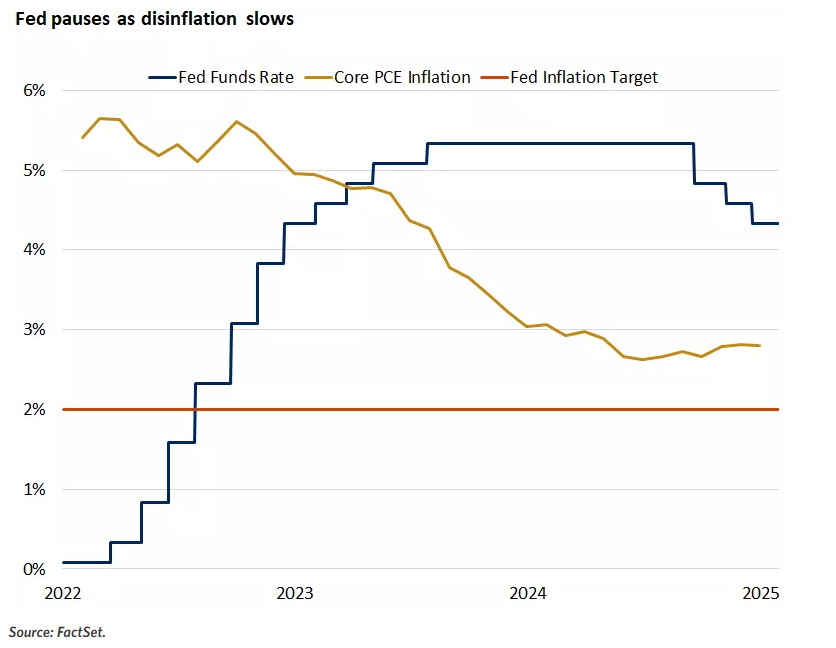
The Federal Reserve concluded its January meeting by maintaining the federal funds rate at 4.25% to 4.50%. The decision reflected a cautious approach amid solid economic growth and persistent inflationary pressures. The core Personal Consumption Expenditures (PCE) price index, the Fed's preferred inflation measure, rose by 2.8% year-over-year in December, remaining above the central bank's 2% target.
Geopolitical Developments and Market Sentiment
Geopolitical tensions influenced market dynamics, particularly with the announcement of new tariffs. The immediate implementation of tariffs on key trading partners raised concerns about supply chain disruptions and increased costs for consumers and businesses. These developments contributed to heightened market volatility, as investors grappled with the potential economic implications.

Conclusion
The week highlighted the sensitivity of financial markets to a complex array of factors, including corporate performance, economic data, and policy decisions. As the U.S. economy navigates these challenges, market participants remain vigilant, assessing the potential impacts on growth, inflation, and investment strategies. The interplay between technological advancements, geopolitical tensions, and economic indicators will continue to shape the financial landscape in the coming months.
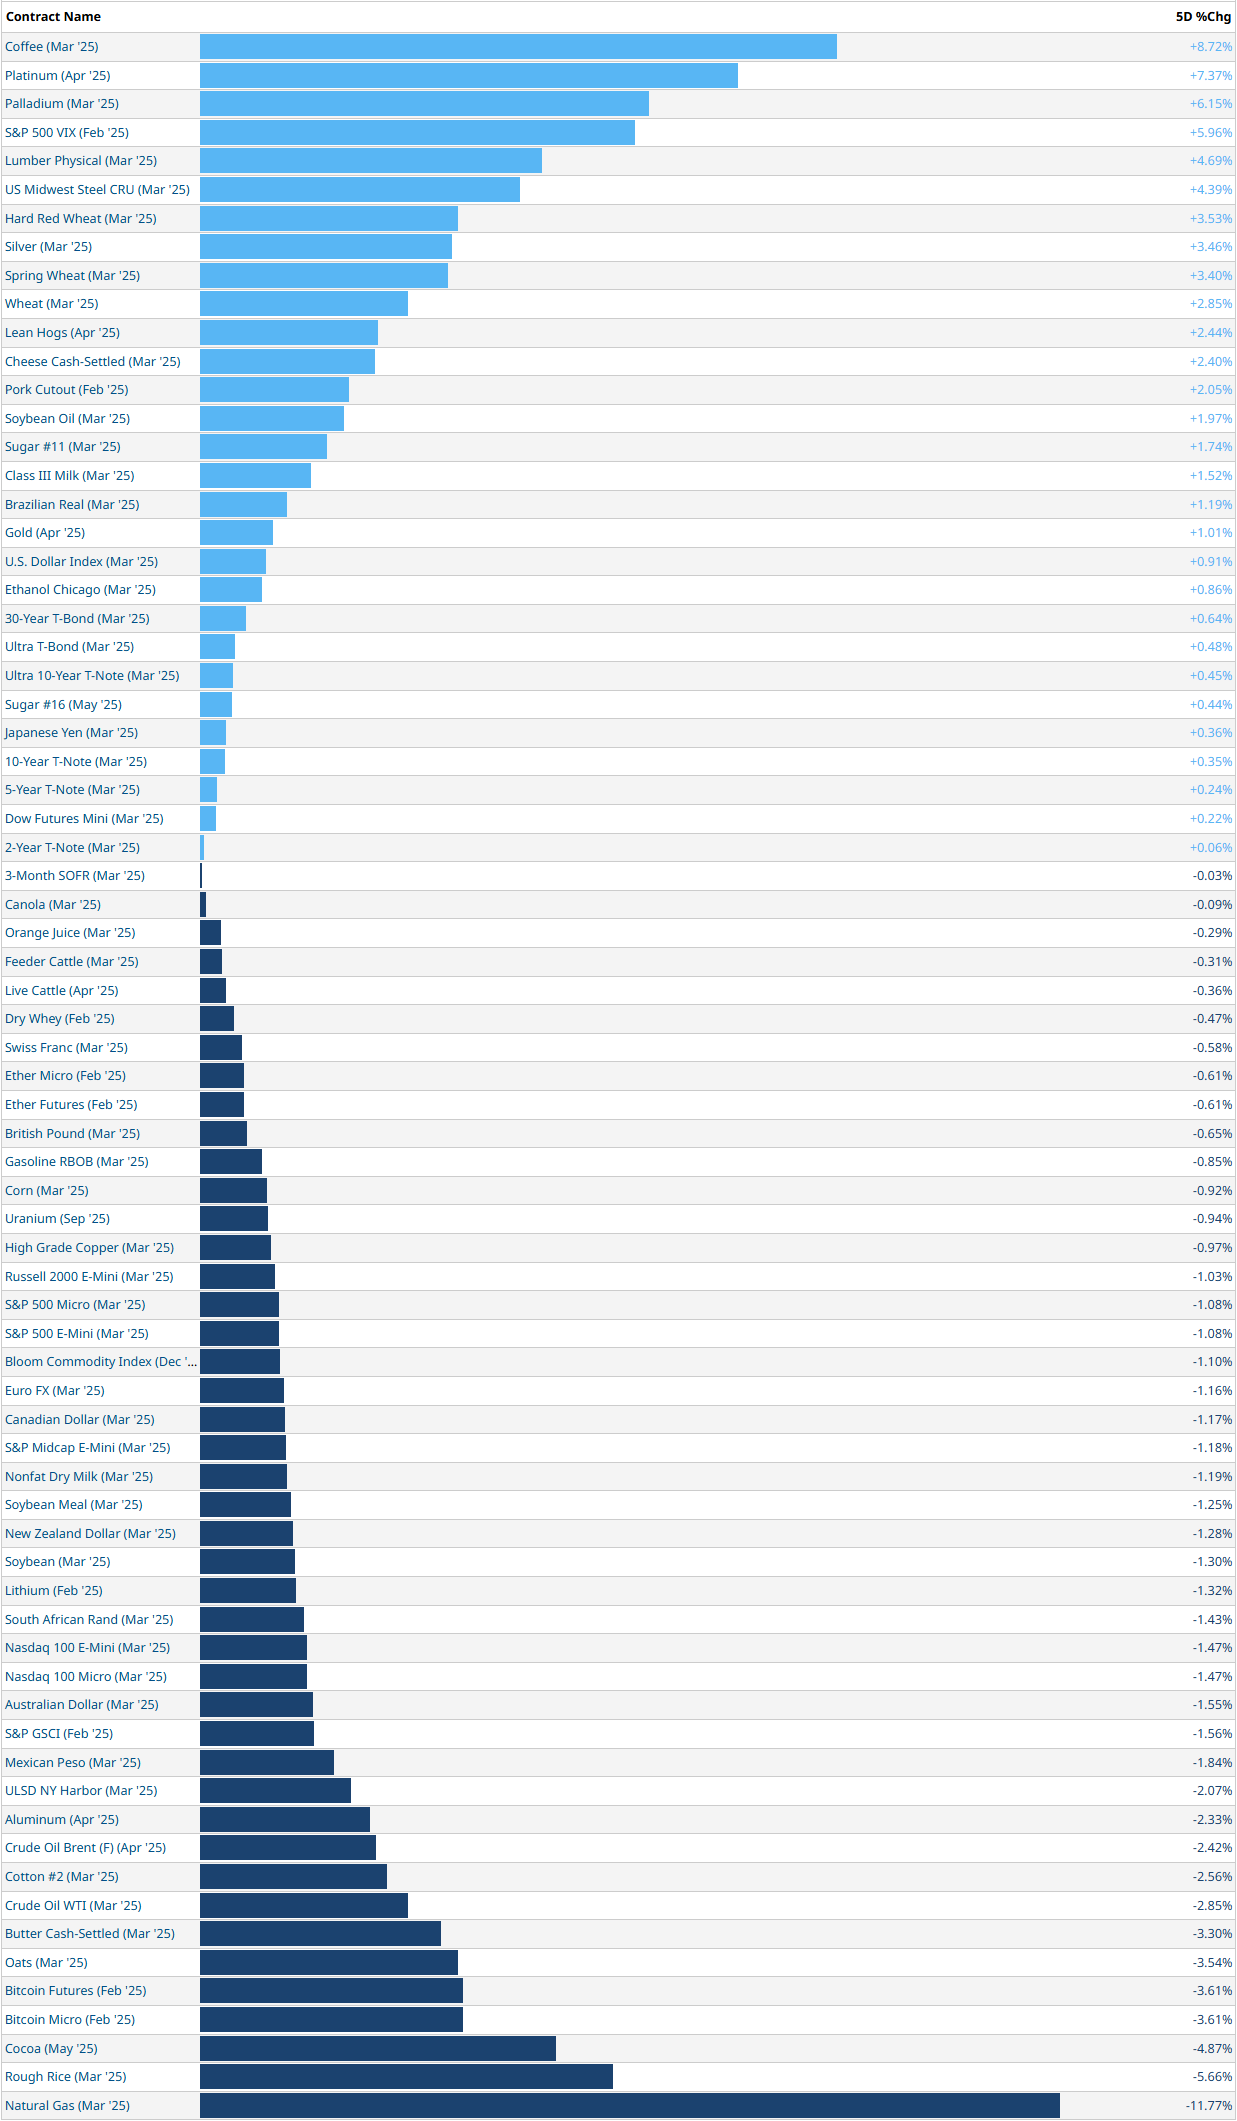
5-Day Futures Performance Leaders
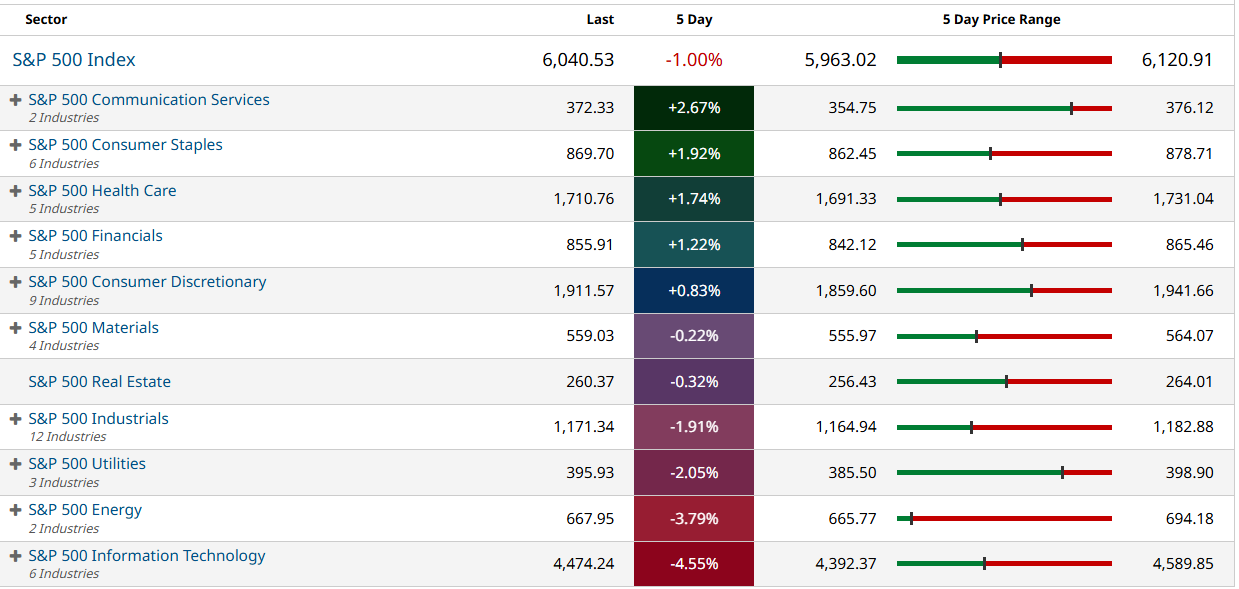
S&P 500 Sector Insights
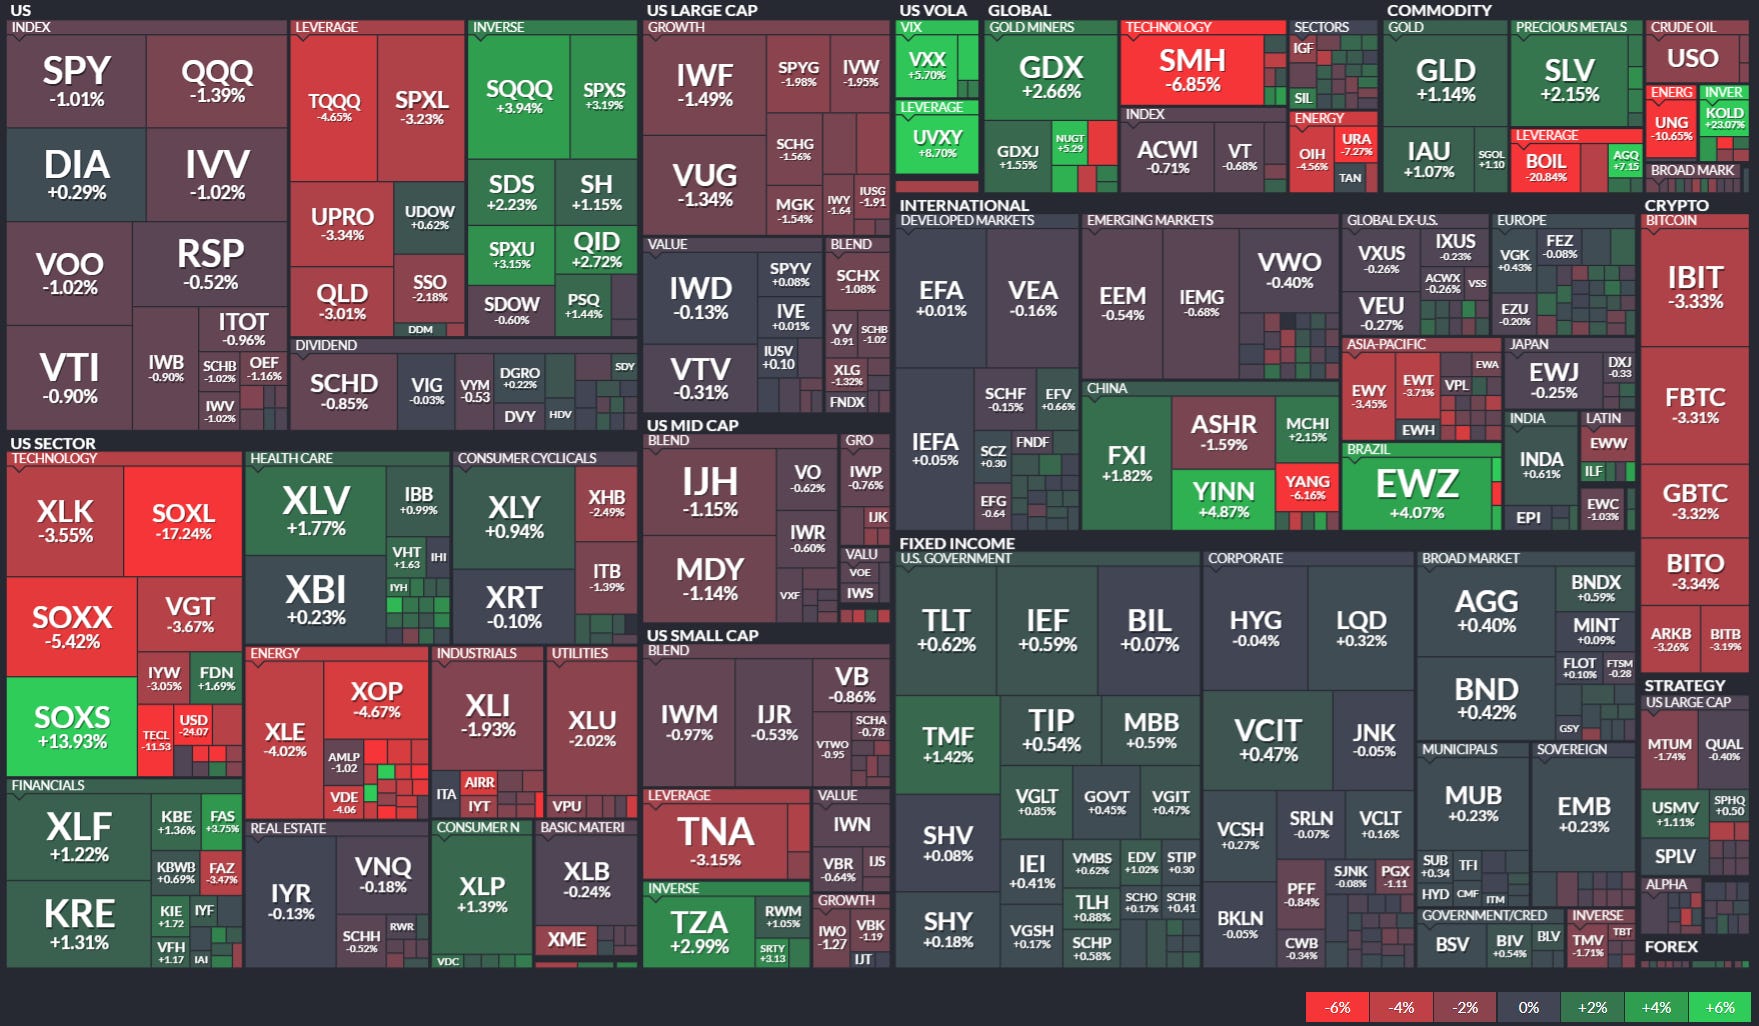
ETF Insights
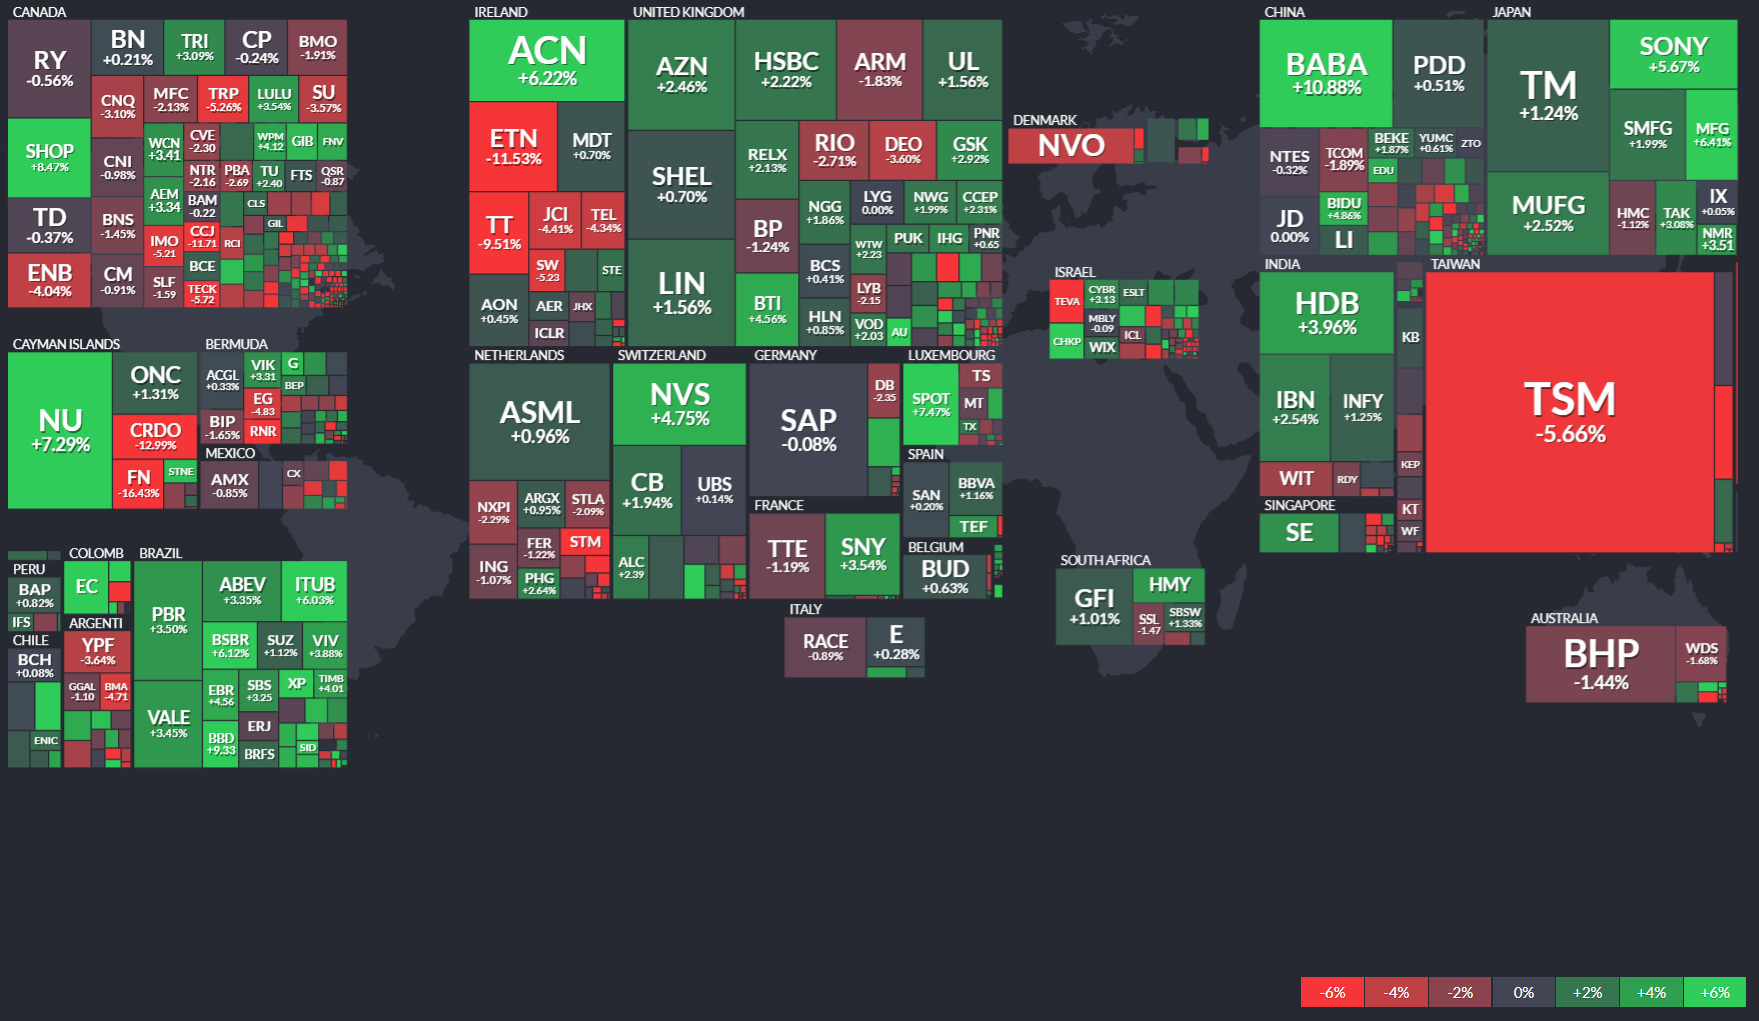
Global Overview

Special Coverage: AI Investing & Lessons From The Recent Deepseek Controversy
Artificial intelligence (AI) has become one of the most transformative and rapidly evolving sectors in modern technology. Its potential to revolutionize industries ranging from healthcare to finance and beyond has attracted immense investor interest, driving exponential growth in valuations and corporate investments. However, with these opportunities come significant risks and volatility, as evidenced by recent market reactions to developments like DeepSeek—a Chinese AI company that briefly sent shockwaves through the sector. For investors navigating this dynamic space, understanding the nuances of market sentiment, technological advancements, and geopolitical complexities is critical for capitalizing on AI’s long-term potential.
Here we examine key takeaways from recent developments in the AI landscape, the volatility inherent in the sector, and the prospects for continued growth following an already impressive run. By examining the lessons from events like the DeepSeek controversy and analyzing broader market trends, AI investors can continue balancing opportunity and risk.
The DeepSeek Episode: Lessons in Market Volatility
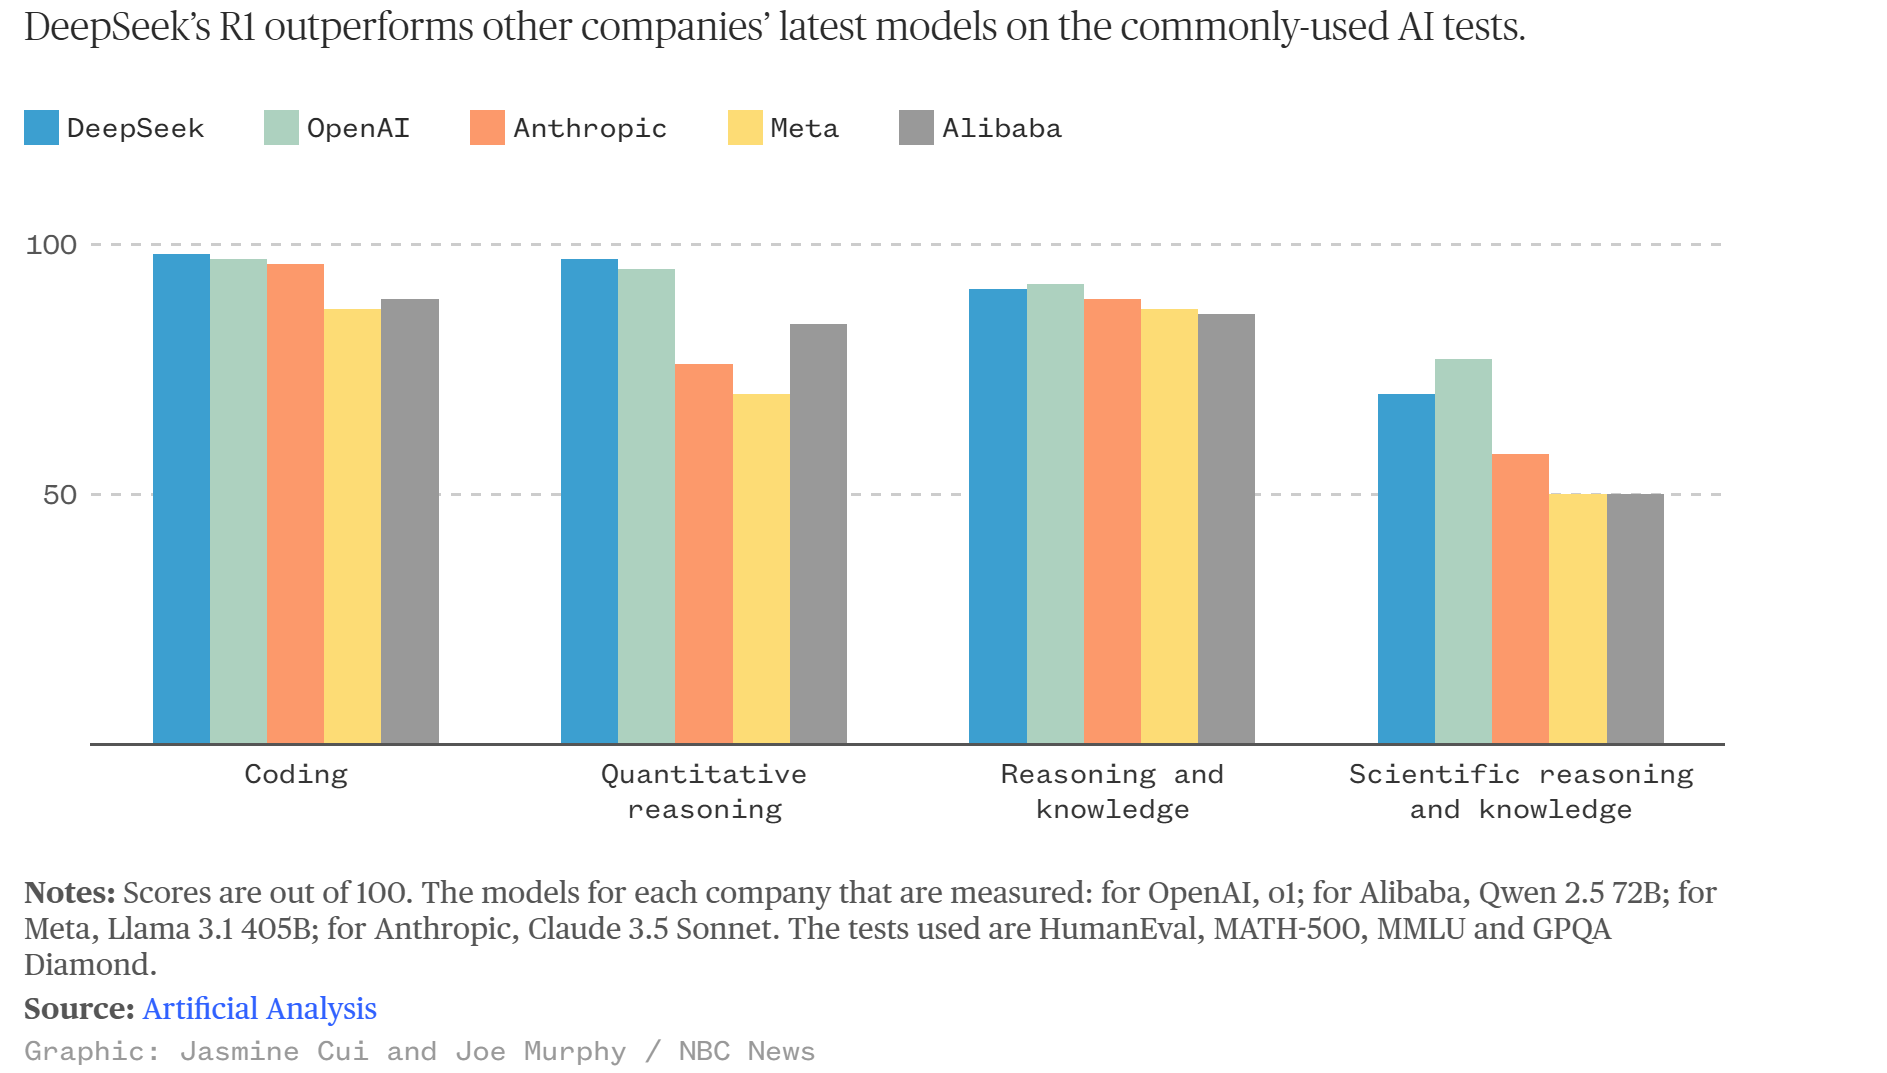
In late 2024, viral social media posts claimed that DeepSeek, a Chinese AI company, had replicated the capabilities of U.S.-based OpenAI at a fraction of the cost—just $6 million. The narrative quickly gained traction, erasing $1 trillion in market value from U.S. tech stocks and triggering a 17% drop in Nvidia’s stock price. This reaction underscores the hypersensitivity of the AI market to news and speculation.
The Reality Behind the Hype
Despite the initial panic, deeper analysis revealed that the $6 million figure cited by DeepSeek referred only to the final training run for its DeepSeek-V3 model, excluding significant research and development costs. Moreover, the model’s development relied heavily on U.S.-made GPUs, such as those from Nvidia. The misleading comparison between DeepSeek’s training costs and the broader investments made by U.S. companies highlighted the importance of contextualizing claims in the AI space.
Implications for Investors
The DeepSeek episode serves as a cautionary tale about the volatility of the AI sector and the need for a disciplined, long-term approach to investing. Rapid market reactions to unverified claims can create buying opportunities for investors who focus on fundamentals rather than hype.
The Early Stages of AI Adoption
Despite its transformative potential, AI remains in the early stages of adoption. Companies like Meta have announced plans to invest tens of billions of dollars annually in AI infrastructure, underscoring the sector’s long runway for growth. These investments aim to expand AI applications across industries, from automating routine tasks to enabling groundbreaking innovations.
Expanding Applications
AI’s versatility ensures its integration into a wide range of sectors. In healthcare, AI-powered diagnostics and personalized treatment plans are improving patient outcomes. In finance, AI algorithms optimize trading strategies and enhance fraud detection. Autonomous vehicles, powered by AI, promise to revolutionize transportation, while AI-driven tools in education and entertainment are enhancing user experiences.
Investment Implications
For investors, this broadening range of applications translates into multiple avenues for growth. Companies with strong positions in AI infrastructure, software, and niche applications are well-positioned to capitalize on this expanding market.

The Central Role of Hardware in AI’s Growth
AI’s rapid advancement relies heavily on high-performance hardware, particularly GPUs. Nvidia has emerged as a dominant player in this space, providing the computational power needed to train and deploy advanced AI models. The reliance of companies like DeepSeek on Nvidia’s hardware underscores its critical role in the AI ecosystem.
Sustained Demand for GPUs
As AI models become more sophisticated, their computational requirements increase. This trend ensures sustained demand for high-performance hardware, benefiting companies like Nvidia. Additionally, the development of AI-specific chips and architectures, such as Nvidia’s Tensor Cores, further solidifies its leadership position.
Opportunities for Investors
Investors should consider exposure to hardware providers as a foundational component of their AI portfolios. The growing computational demands of AI ensure a long-term growth trajectory for this segment of the market.
Innovation and Differentiation in the AI Space
The DeepSeek episode also highlights the importance of innovation and differentiation in the AI market. While cost-effective solutions like those pioneered by DeepSeek can gain attention, they often build on existing infrastructure and lack the foundational breakthroughs needed to disrupt established players.
Cost Optimization vs. Foundational Innovation
DeepSeek’s reliance on techniques like distillation—which optimizes smaller models using larger ones—illustrates the potential for cost-effective innovations. However, these approaches often depend on the foundational work of industry leaders, such as OpenAI and Google DeepMind. Companies with the resources to invest in foundational research and development maintain a significant competitive edge.
Strategic Focus for Investors
Investors should prioritize companies with a track record of innovation and significant R&D investments. These companies are better positioned to lead in an increasingly competitive landscape.
Global Competition and Regulatory Complexities
The AI sector operates within a complex geopolitical environment, with the U.S. and China vying for dominance. This competition introduces both opportunities and risks for investors.
Geopolitical Rivalry
Export restrictions on U.S. AI hardware, such as GPUs, highlight the growing tension between the U.S. and China. While these restrictions aim to limit China’s technological advancements, they also create challenges for U.S. companies seeking to access the Chinese market.
Regulatory Scrutiny
As AI becomes more pervasive, regulatory scrutiny is increasing. Issues such as data privacy, algorithmic transparency, and ethical considerations could impact how companies develop and deploy AI technologies. Investors should monitor regulatory developments closely, as they could influence the competitive landscape.
Balancing Growth and Valuations
AI’s rapid growth has led to impressive valuations for many companies in the space. While this reflects the sector’s potential, it also raises concerns about near-term upside and the sustainability of current valuations.
Lofty Valuations
The strong performance of AI companies, particularly in 2023 and 2024, has driven up valuations. While these reflect investor optimism, they may limit near-term upside as markets digest past gains.
Sustained Tailwinds
Despite high valuations, the fundamental drivers of AI growth remain intact. The increasing adoption of AI across industries, coupled with sustained investments from leading companies, ensures a robust growth trajectory over the long term.
Investment Strategies for AI Investors
To navigate the volatility and capitalize on the growth potential of the AI sector, investors should adopt a disciplined and diversified approach.
Diversify Across the Ecosystem
AI’s growth extends beyond hardware and software. Investors should consider exposure to cloud service providers, data analytics firms, and niche AI applications to capture the full spectrum of opportunities.
Focus on Quality
Companies with strong leadership, significant R&D investments, and competitive moats are better positioned to weather volatility and sustain long-term growth. Investors should prioritize quality over hype.
Prepare for Volatility
AI’s transformative potential attracts significant market attention, leading to sharp valuation swings. Investors should view market dips as opportunities to accumulate positions in high-quality names.
Monitor Emerging Players
Smaller firms like DeepSeek can drive innovation and disrupt traditional cost structures. While these companies may not threaten established players, they offer valuable insights into emerging trends and potential investment opportunities.

Conclusion: A Long-Term View on AI
The AI sector represents one of the most exciting and transformative investment opportunities of our time. While volatility is a given, the sustained investment from leading companies, the broadening range of AI applications, and the reliance on high-performance hardware ensure a solid growth trajectory for the long term. By focusing on fundamentals, diversifying across the ecosystem, and maintaining a long-term perspective, investors can navigate the challenges of this dynamic space and capitalize on its immense potential.
As the DeepSeek episode demonstrates, the AI market is highly sensitive to news and speculation. However, the underlying drivers of growth—innovation, infrastructure investment, and expanding applications—remain strong. For investors willing to embrace volatility and adopt a disciplined approach, the AI sector offers unparalleled opportunities for growth and transformation.

US Investor Sentiment
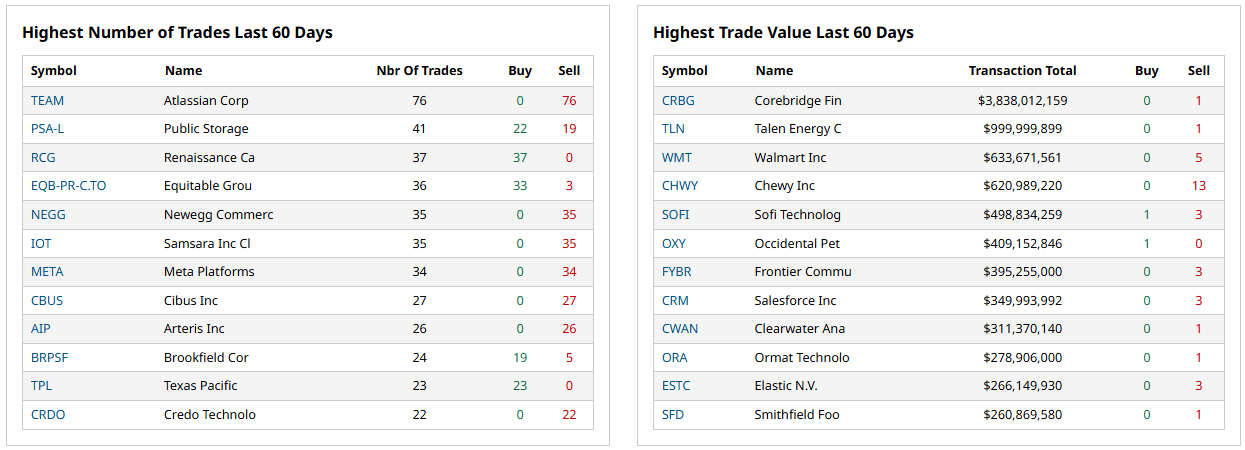
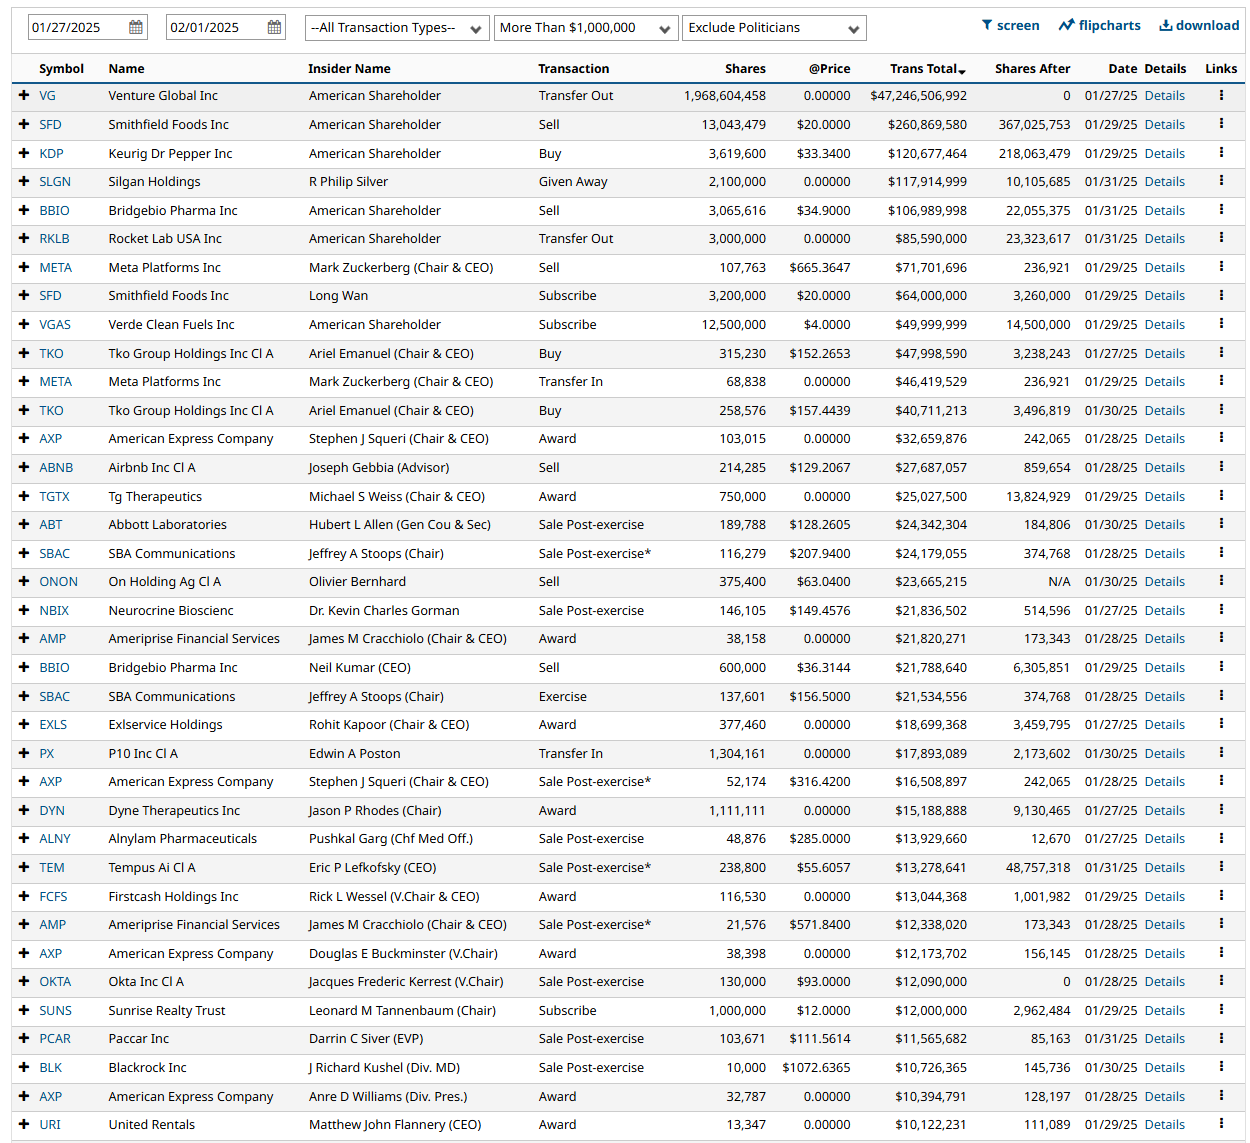
Insider Trading
Insider trading occurs when a company’s leaders or major shareholders trade stock based on non-public information. Tracking these trades can reveal insider expectations about the company’s future. For example, large purchases before an earnings report or drug trial results might indicate confidence in upcoming good news.
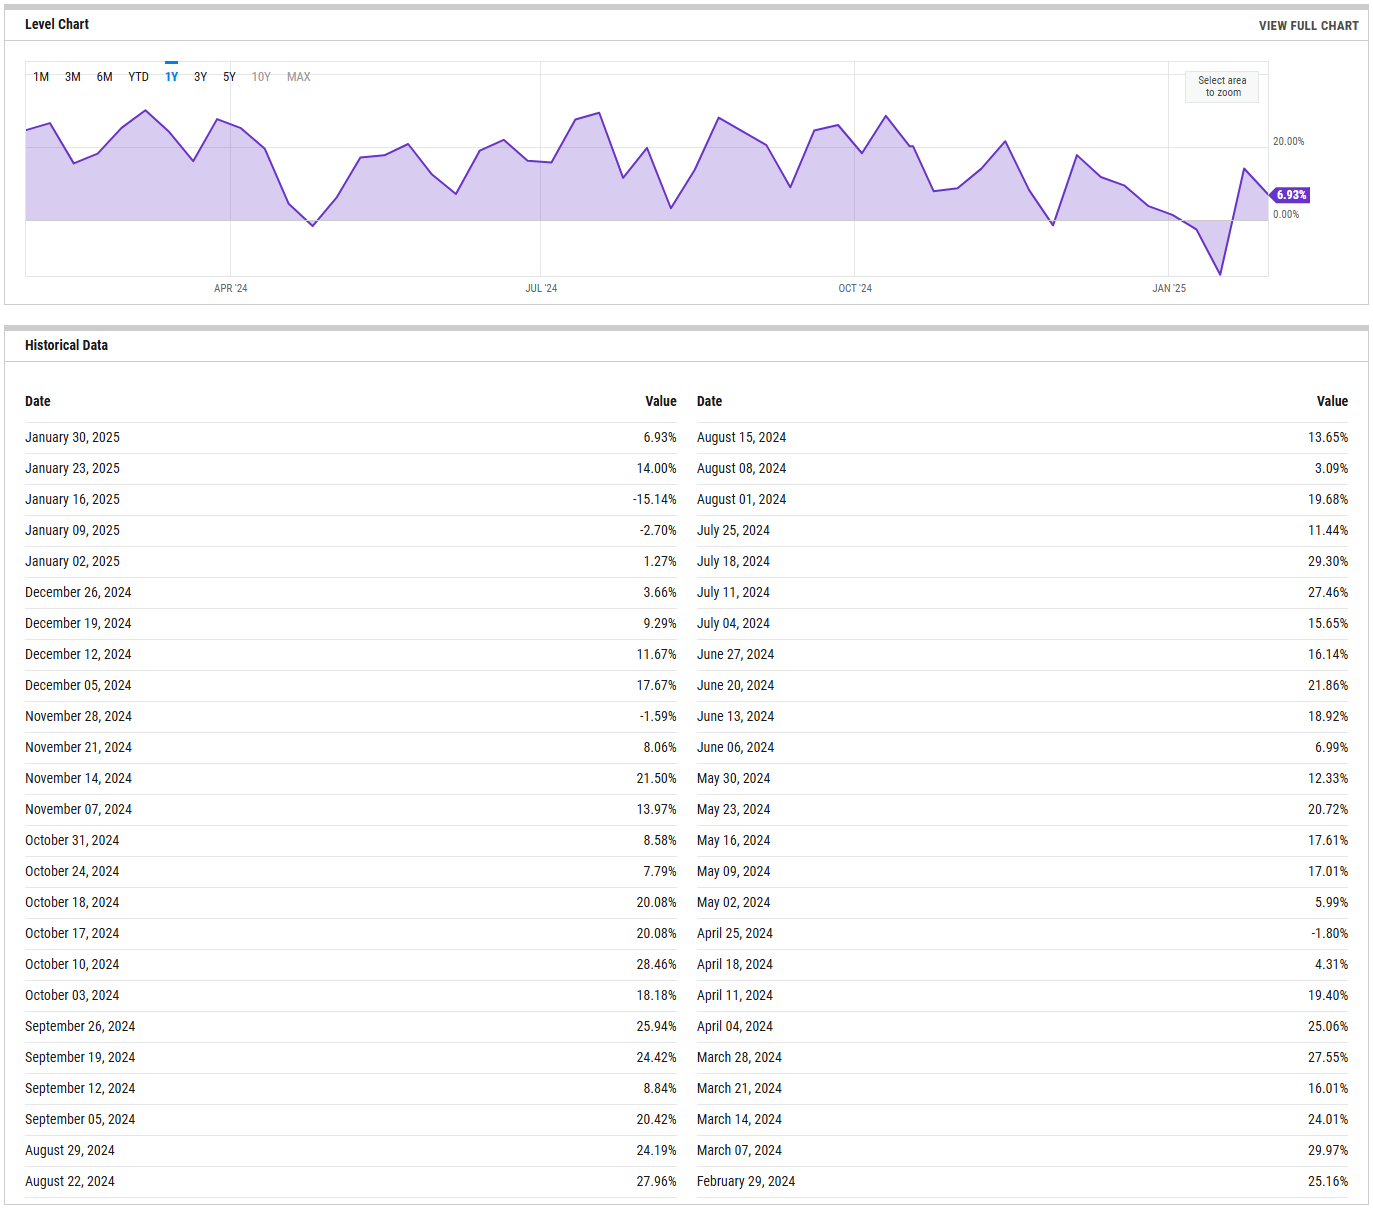
%Bull-Bear Spread
The %Bull-Bear Spread chart is a sentiment indicator that shows the difference between the percentage of bullish and bearish investors, often derived from surveys or sentiment data, such as the AAII (American Association of Individual Investors) sentiment survey. This spread tells investors about the prevailing mood in the market and can provide insights into market extremes and potential turning points.
Bullish or Bearish Sentiment:
When the spread is positive, it means more investors are bullish than bearish, indicating optimism about the market’s direction.
A negative spread indicates more bearish sentiment, meaning more investors expect the market to decline.
Contrarian Indicator:
The %Bull-Bear Spread is often used as a contrarian indicator. For example, extremely high levels of bullish sentiment might suggest that the market is overly optimistic and could be due for a correction.
Similarly, when bearish sentiment is extremely high, it might indicate that the market is overly pessimistic, and a rally could be on the horizon.
Market Extremes and Reversals:
Historically, extreme values of the spread (both positive and negative) can signal turning points in the market. A very high positive spread can signal market exuberance, while a very low or negative spread may indicate fear or capitulation.
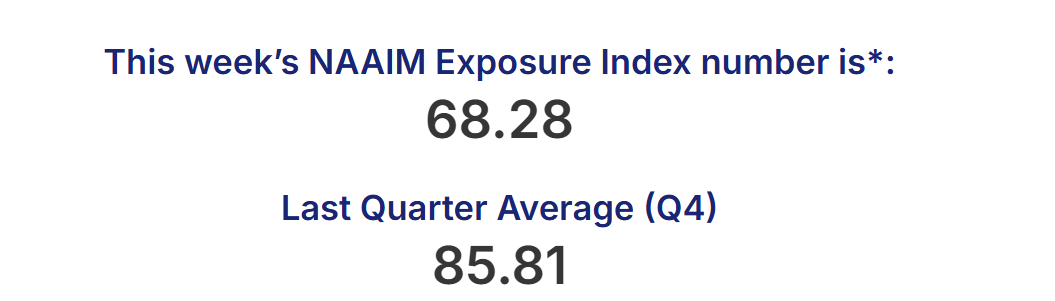
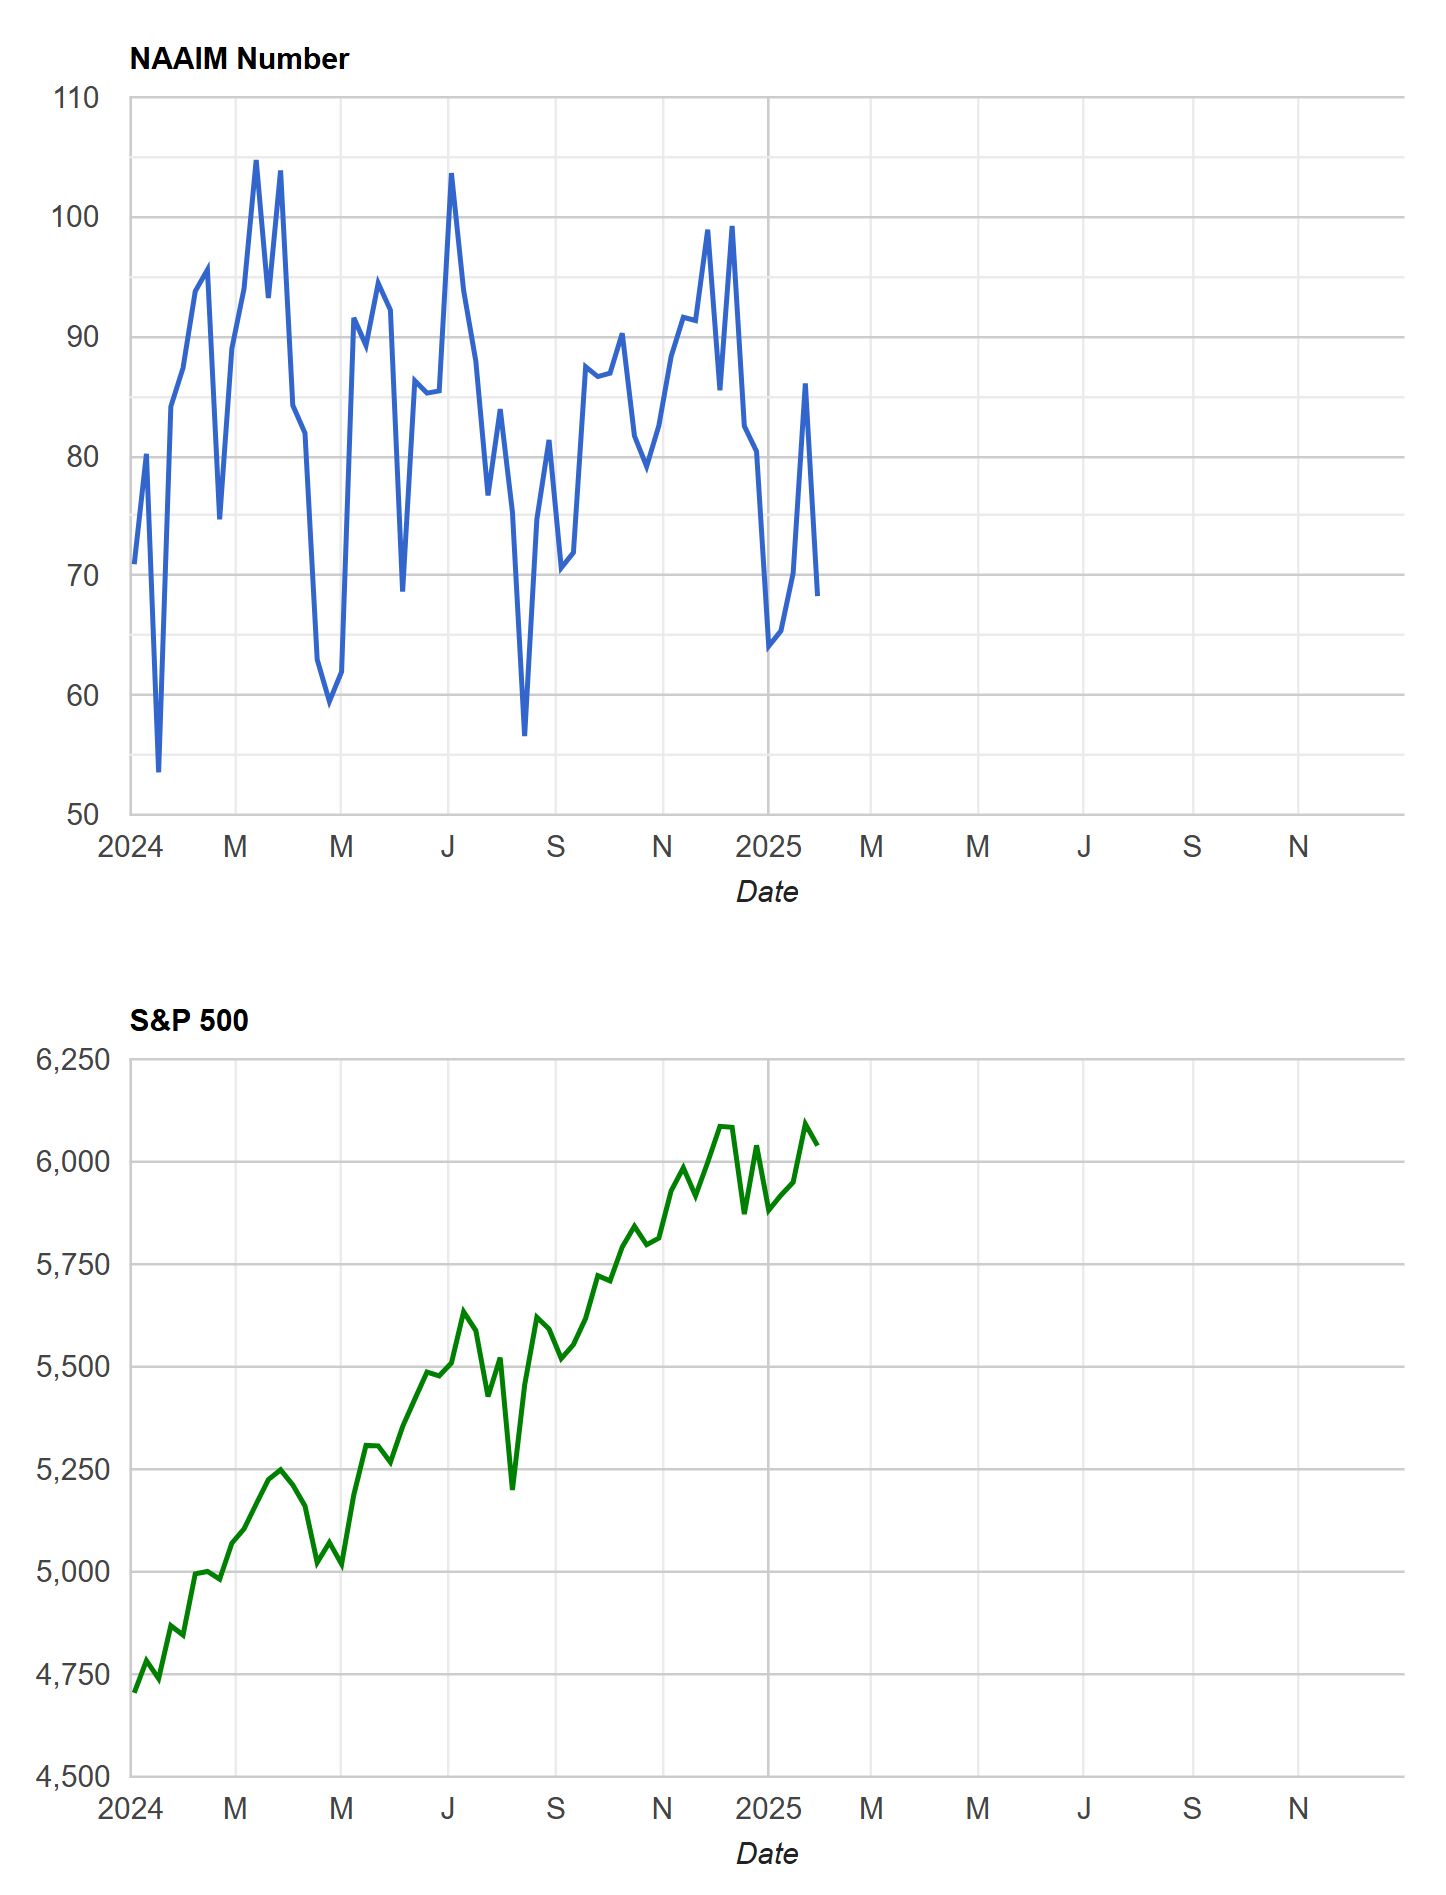
NAAIM Exposure Index
The NAAIM Exposure Index (National Association of Active Investment Managers Exposure Index) measures the average exposure to U.S. equity markets as reported by its member firms. These are typically active money managers who provide their equity exposure levels weekly. The index offers insight into how much these managers are investing in equities at any given time, ranging from being fully short (-100%) to leveraged long (up to +200%).
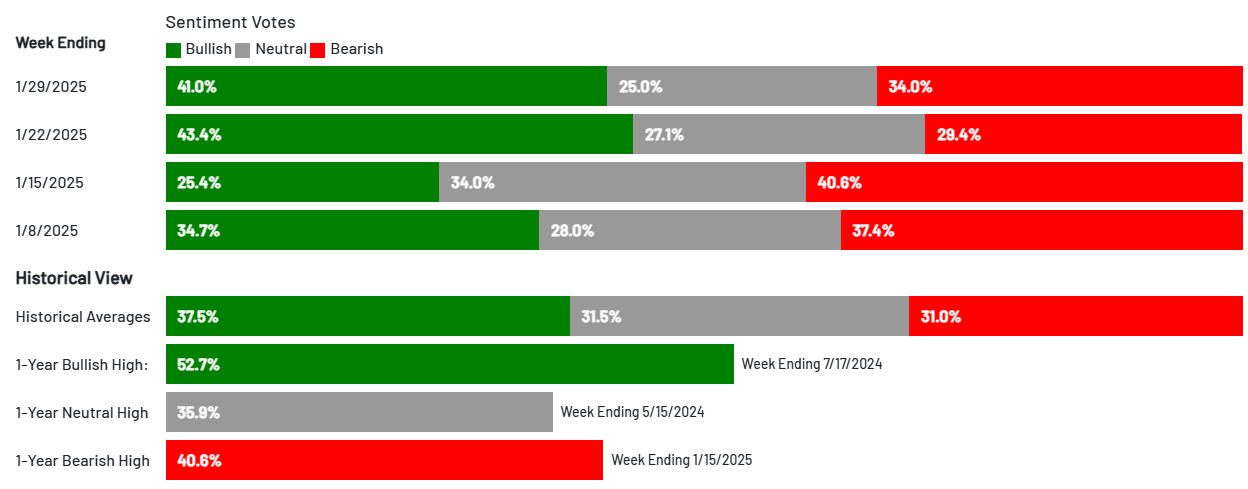
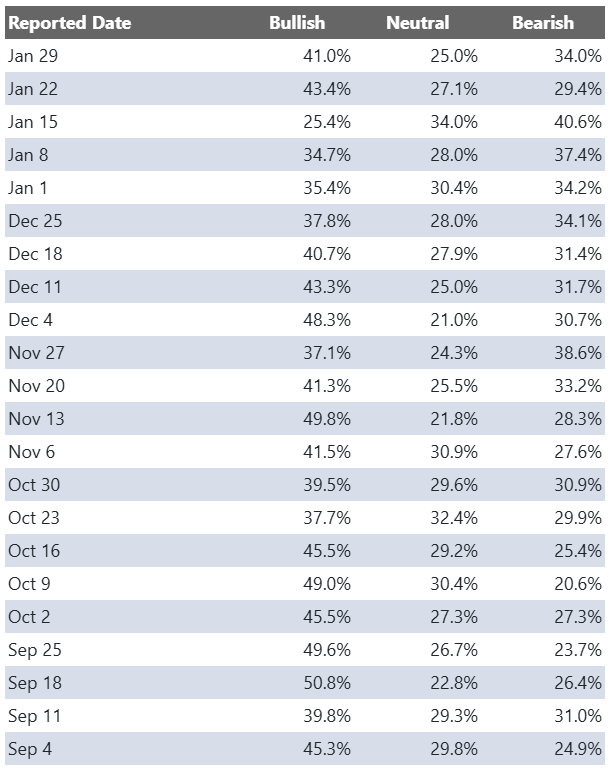
AAII Investor Sentiment Survey
The AAII Investor Sentiment Survey is a weekly survey conducted by the American Association of Individual Investors (AAII) to gauge the mood of individual investors regarding the direction of the stock market over the next six months. It provides insights into whether investors are feeling bullish (expecting the market to rise), bearish (expecting the market to fall), or neutral (expecting the market to stay about the same).
Key Points:
Bullish Sentiment: Reflects the percentage of investors who believe the stock market will rise in the next six months.
Bearish Sentiment: Represents those who expect a decline.
Neutral Sentiment: Reflects investors who anticipate little to no market movement.
The survey is widely followed as a contrarian indicator, meaning that extreme levels of bullishness or bearishness can sometimes signal market turning points. For example, when a large number of investors are overly optimistic (high bullish sentiment), it could suggest a market top, while excessive pessimism (high bearish sentiment) may indicate a market bottom is near.
SPX Put/Call Ratio
The SPX Put/Call Ratio is an indicator that is used to gauge market sentiment. This is calculated as the ratio between trading S&P 500 put options and S&P call options. A high put/call ratio can indicate fear in the markets, while a low ratio indicates confidence. For example, in 2015, the Put-Call ratio was as high as 3.77 because of market fears stemming from various global economic issues like a GDP growth slowdown in China and a Greek debt default.
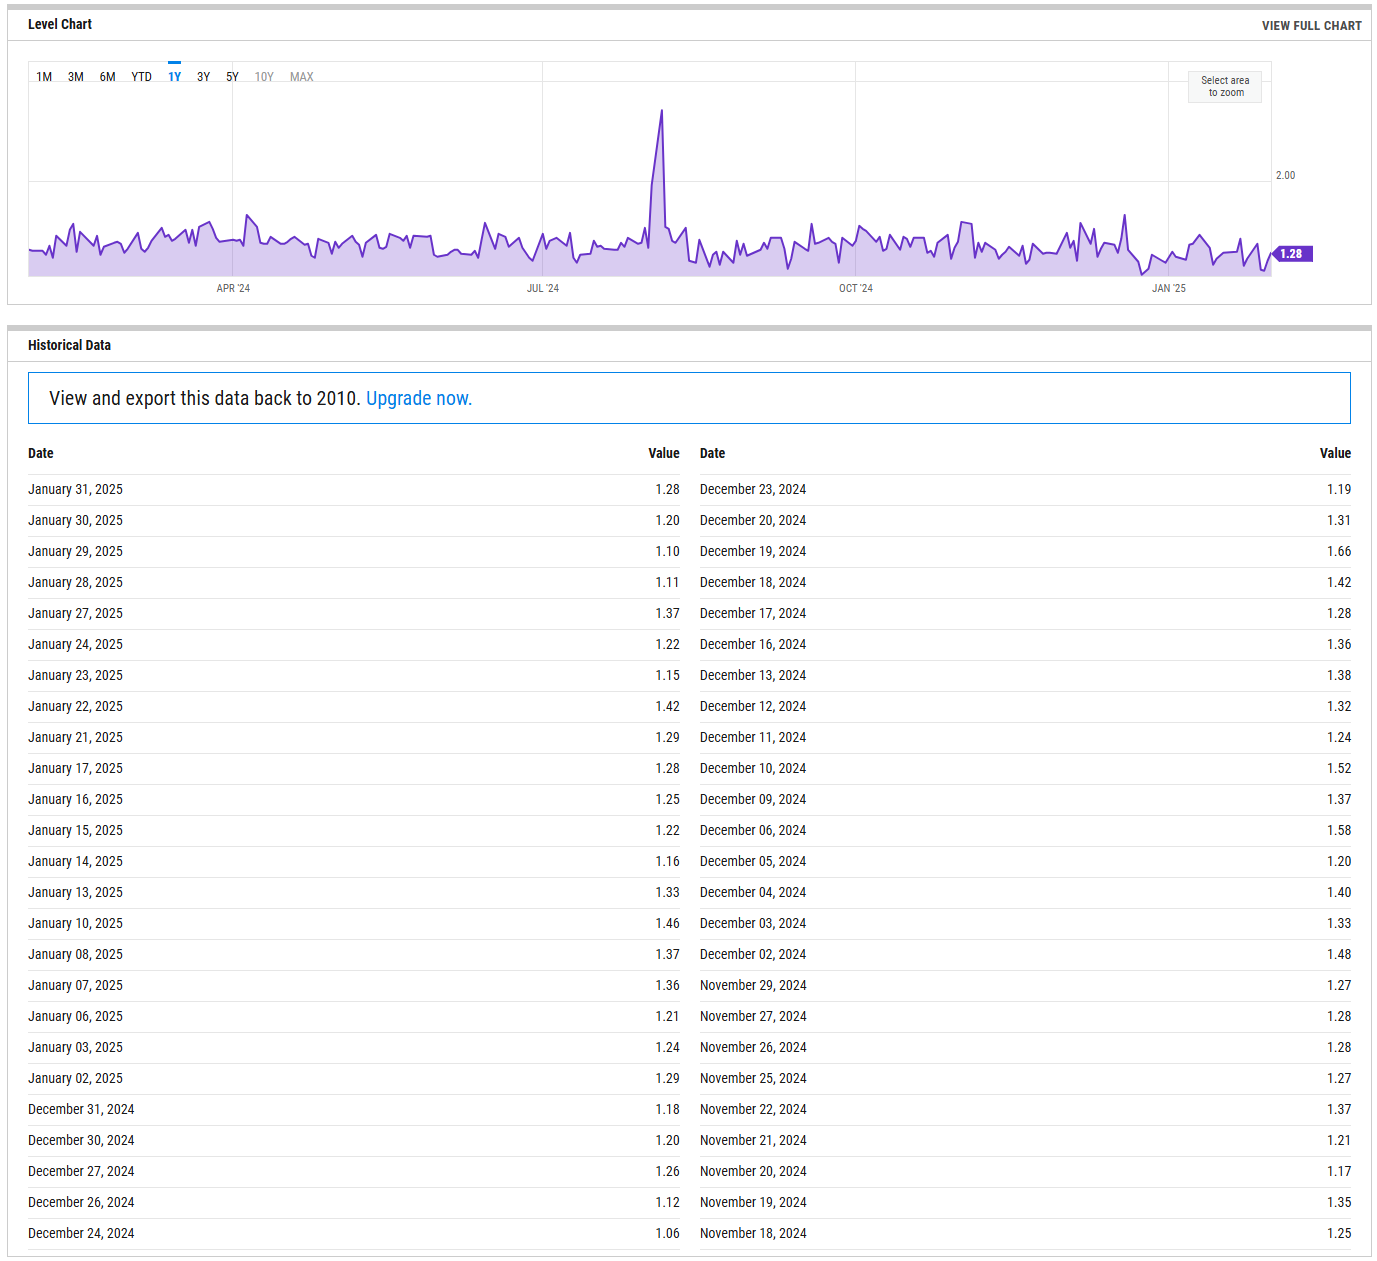
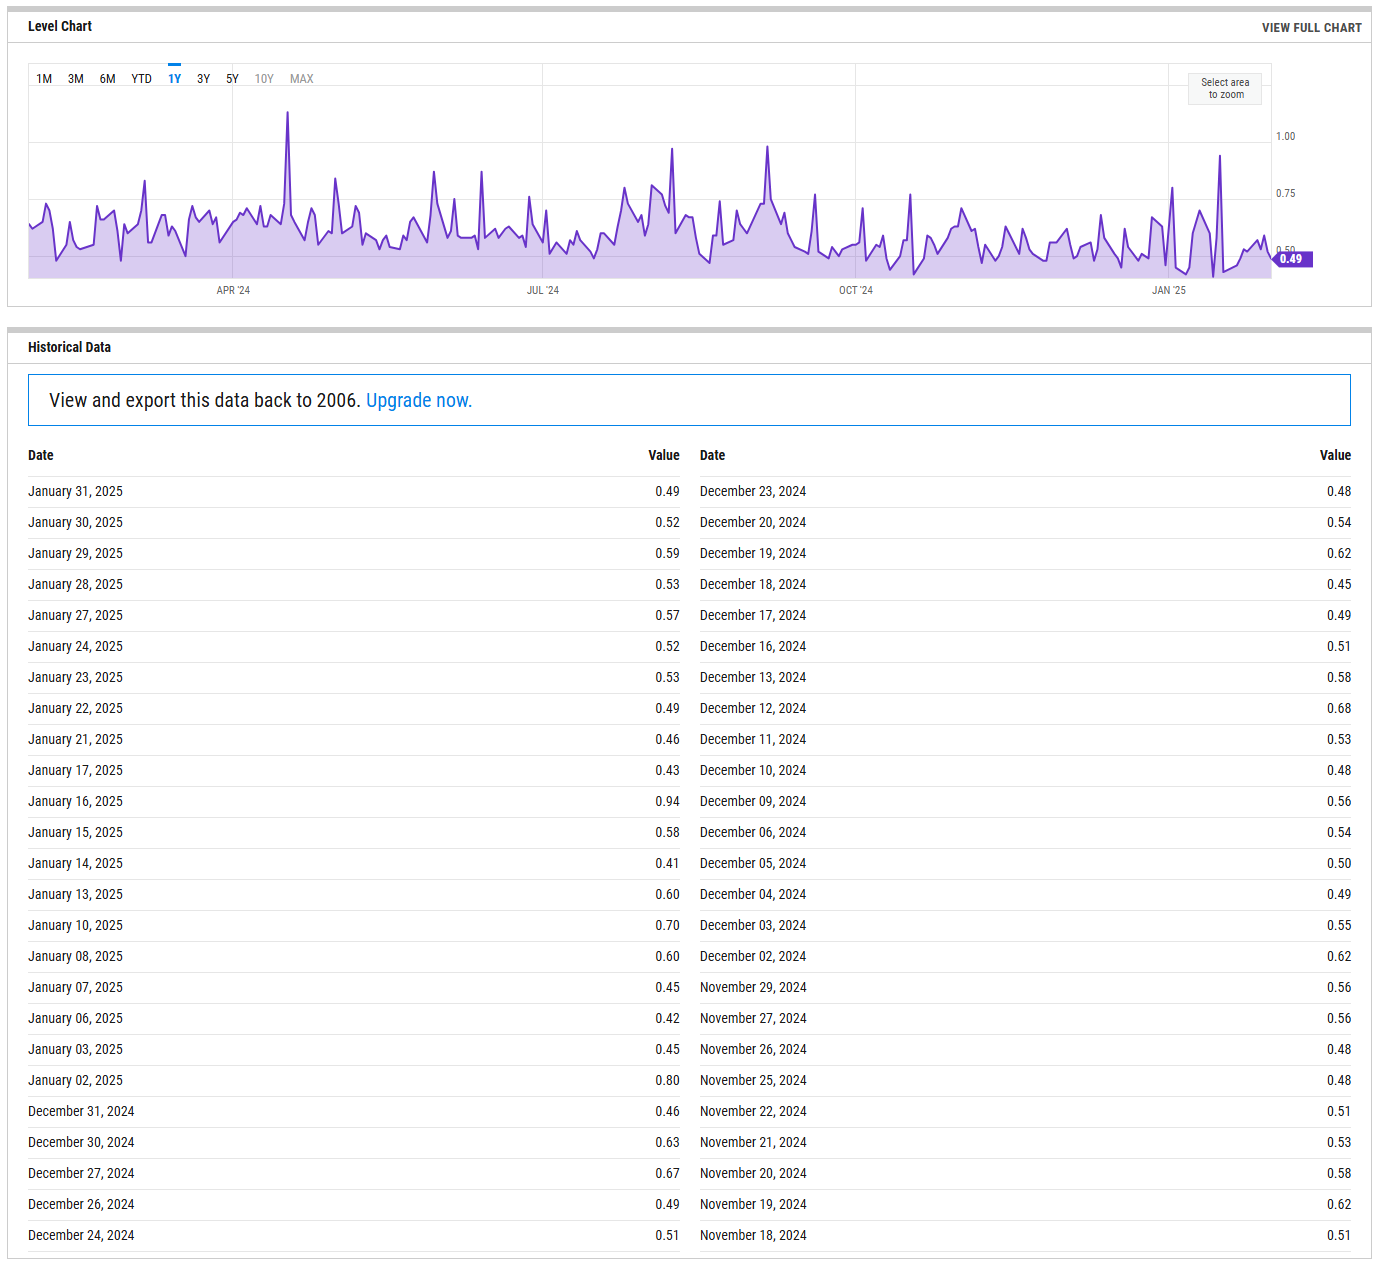
CBOE Equity Put/Call Ratio
The CBOE (Chicago Board Options Exchange) equity put/call ratio is a sentiment indicator used by traders and analysts to gauge market sentiment and potential shifts in investor behavior. It is calculated by dividing the volume of put options by the volume of call options on equities. Here’s what it reveals and how it is generally interpreted:
High Put/Call Ratio: When the put/call ratio is high (above 1.0), it suggests that there is more demand for put options than call options. This typically reflects a more bearish sentiment, as investors may be hedging against potential declines or expecting the market to fall.
Low Put/Call Ratio: Conversely, a low put/call ratio (below 0.7) indicates a higher volume of call options compared to puts, reflecting bullish sentiment. Investors may be expecting upward momentum and are positioning themselves to profit from price gains
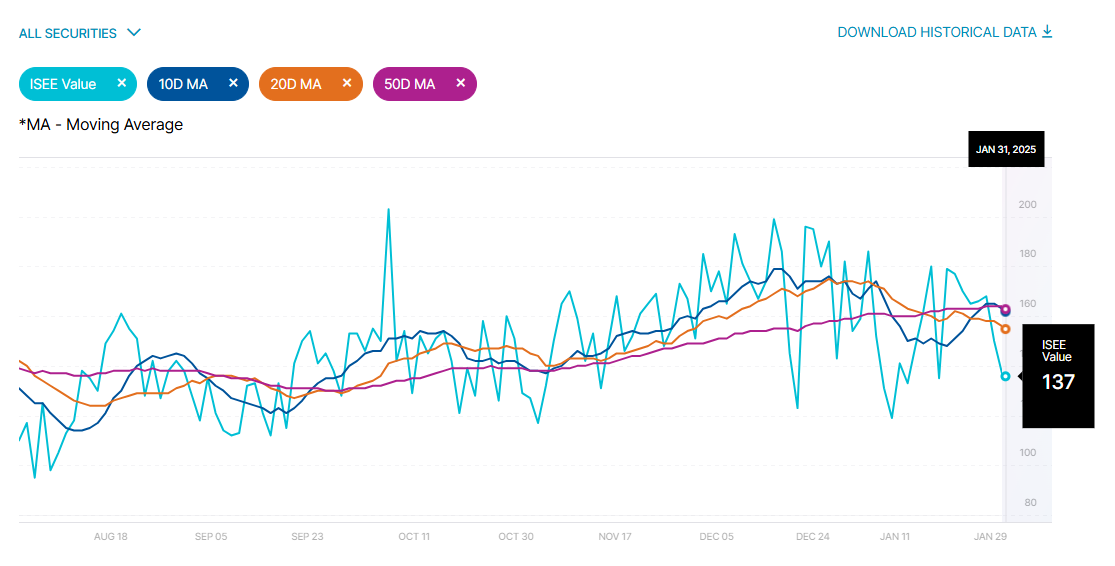
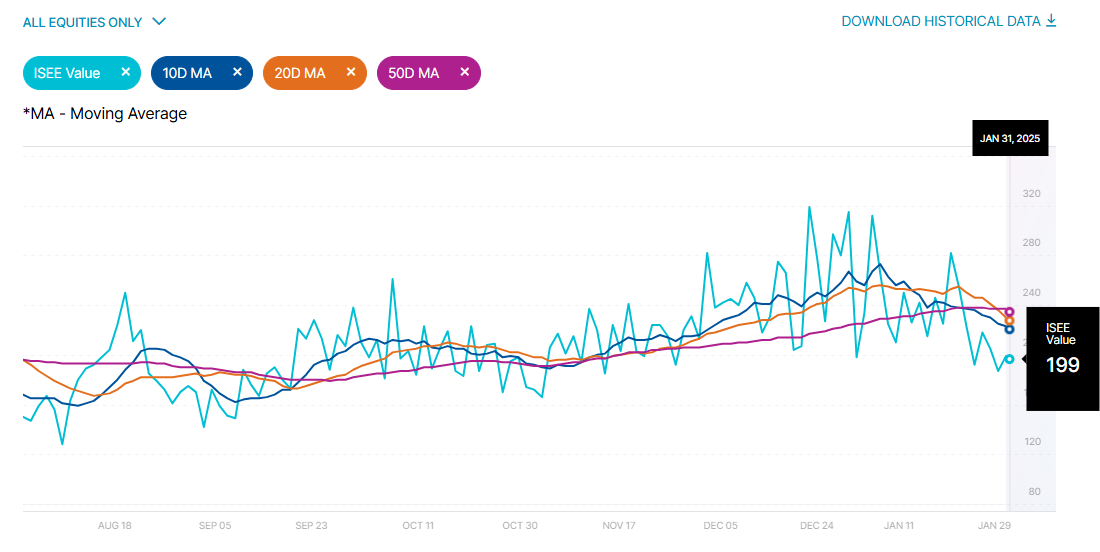
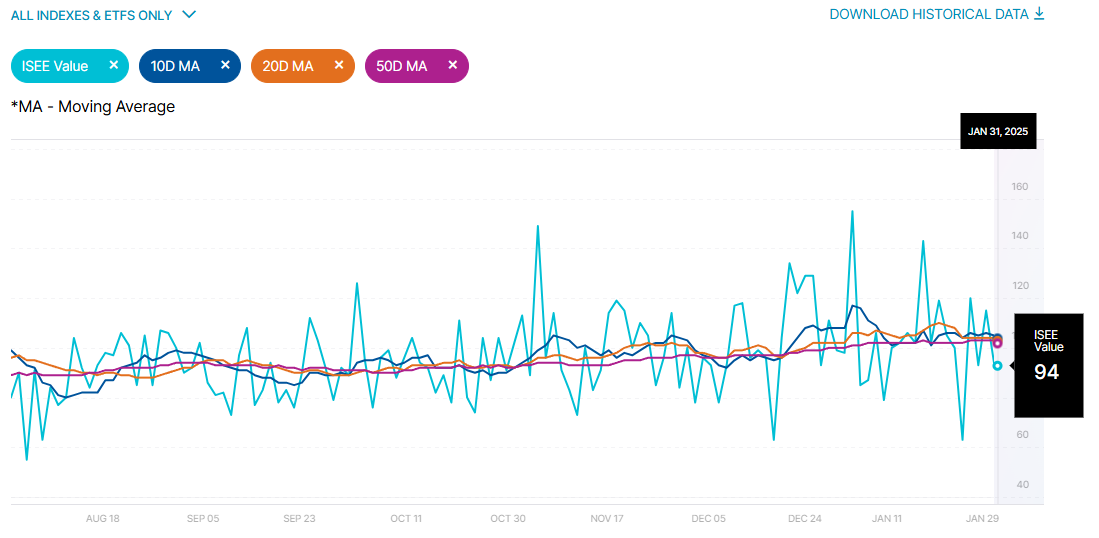
ISEE Sentiment Index
The ISEE (International Securities Exchange Sentiment) Index is a measure of investor sentiment derived from options trading. Unlike traditional put/call ratios, the ISEE Index focuses only on opening long customer transactions and is adjusted to remove market-maker and firm trades, providing a purer sentiment reading.
The ISEE Index typically ranges from 0 to 200, with readings above 100 indicating more call options being bought relative to put options, suggesting bullish sentiment. Conversely, readings below 100 suggest bearish sentiment, with more puts being purchased relative to calls.
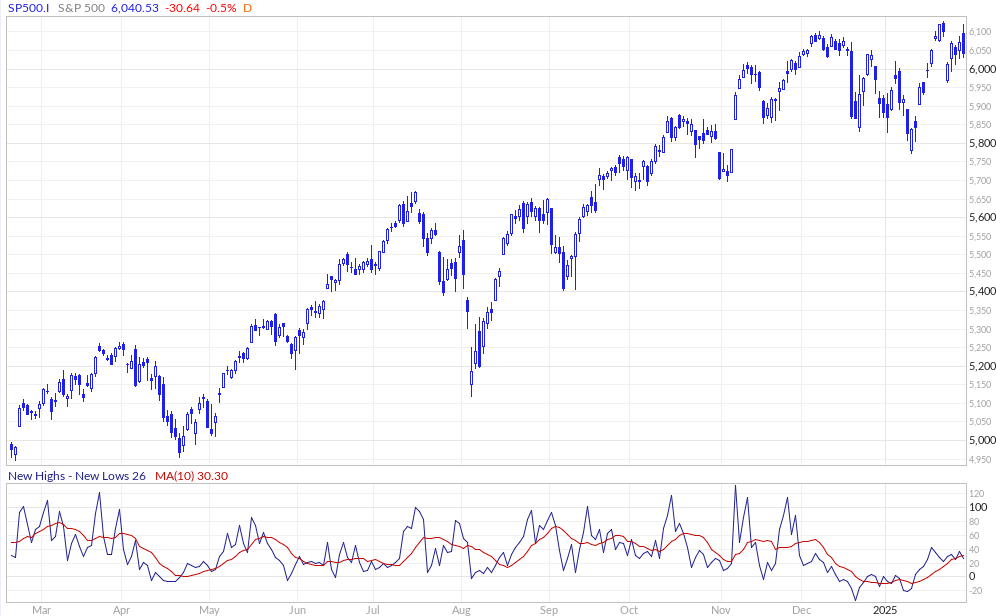
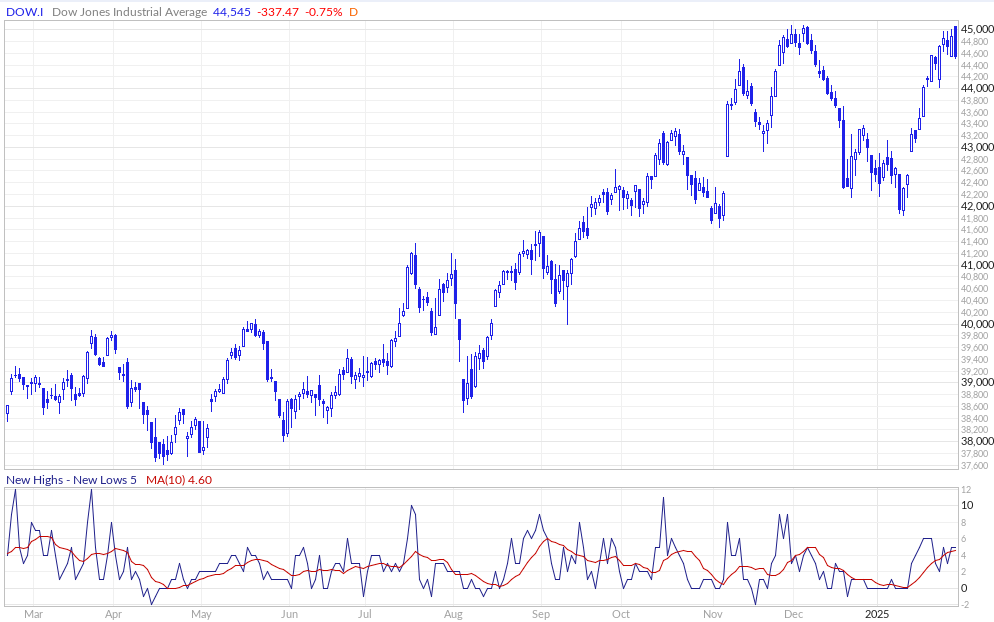
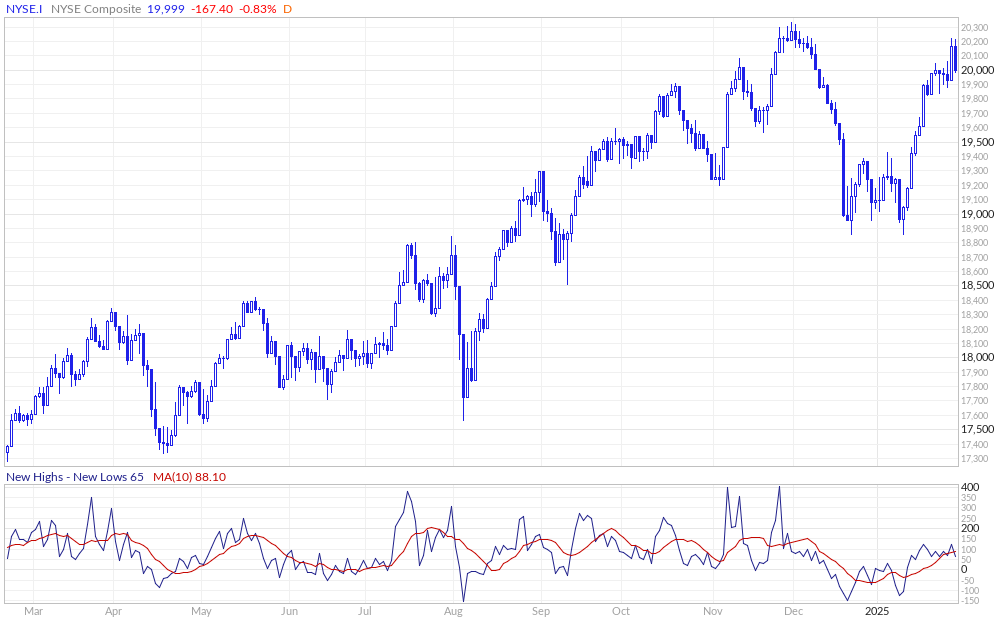
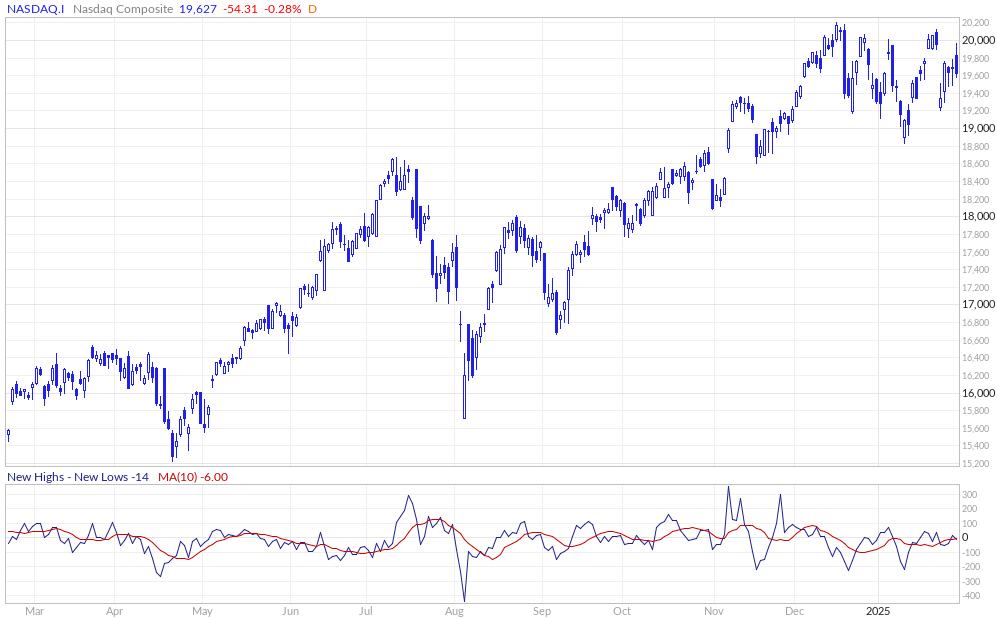
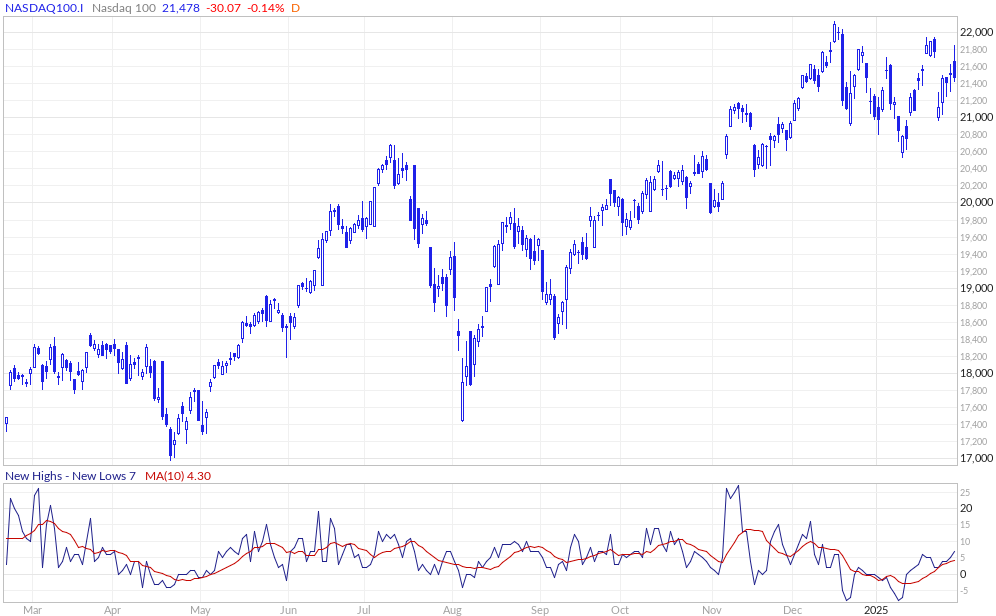
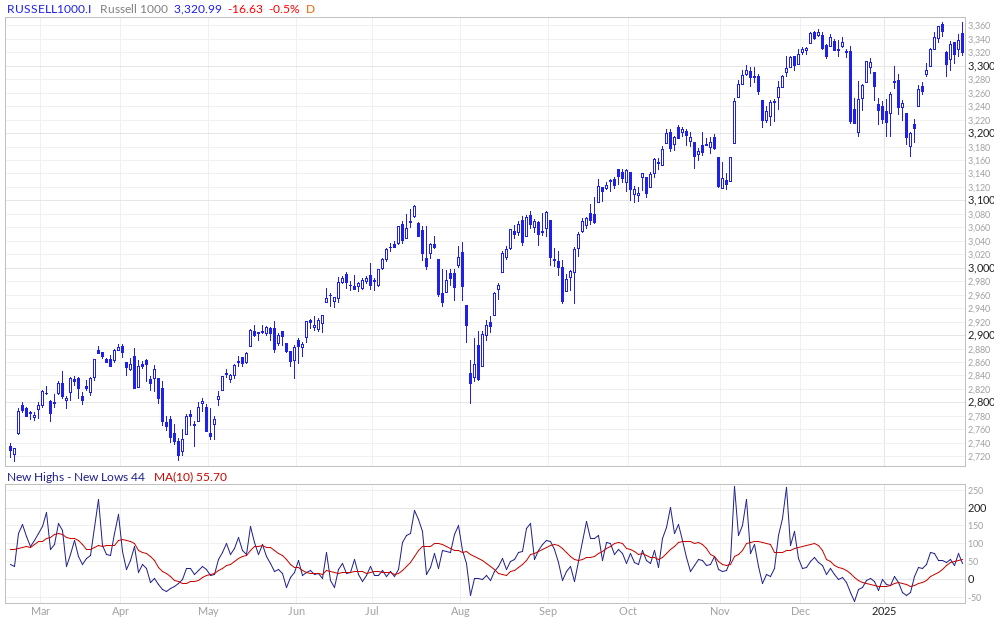
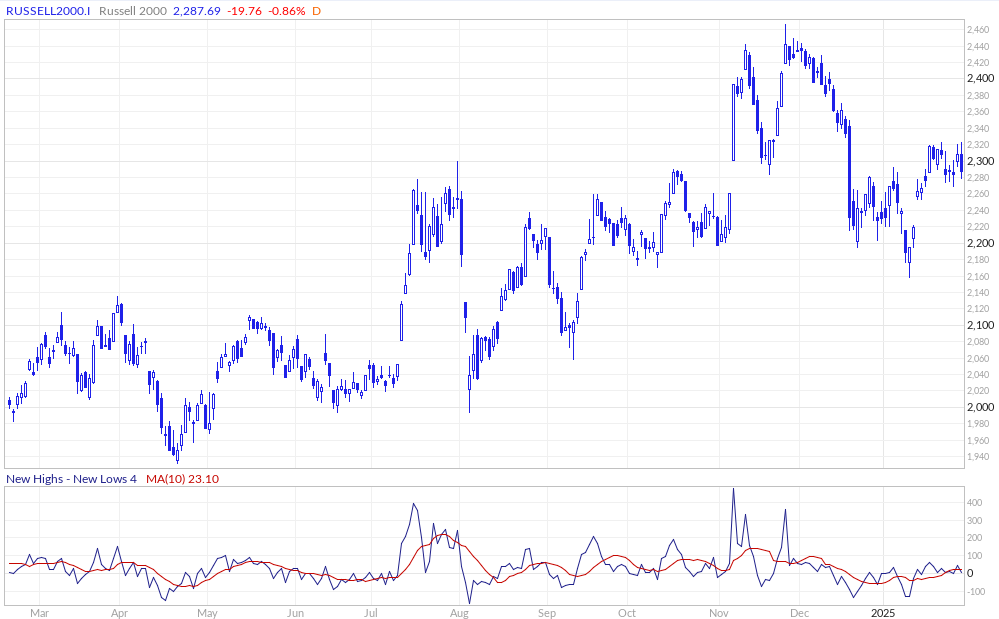
New Highs - New Lows
The New Highs - New Lows indicator (NH-NL) displays the daily difference between the number of stocks reaching new 52-week highs and the number of stocks reaching new 52-week lows. The NH-NL indicator generally reaches its extreme lows slightly before a major market bottom. As the market then turns up from the major bottom, the indicator jumps up rapidly. During this period, many new stocks are making new highs because it's easy to make a new high when prices have been depressed for a long time. The NH-NL indicator oscillates around zero. If the indicator is positive, the bulls are in control. If it is negative, the bears are in control. As the cycle matures, a divergence often occurs as fewer and fewer stocks are making new highs (the indicator falls), yet the market indices continue to reach new highs. This is a classic bearish divergence that indicates that the current upward trend is weak and may reverse.
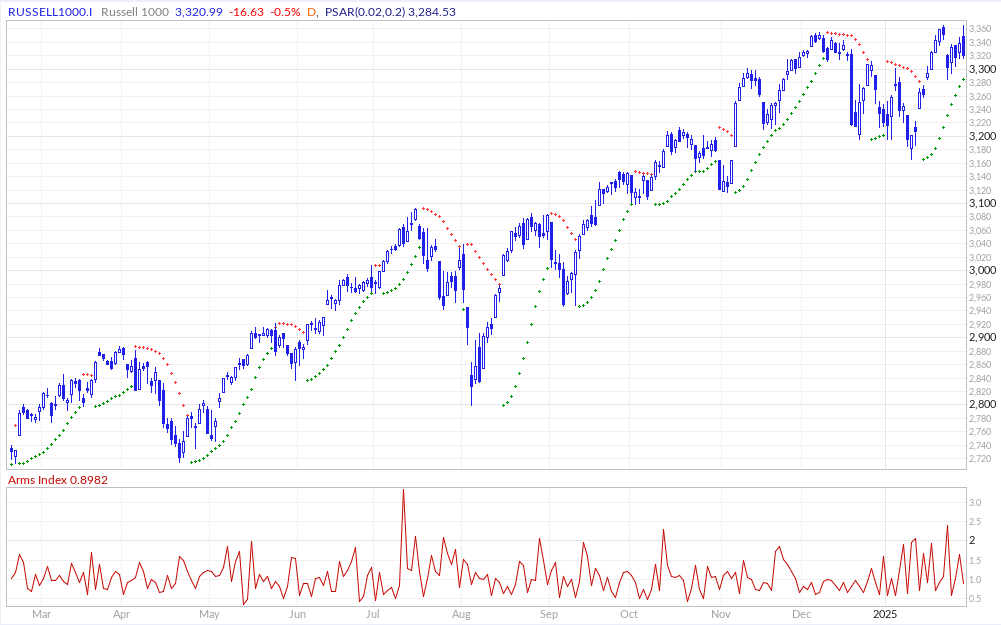
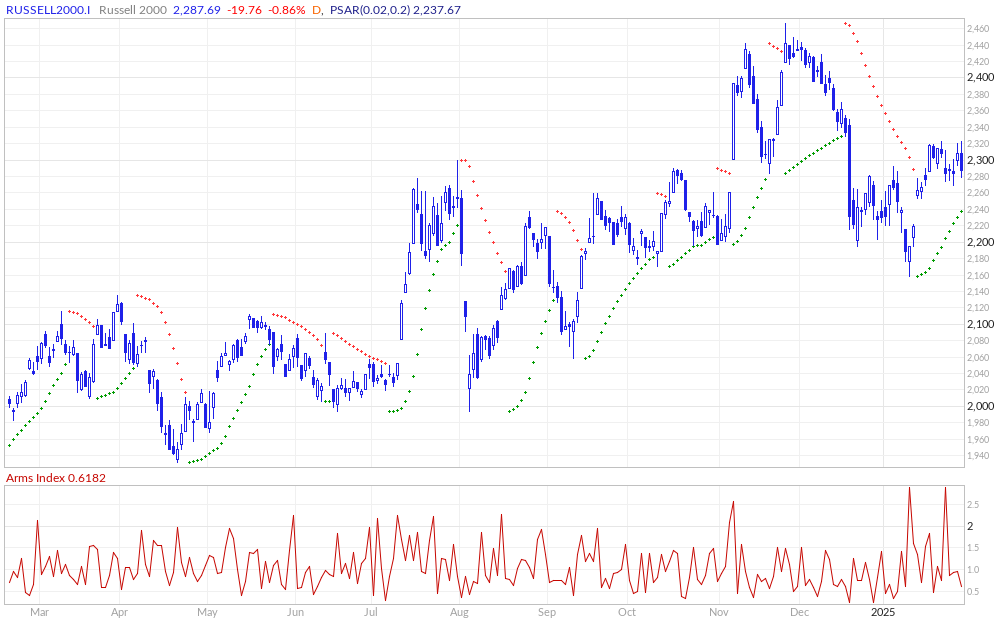
ARMS Index
The Arms Index, also known as the TRIN (Short-Term TRading INdex), was developed by Richard Arms in the 1960s. It is calculated by dividing the ratio of advancing stocks to declining stocks by the ratio of advancing volume to declining volume. Interpreting the Arms Index involves looking at its value in relation to certain thresholds. A value below "1" is considered bullish, indicating that advancing stocks and volume dominate the market. Conversely, a value above "1" is considered bearish, suggesting that declining stocks and volume are more prevalent. Extremely low values (below 0.5) or high values (above 2) are often seen as potential reversal signals.

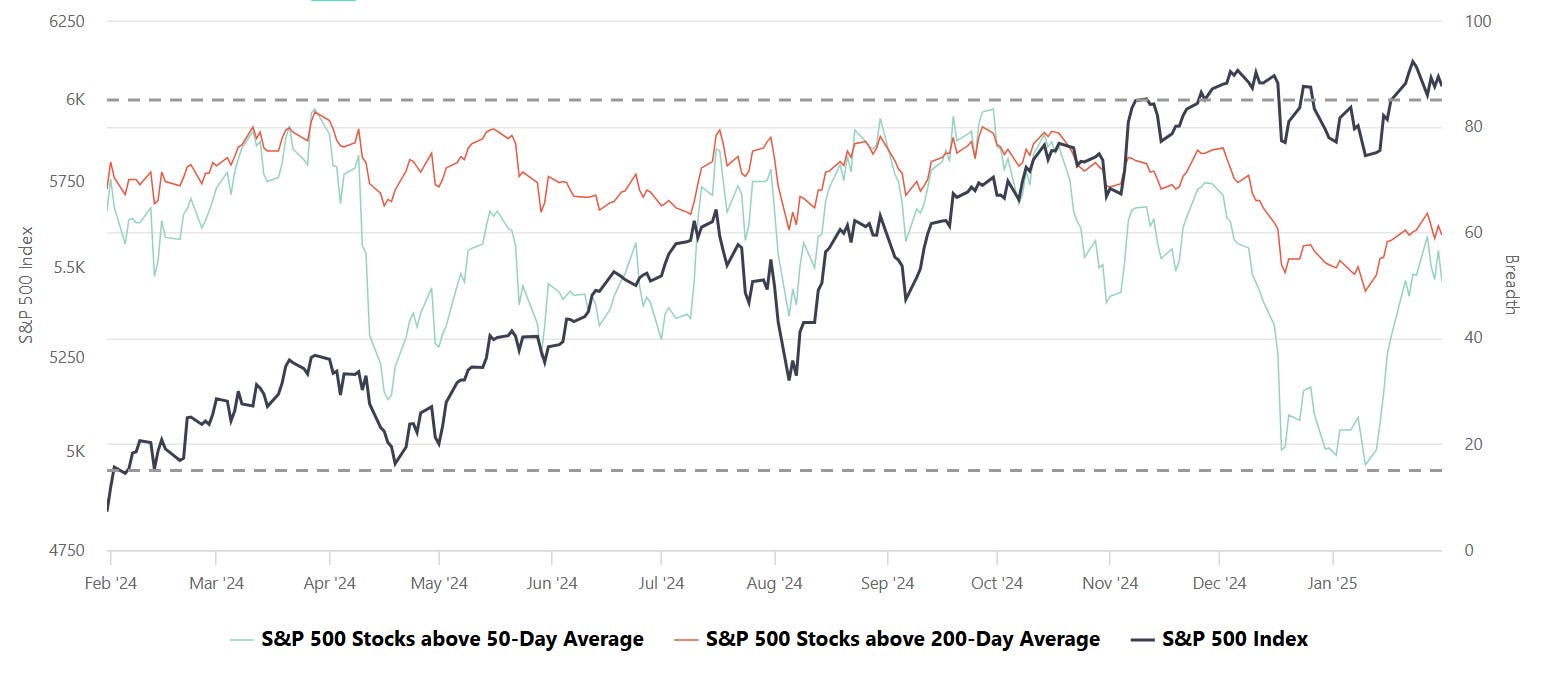
S&P Breadth
Breadth, in the context of stock market analysis, refers to the measure of how many stocks in a given index (such as the S&P 500) are participating in a trend, such as advancing or declining relative to a certain moving average (e.g., 50-day or 200-day).
Market Strength Assessment:
Breadth provides insight into whether a market rally or decline is broad-based or driven by only a few large-cap stocks. A rally supported by a high percentage of stocks above their 50-day or 200-day averages is generally considered healthier and more sustainable.
Early Warning Signals:
Divergences between breadth indicators and the index price can signal potential reversals. For example:
If the index is rising, but the number of stocks above their moving averages is declining, it may indicate weakening underlying strength and potential for a pullback.
Conversely, if breadth improves while the index remains flat or declines, it may suggest accumulating strength for a future rally.
Trend Confirmation:
Breadth indicators can confirm trends. For instance, a strong majority of stocks above their moving averages signals robust market momentum, providing confidence in the prevailing trend.
Identifying Overbought or Oversold Conditions:
Extremely high or low breadth readings can signal overbought or oversold conditions, which might lead to mean reversion. For example:
If nearly all stocks are above their 50-day or 200-day averages, it may suggest overbought conditions.
Conversely, extremely low levels indicate oversold conditions and potential for a bounce.
Breadth and Timing Investments:
Entry Points:
When breadth improves (e.g., more stocks move above their 50-day or 200-day moving averages) after a market pullback, it can indicate a good time to start building positions as the broader market is regaining strength.
Exit Points:
Breadth deterioration during a rally may suggest it’s time to reduce exposure, especially if only a small number of stocks are driving index gains. This is often a warning sign of an impending correction.
Volatility and Risk Management:
Weak breadth in volatile markets may prompt caution or defensive positioning. Conversely, improving breadth can justify taking on more risk during uptrends.
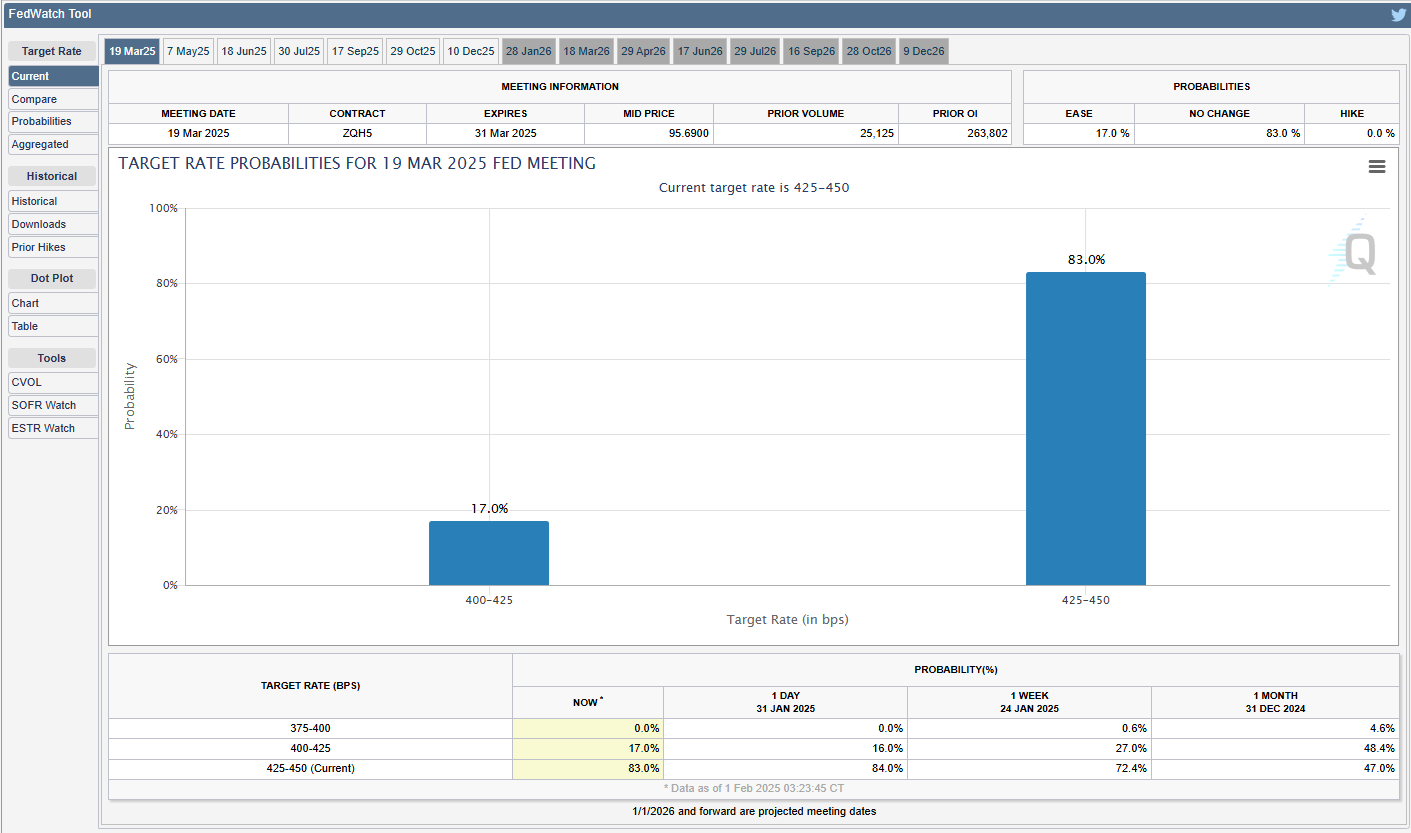
CME Fedwatch
What is the likelihood that the Fed will change the Federal target rate at upcoming FOMC meetings, according to interest rate traders? Use CME FedWatch to track the probabilities of changes to the Fed rate, as implied by 30-Day Fed Funds futures prices.
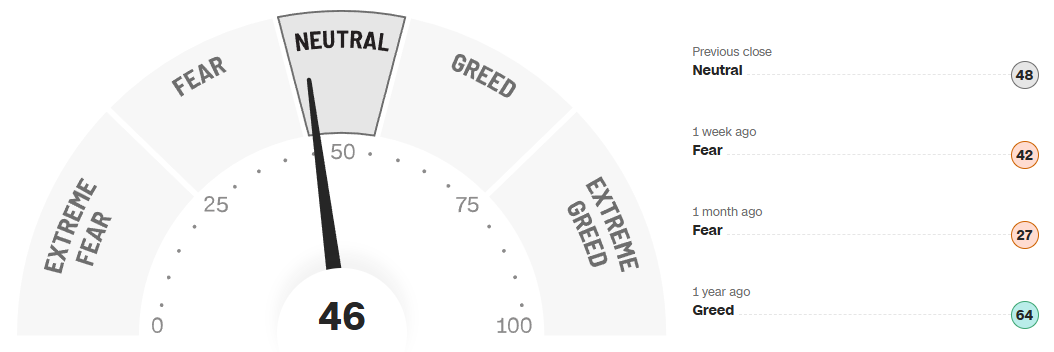
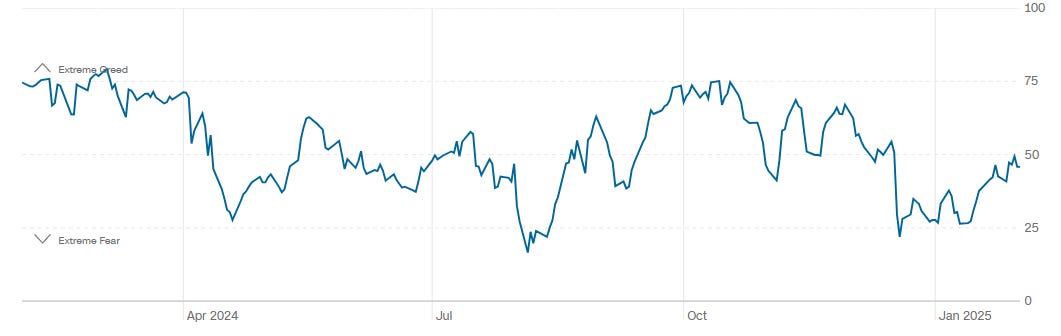
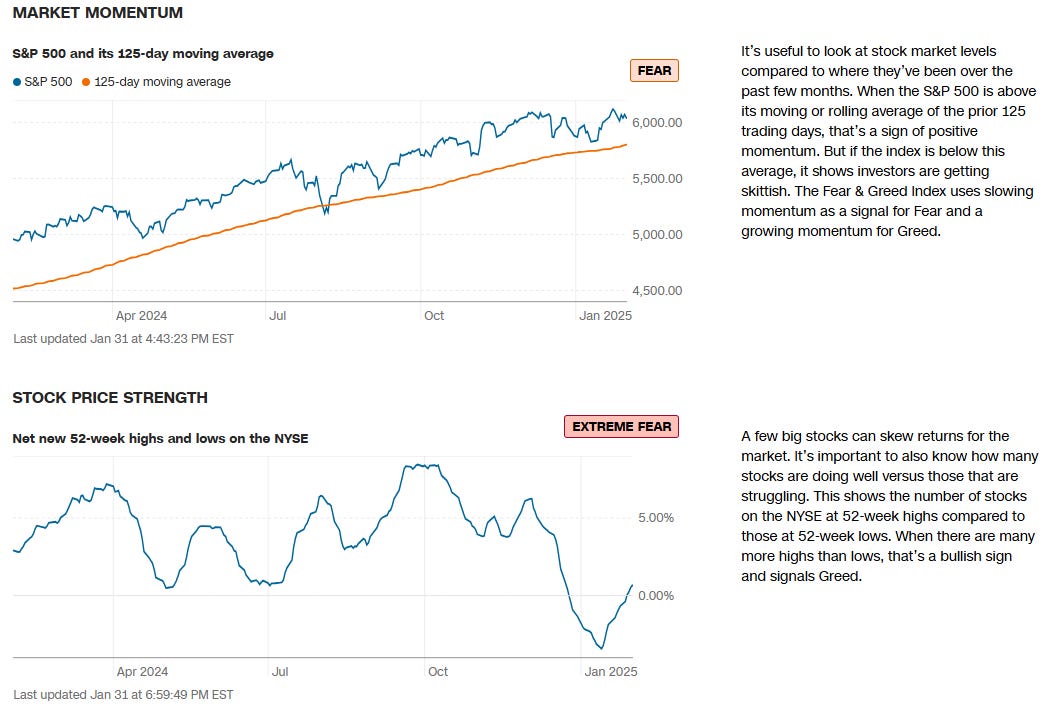
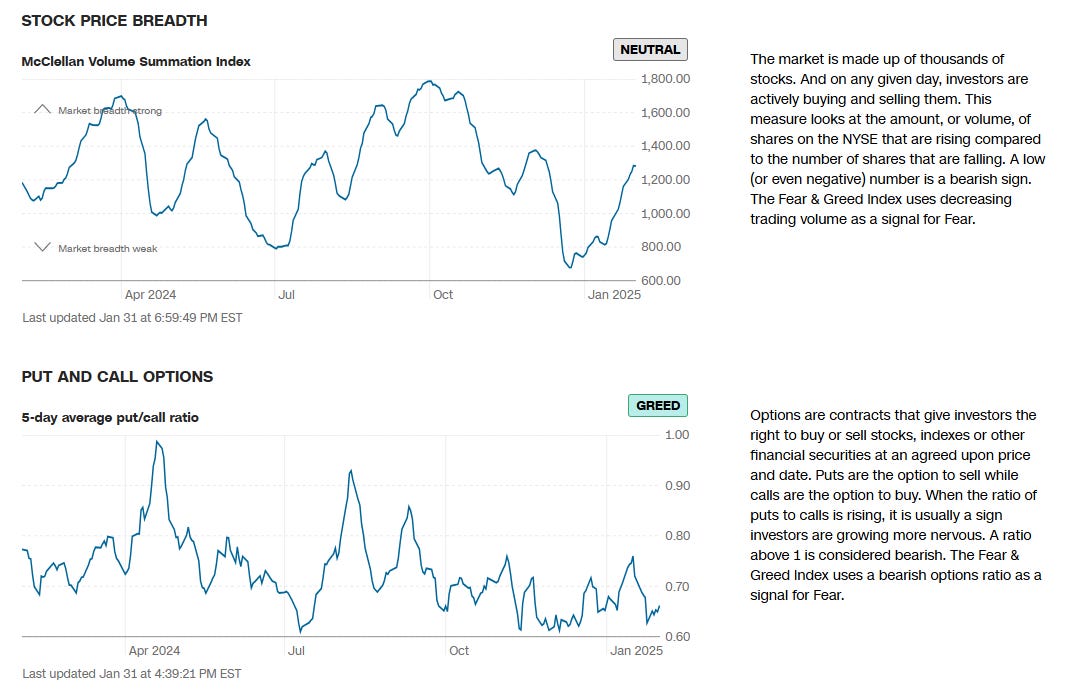
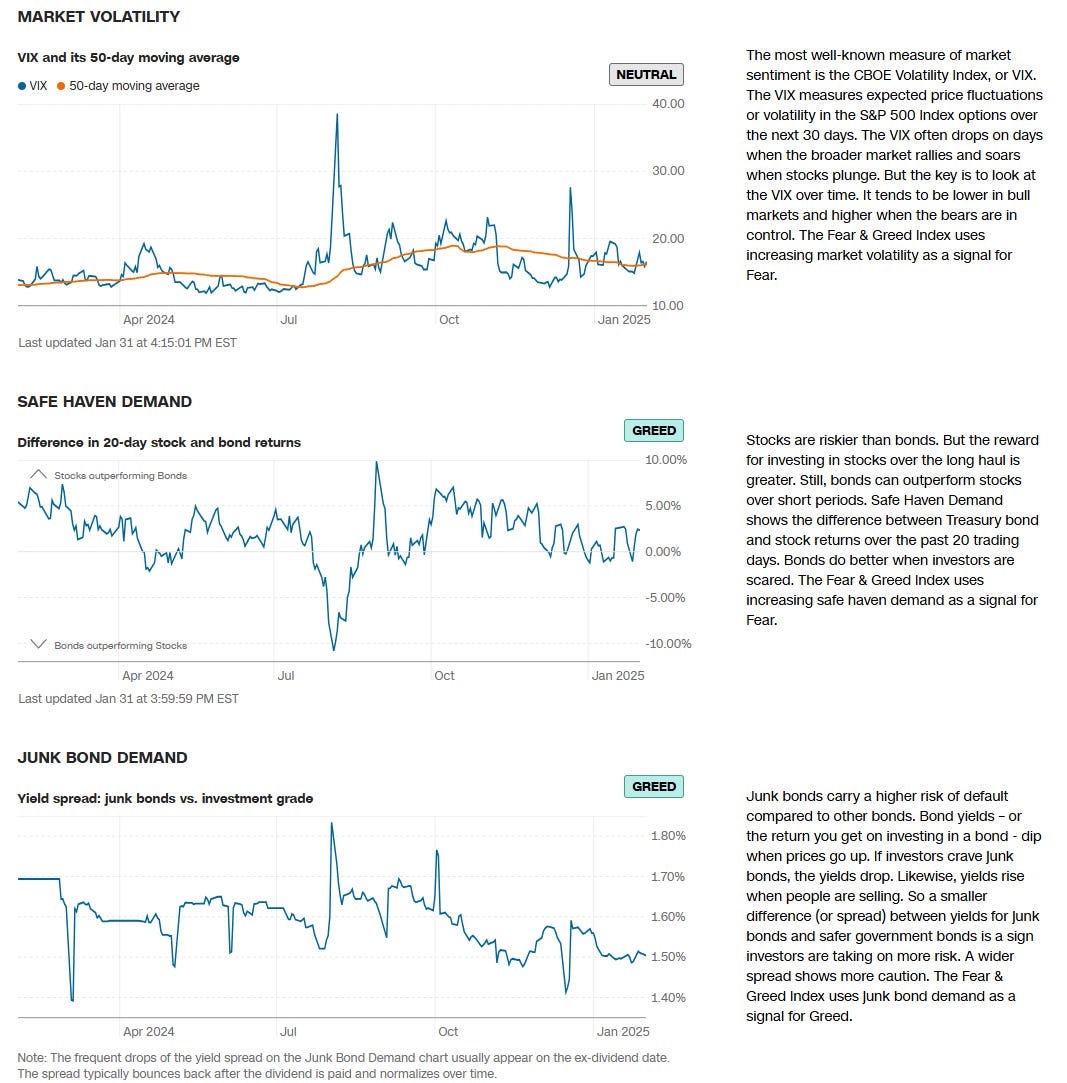
CNN Fear & Greed Constituent Data Points & Composite Index
Institutional S/R Levels for Major Indices
When you’re a large institutional player, your primary goal is to find liquidity - places to do a ton of business with the least amount of slippage possible. VolumeLeaders.com automatically identifies and visually plots the exact spots where institutions are doing business and where they are likely to return for more. It’s one of the primary reasons “support” and “resistance” concepts work and truly one of the reasons “price has memory”.
Levels from the VolumeLeaders.com platform can help you formulate trades theses about:
Where to add or take profit
Where to de-risk or hedge
What strikes to target for options
Where to expect support or resistance
And this is just a small sample; there are countless ways to leverage this information into trades that express your views on the market. The platform covers thousands of tickers on multiple timeframes to accommodate all types of traders. Observe for yourself how accurate the levels are by marking-up your charts with the information in the “Trade Levels” boxes and play-along in real-time this week.
SPY -0.32%↓
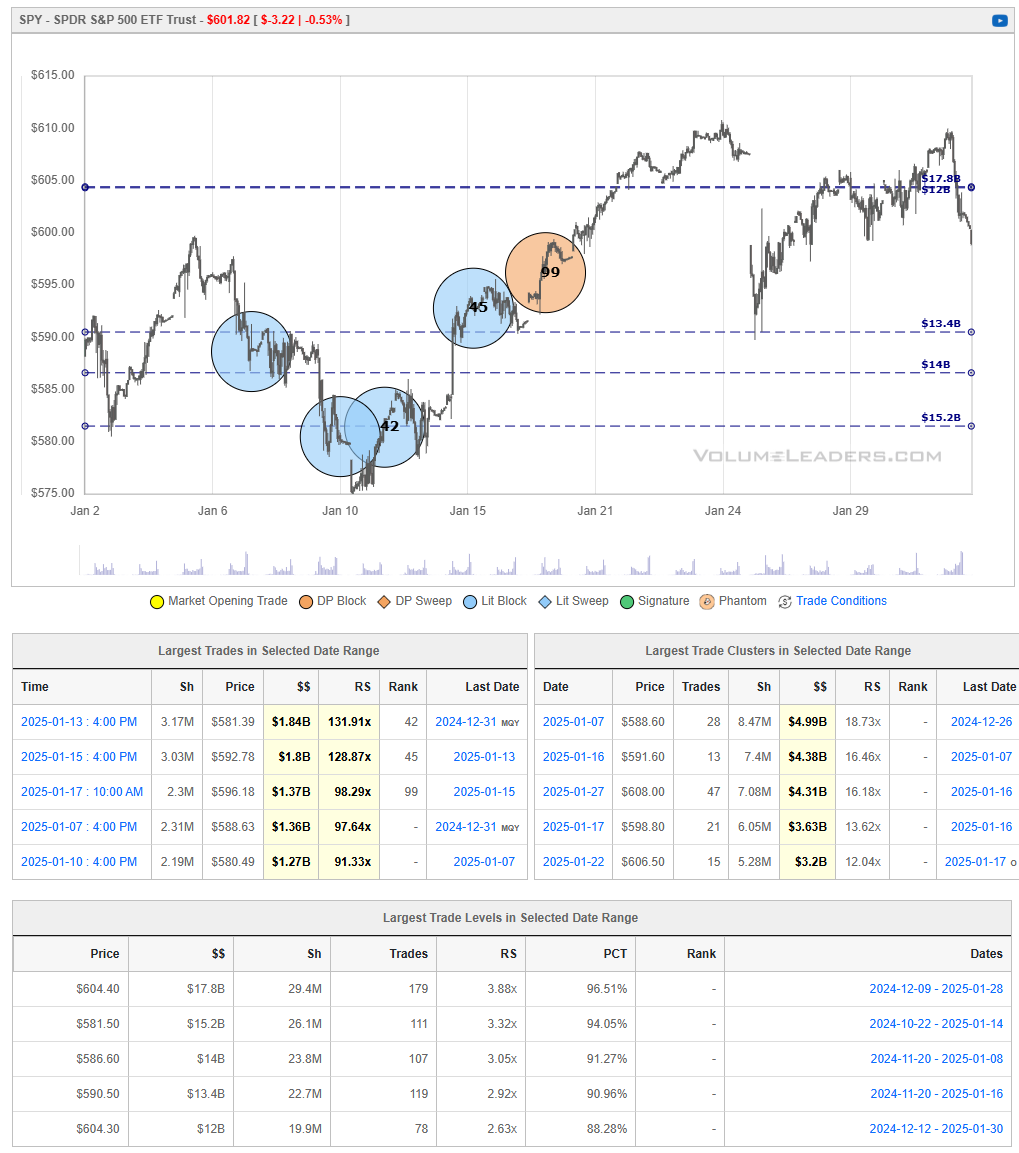
SPY surged from the mid‐$580s up to around $610 before encountering significant selling pressure at those higher levels. The recent pullback has brought price back toward the $600 area, where large‐volume trades may act as interim support. If buyers can defend $600–$595 and spark a rebound, SPY could make another run at the $605–$610 resistance band. However, a failure to hold above $595 raises the risk of a deeper retracement toward prior support near $590 or lower. Overall, the ETF sits in a pivotal zone, with its ability to reclaim lost ground or break down further likely to set the tone for the near‐term trend.
QQQ -0.21%↓
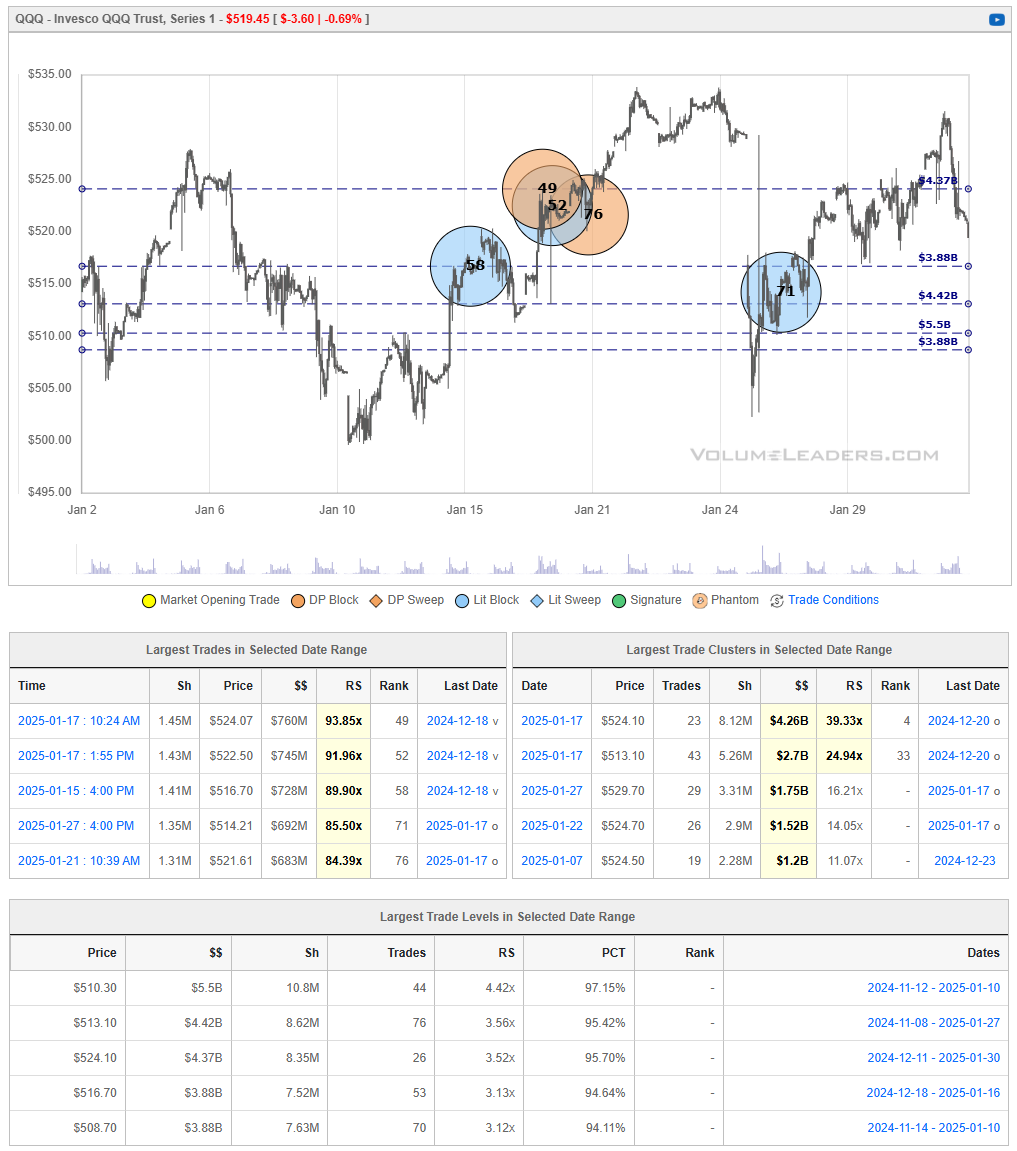
QQQ rallied from the low $500s up to around $535 in late January but has since pulled back to the $515–$520 region. This zone marks an important near‐term pivot, as prior institutional trades suggest potential support here. If buyers defend $515 and push price back above $525–$530, QQQ could re‐engage its uptrend and make another run at recent highs. However, failure to hold above $515 increases the likelihood of a deeper pullback toward $510 or even the January lows near $500.
IWM -0.36%↓

IWM’s January rebound stalled just shy of $230–$231, where substantial supply appears to have capped further gains. The ETF is now retreating toward the $224–$225 region—an area with notable institutional activity that may offer near‐term support. If buyers successfully defend that zone and push price back above $228, IWM could re‐challenge the recent highs. Otherwise, a decisive break below $224 raises the prospect of a deeper pullback into the lower‐$220s.
DIA 0.00%↑
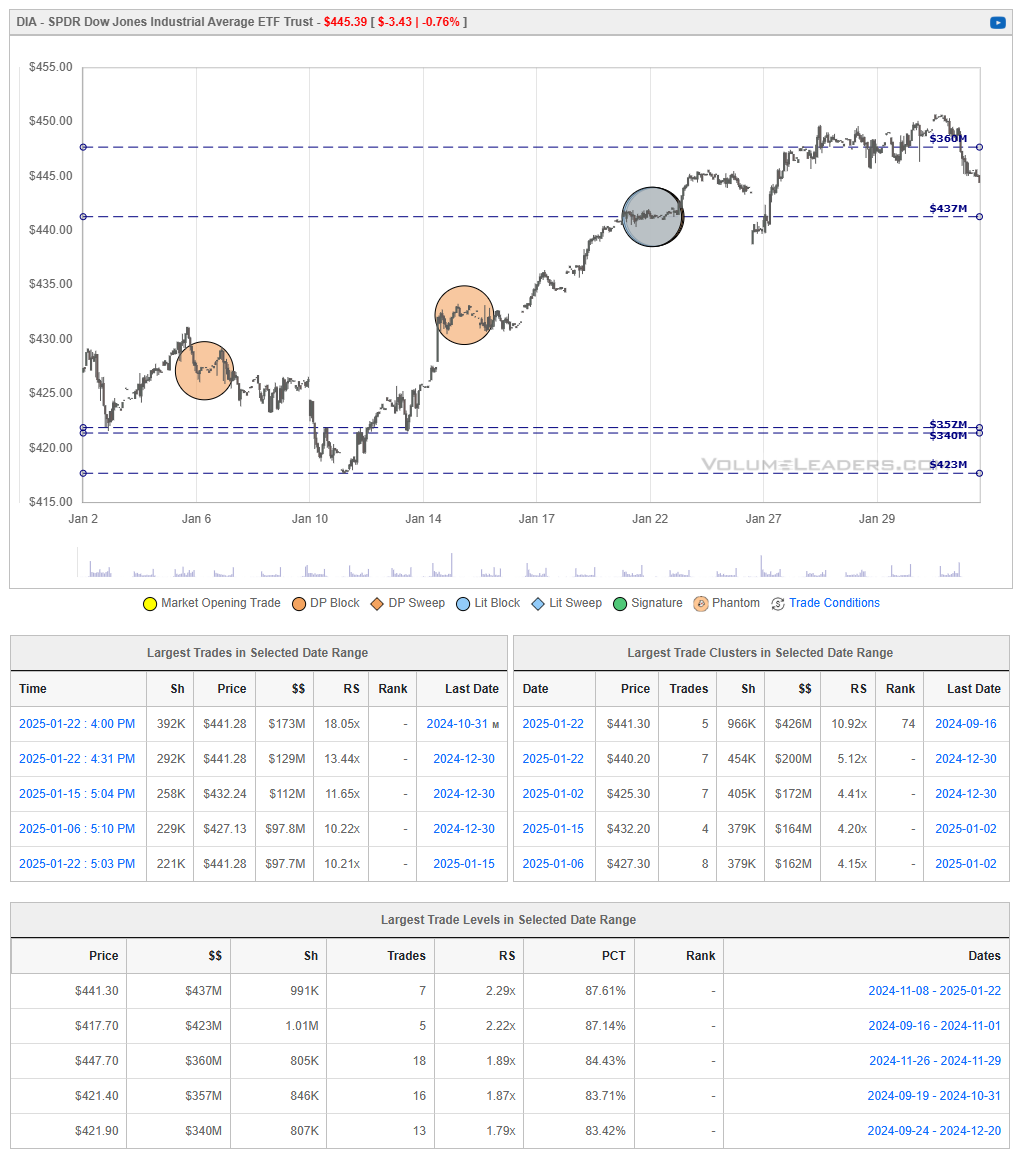
DIA surged off the January lows near $415, topping out in the mid‐$450s before retreating to the $445 area. This pullback has it testing a band of prior support and resistance in the $442–$445 zone, where institutional trading may provide some stability. If buyers step in and drive price back above $448–$450, the uptrend could resume, targeting the recent highs near $455. Conversely, failure to hold $442 opens the door to a deeper retracement, with the next notable support around $435–$437.
Institutional Order Flow
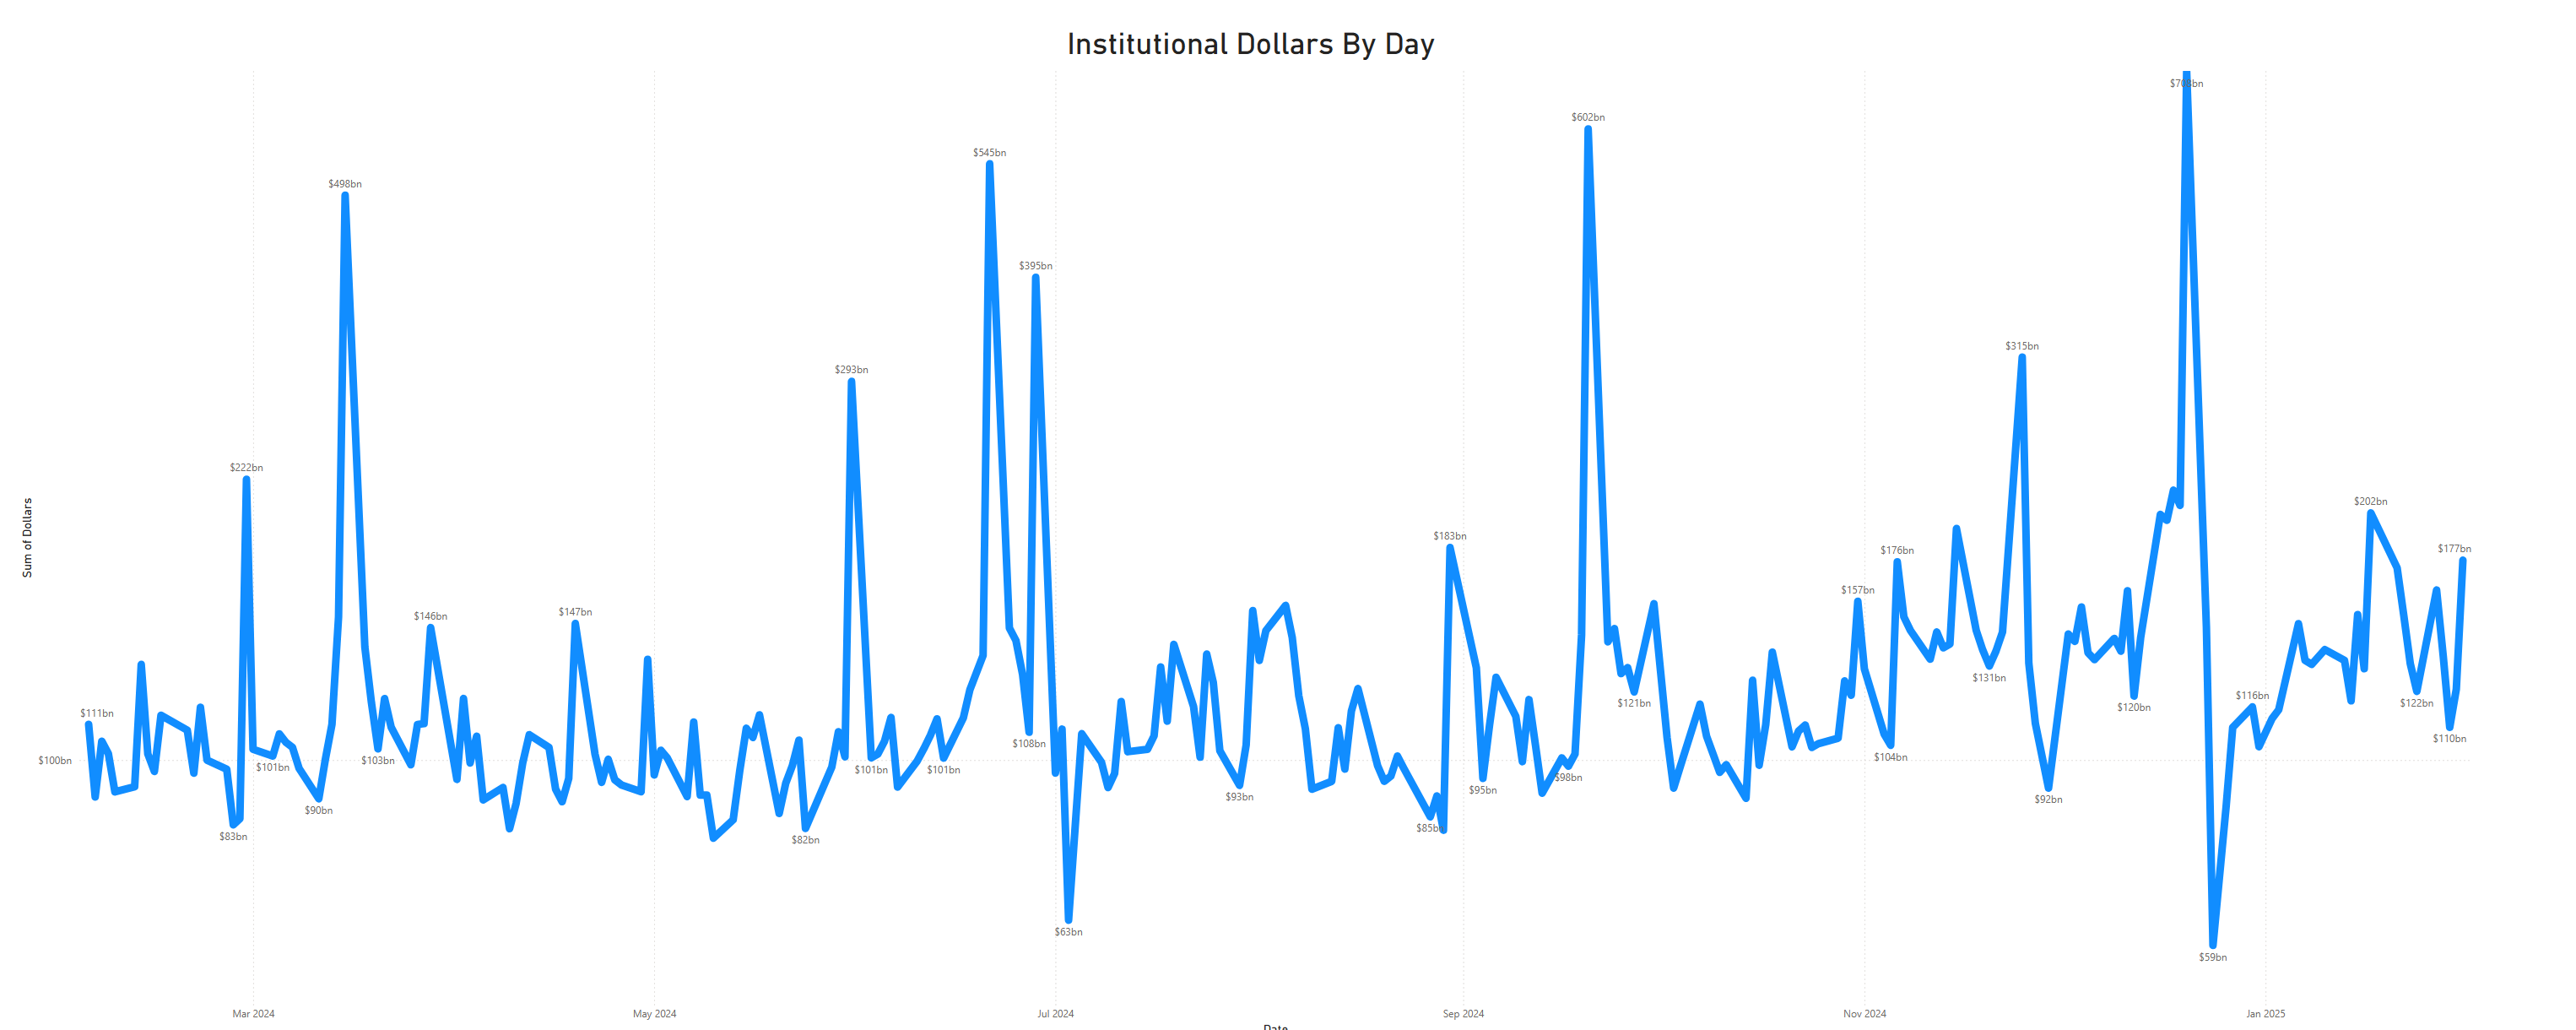
Rolling 1-Yr Dollars By Day
This chart shows institutional activity by dollars by day on a rolling 1-year basis. From a theoretical standpoint, examining a chart of daily institutional dollar activity over the course of a year can offer several insights and possible inferences, though all should be approached with caution since the data alone may not prove causality or confirm underlying reasons. Some potential takeaways include:
Event-Driven Behavior:
Sharp, singular spikes on certain days might correlate with major market-moving events. These could include central bank policy announcements, significant geopolitical news, sudden macroeconomic data releases (like employment reports or GDP data), earnings seasons for large-cap companies, or unexpected shocks (e.g., mergers, acquisitions, regulatory changes).Liquidity Dynamics:
Institutions often concentrate large trades on days with higher expected liquidity. For instance, heightened activity might coincide with index reconstitutions, option expiration dates, or the days leading up to or following a major index rebalance, when large amounts of capital shift hands simultaneously.Risk Management and Hedging Activity:
Institutions may significantly adjust their exposures on days that are critical from a risk management perspective. Large spikes can occur if hedge funds, pension funds, or asset managers are rolling over futures contracts, initiating or closing out large hedges, or reacting to volatility triggers.Market Sentiment Indicators:
While the data is purely transactional, the sheer volume of institutional involvement on certain days might indirectly hint at changing sentiment or strategic shifts.
In essence, a chart like this can lead you to hypothesize that institutional trading volumes are not constant or random but rather influenced by a mix of predictable calendar effects, major market events, liquidity considerations, risk management decisions, and strategic allocation shifts.
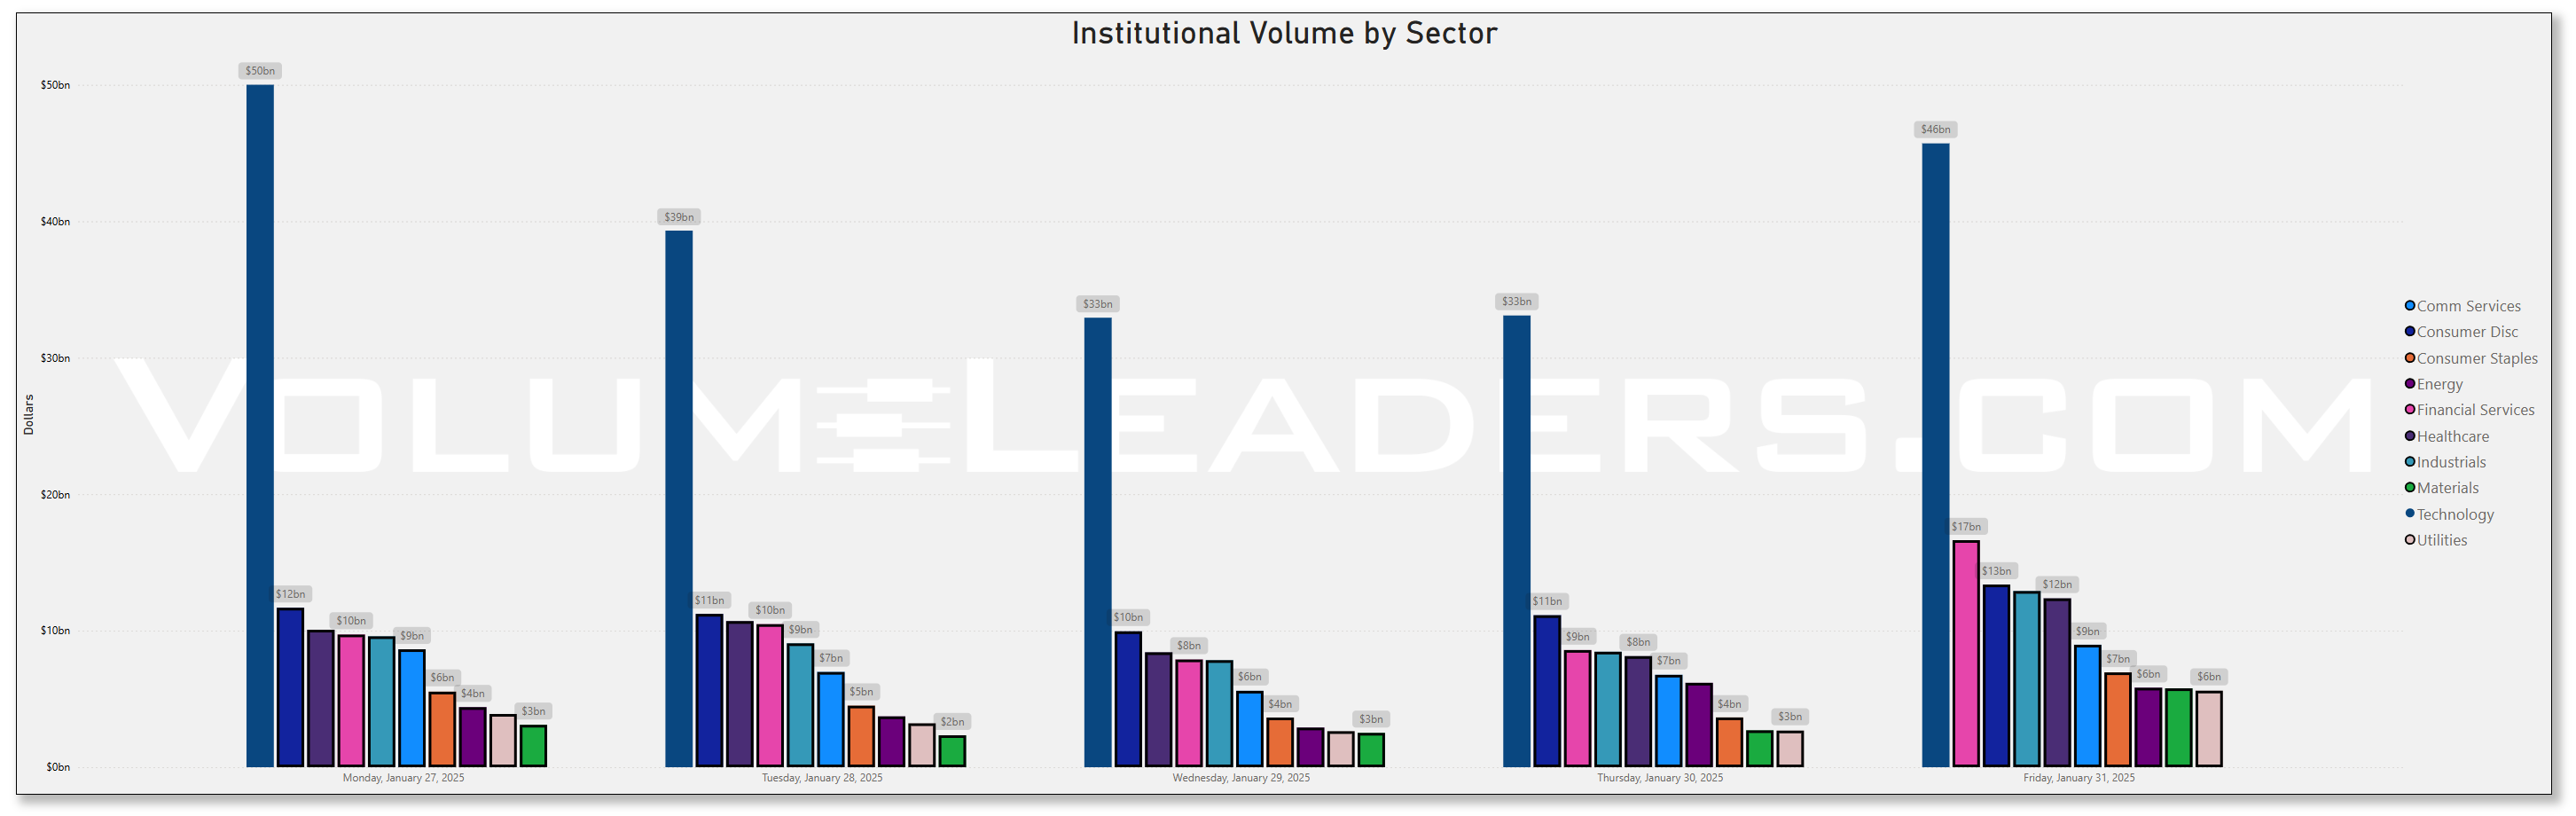
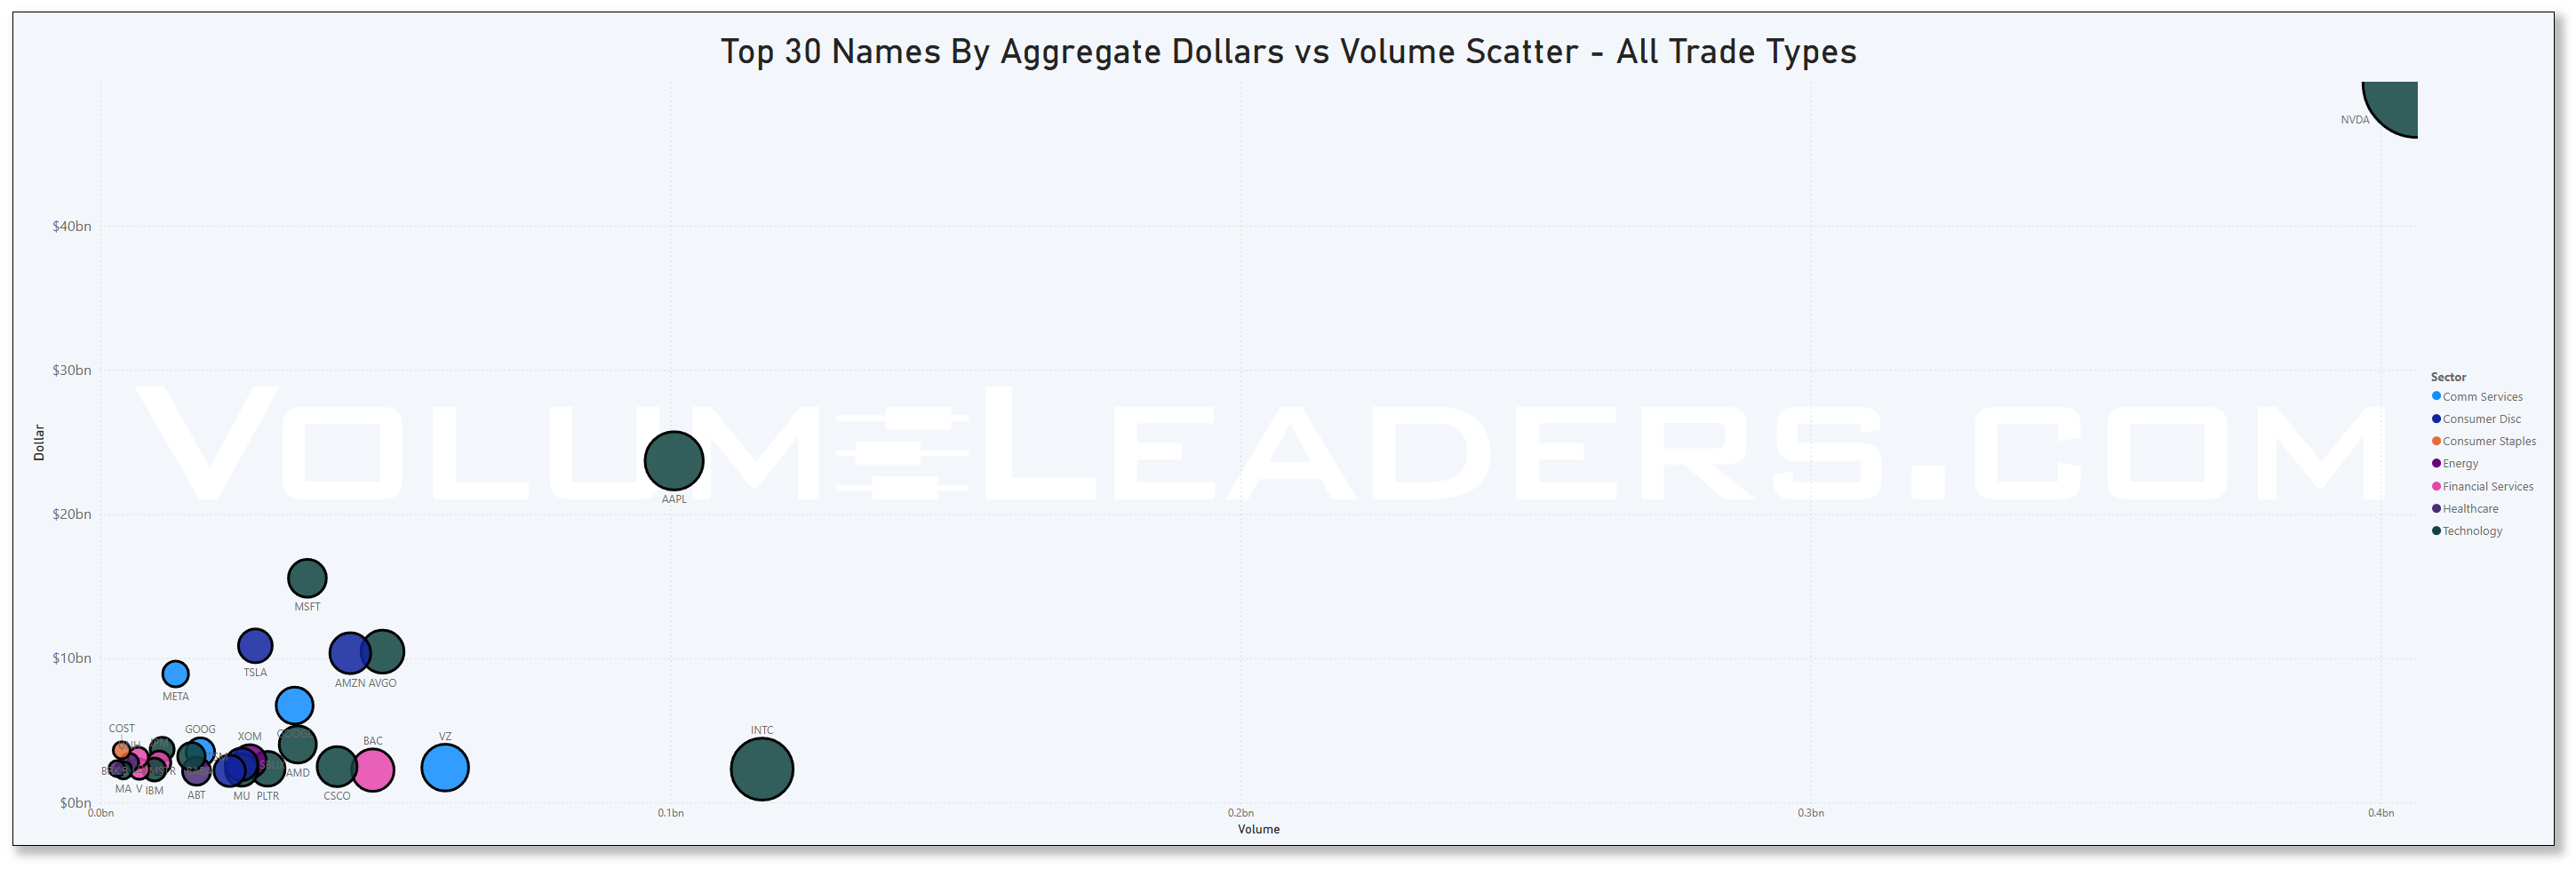
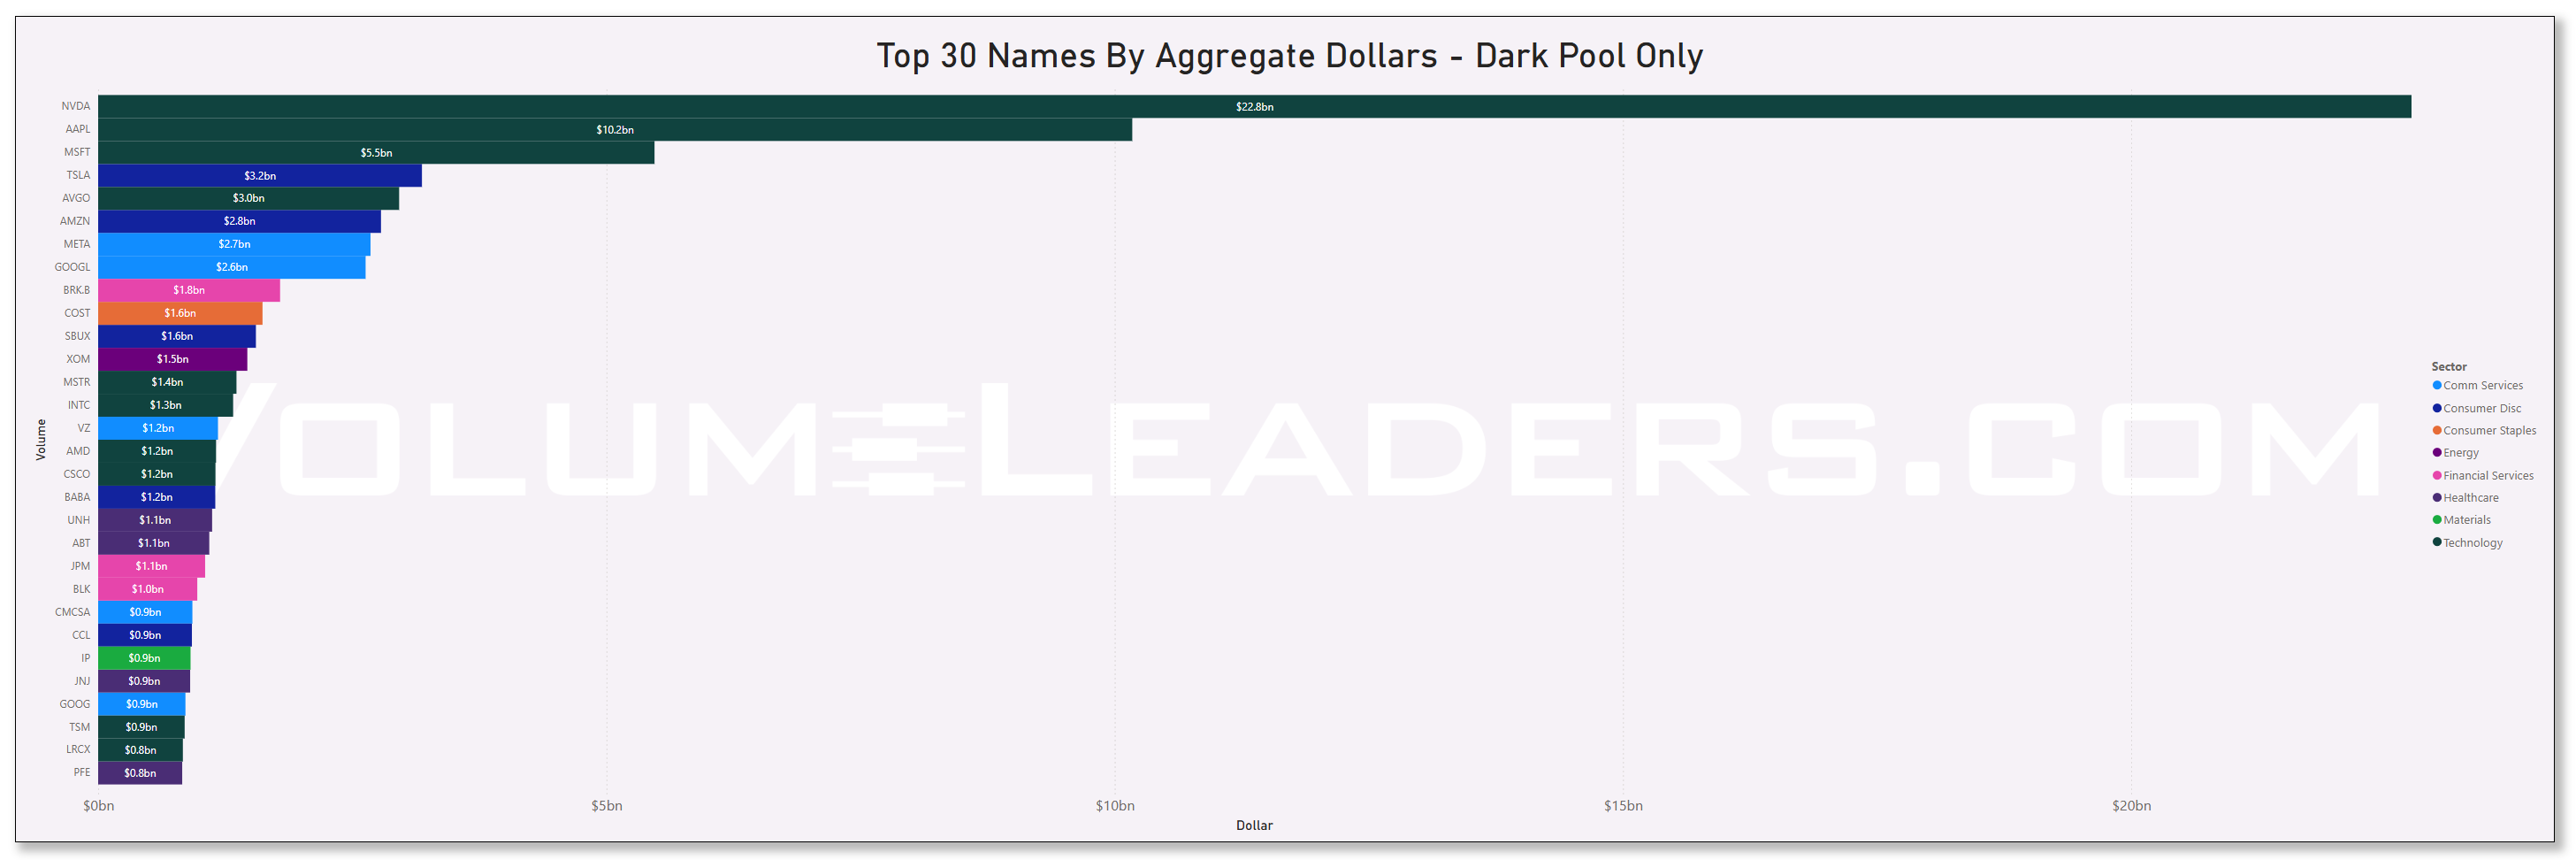
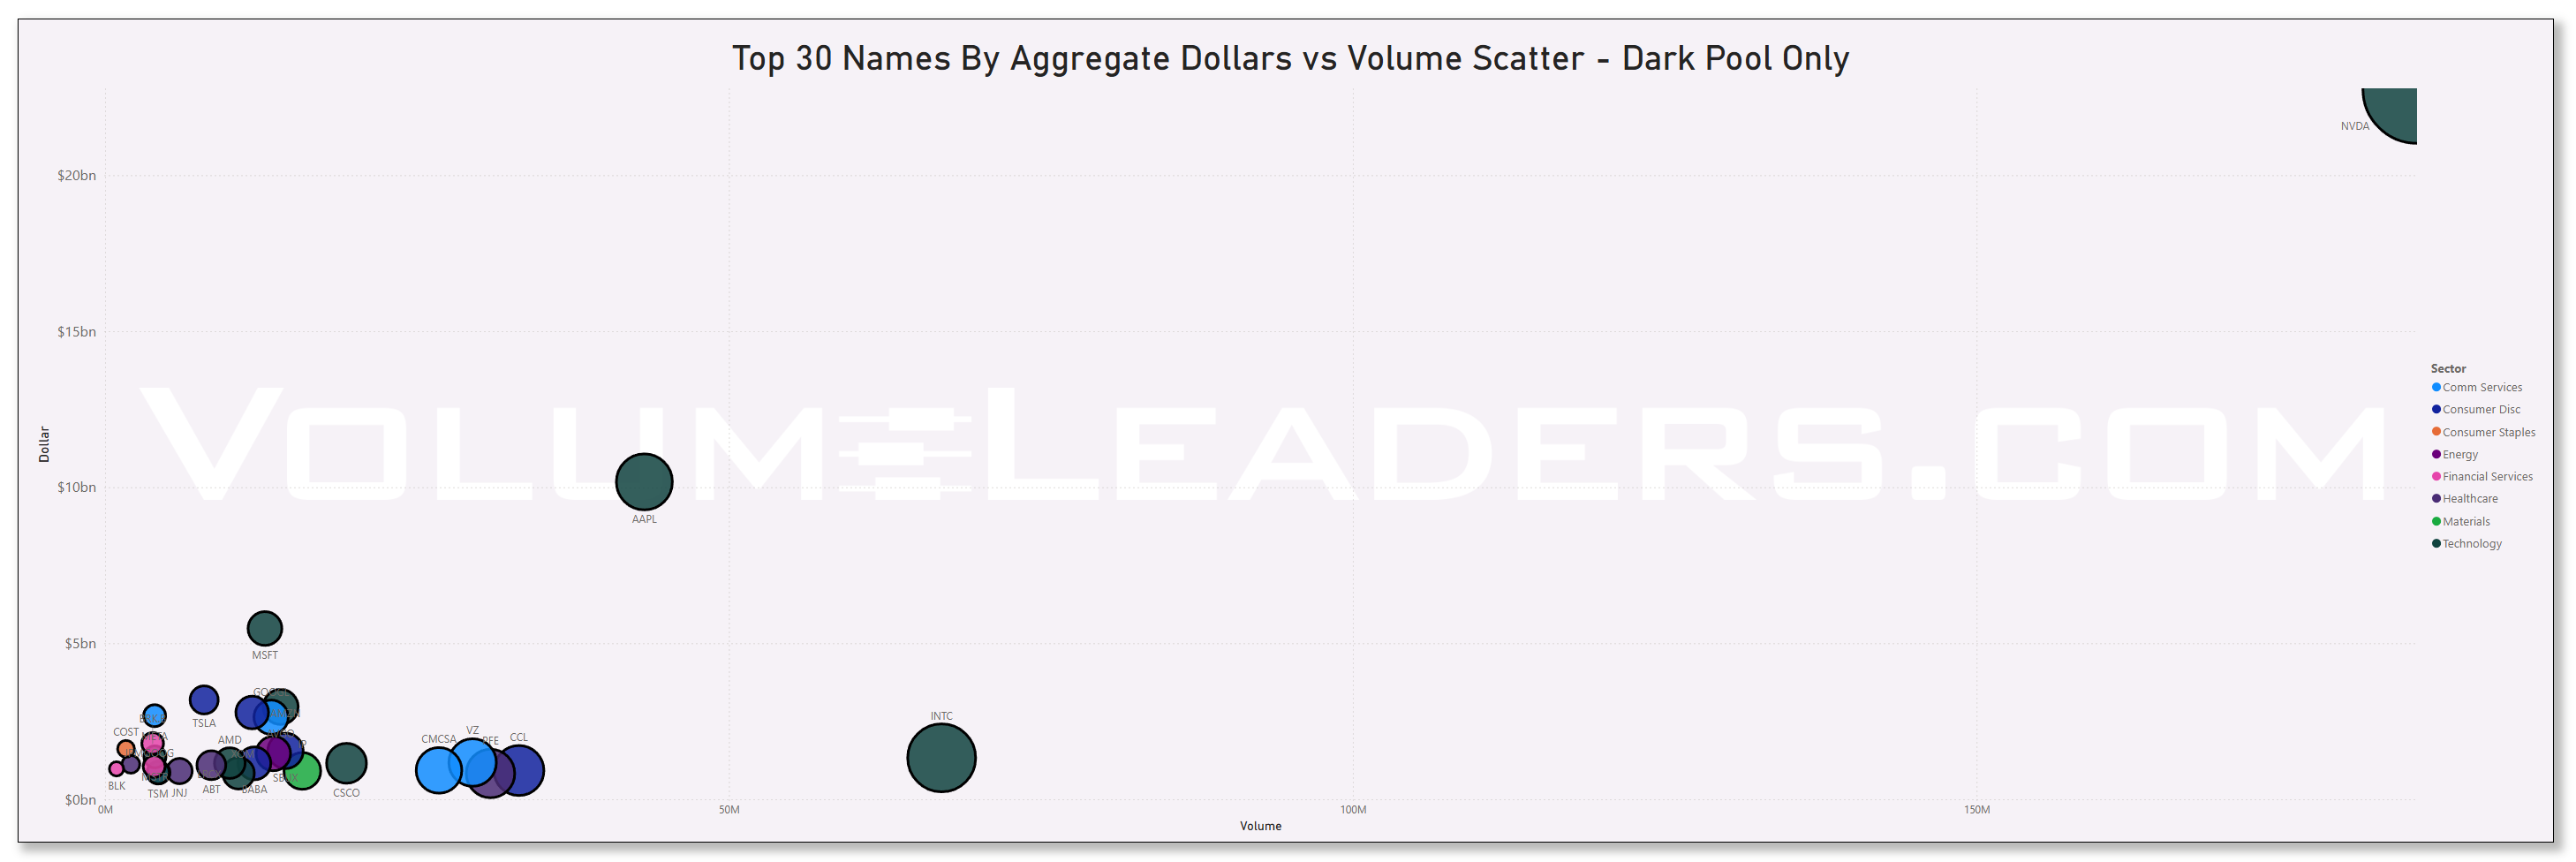
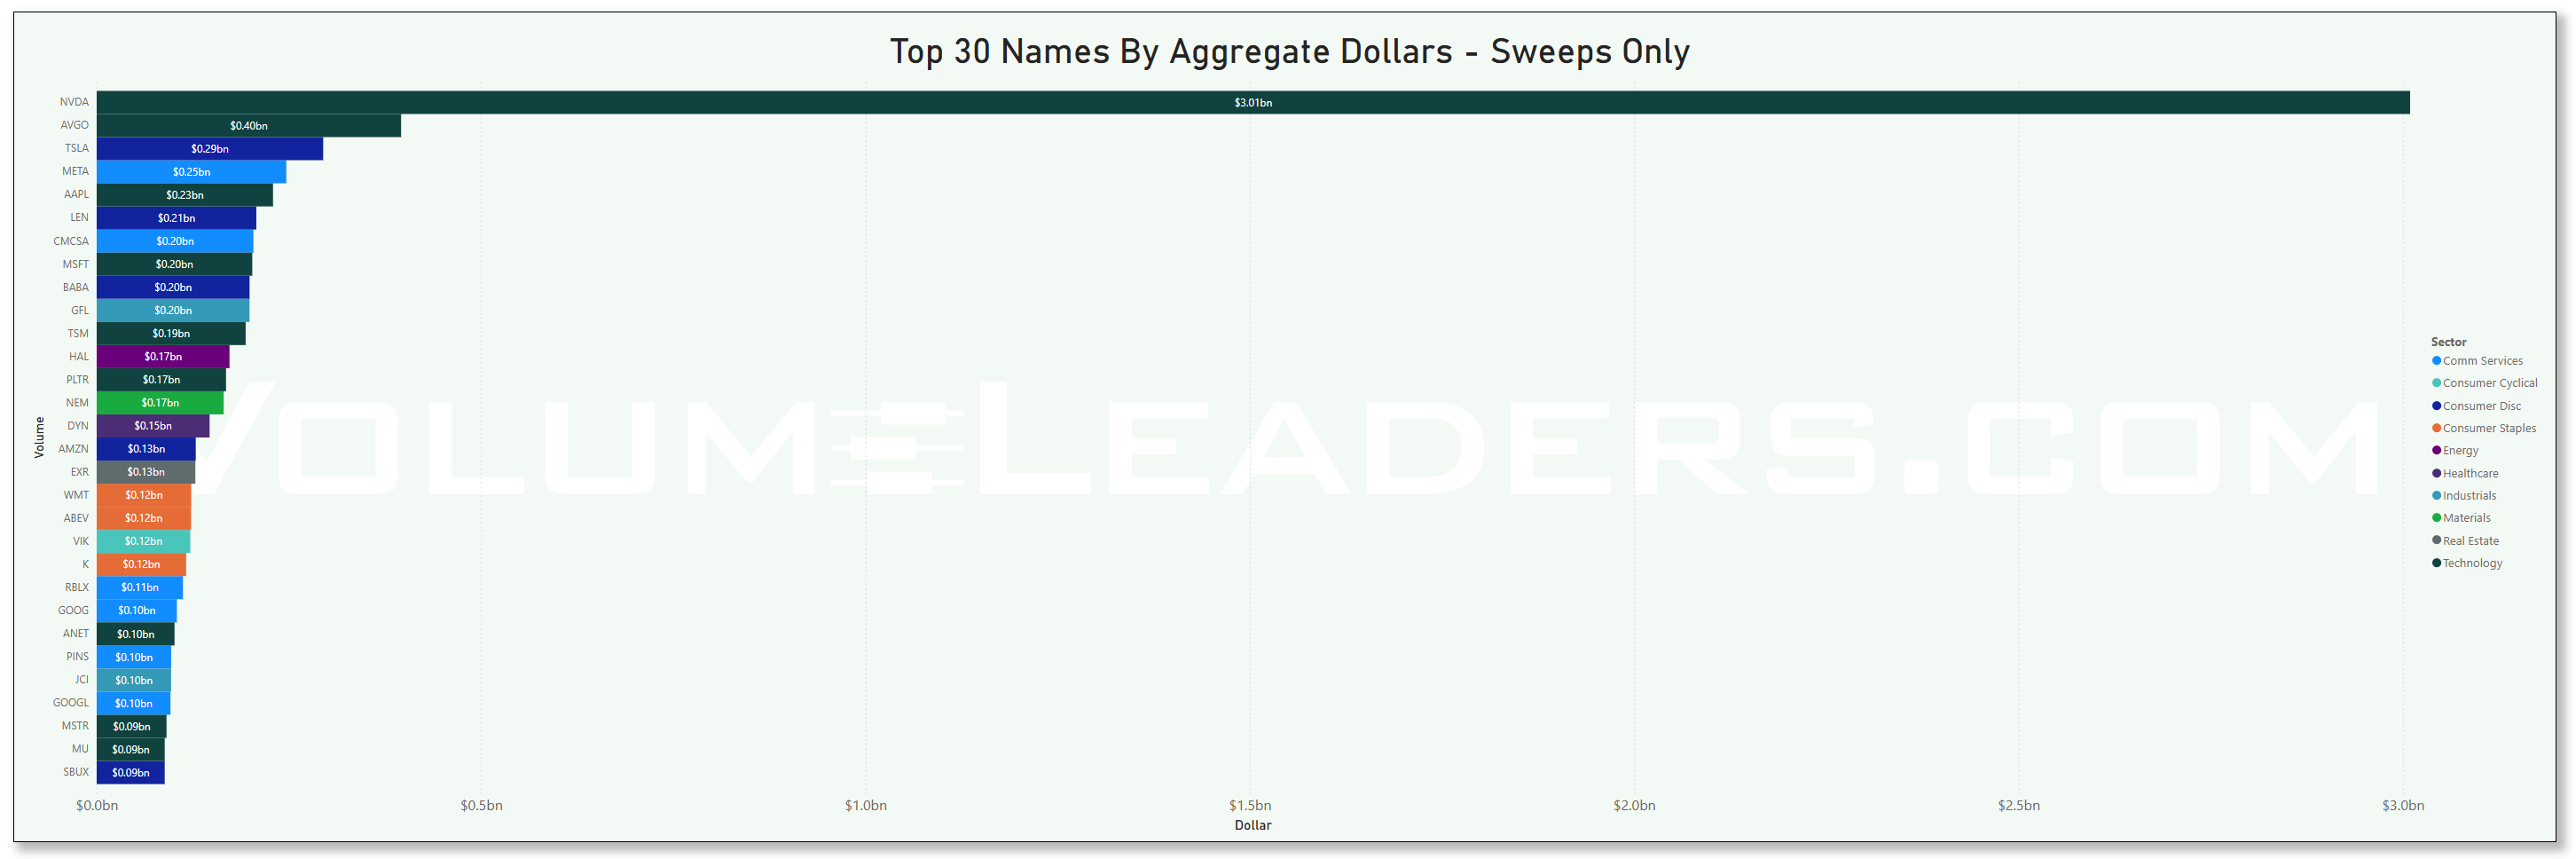
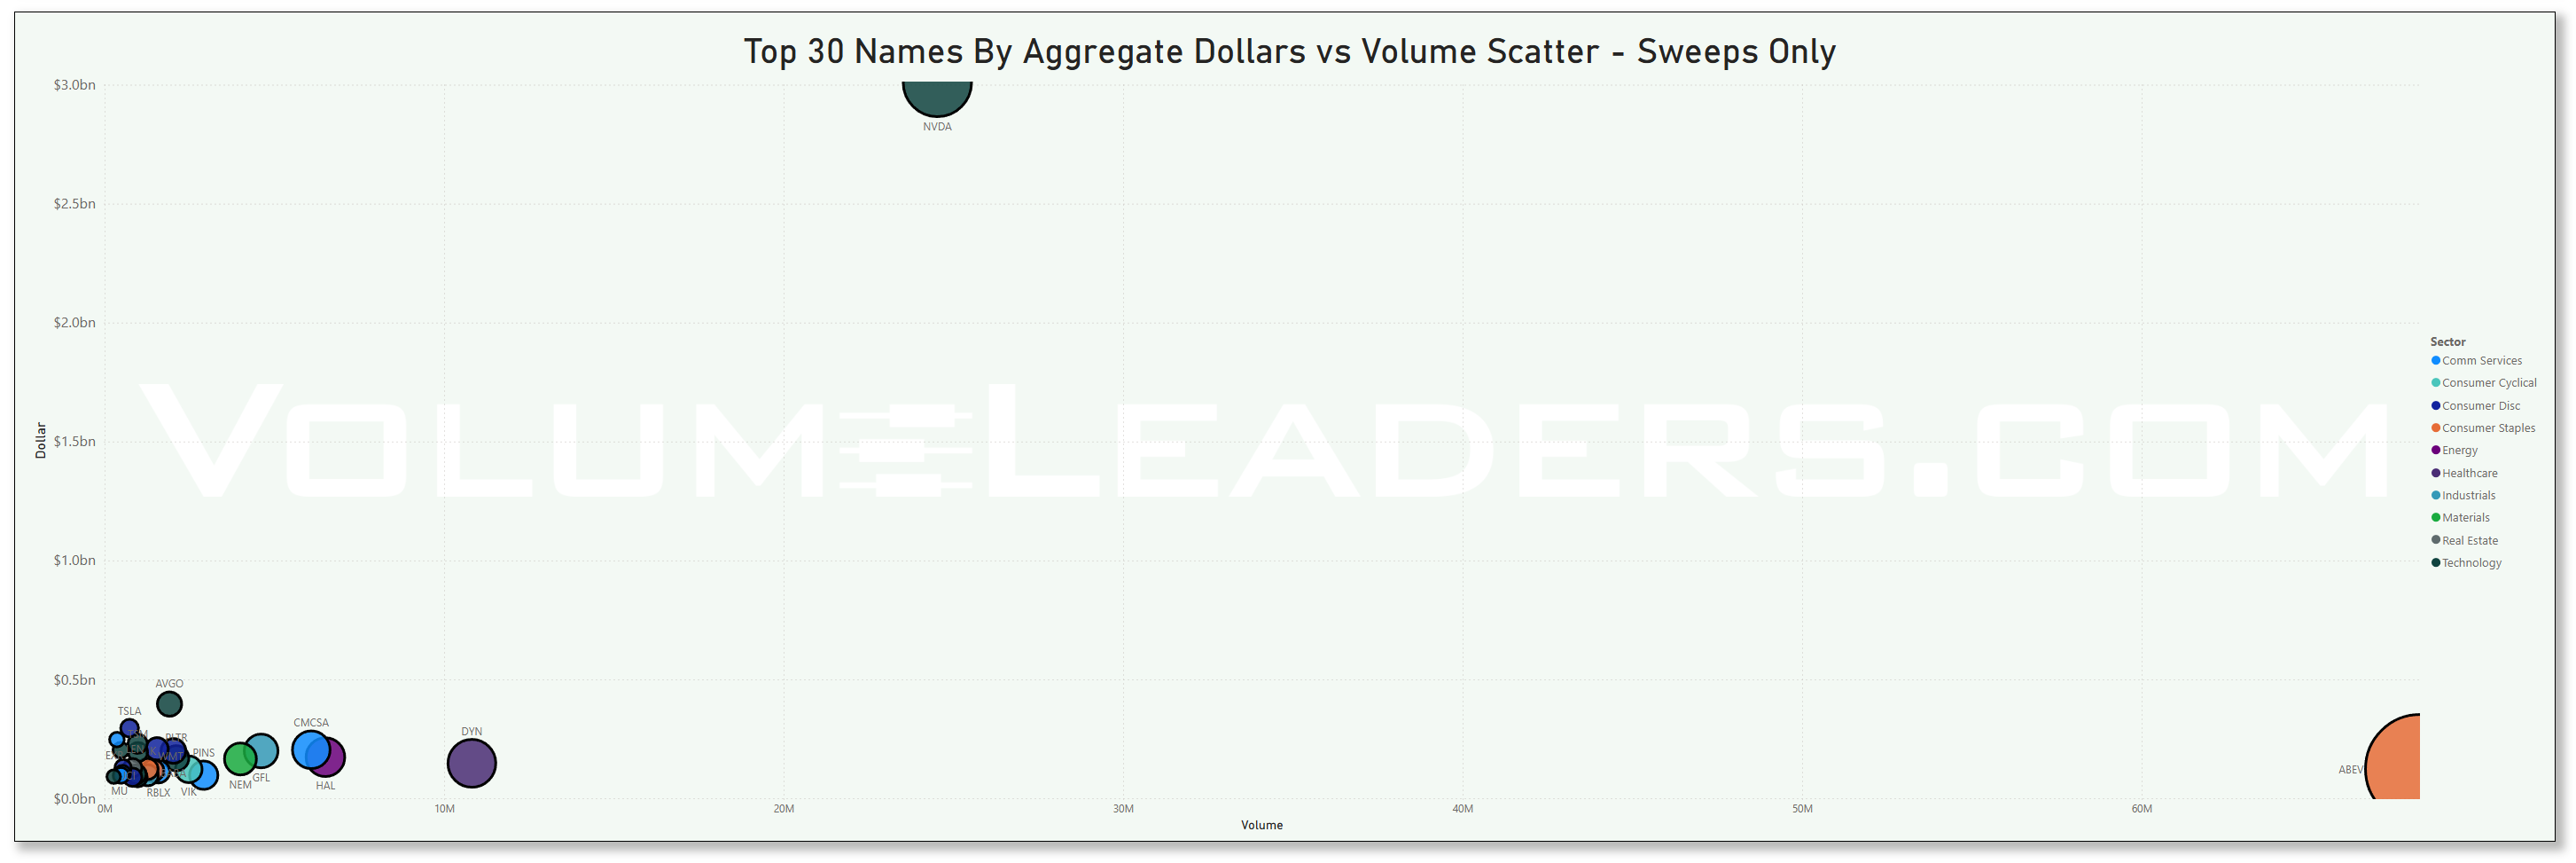
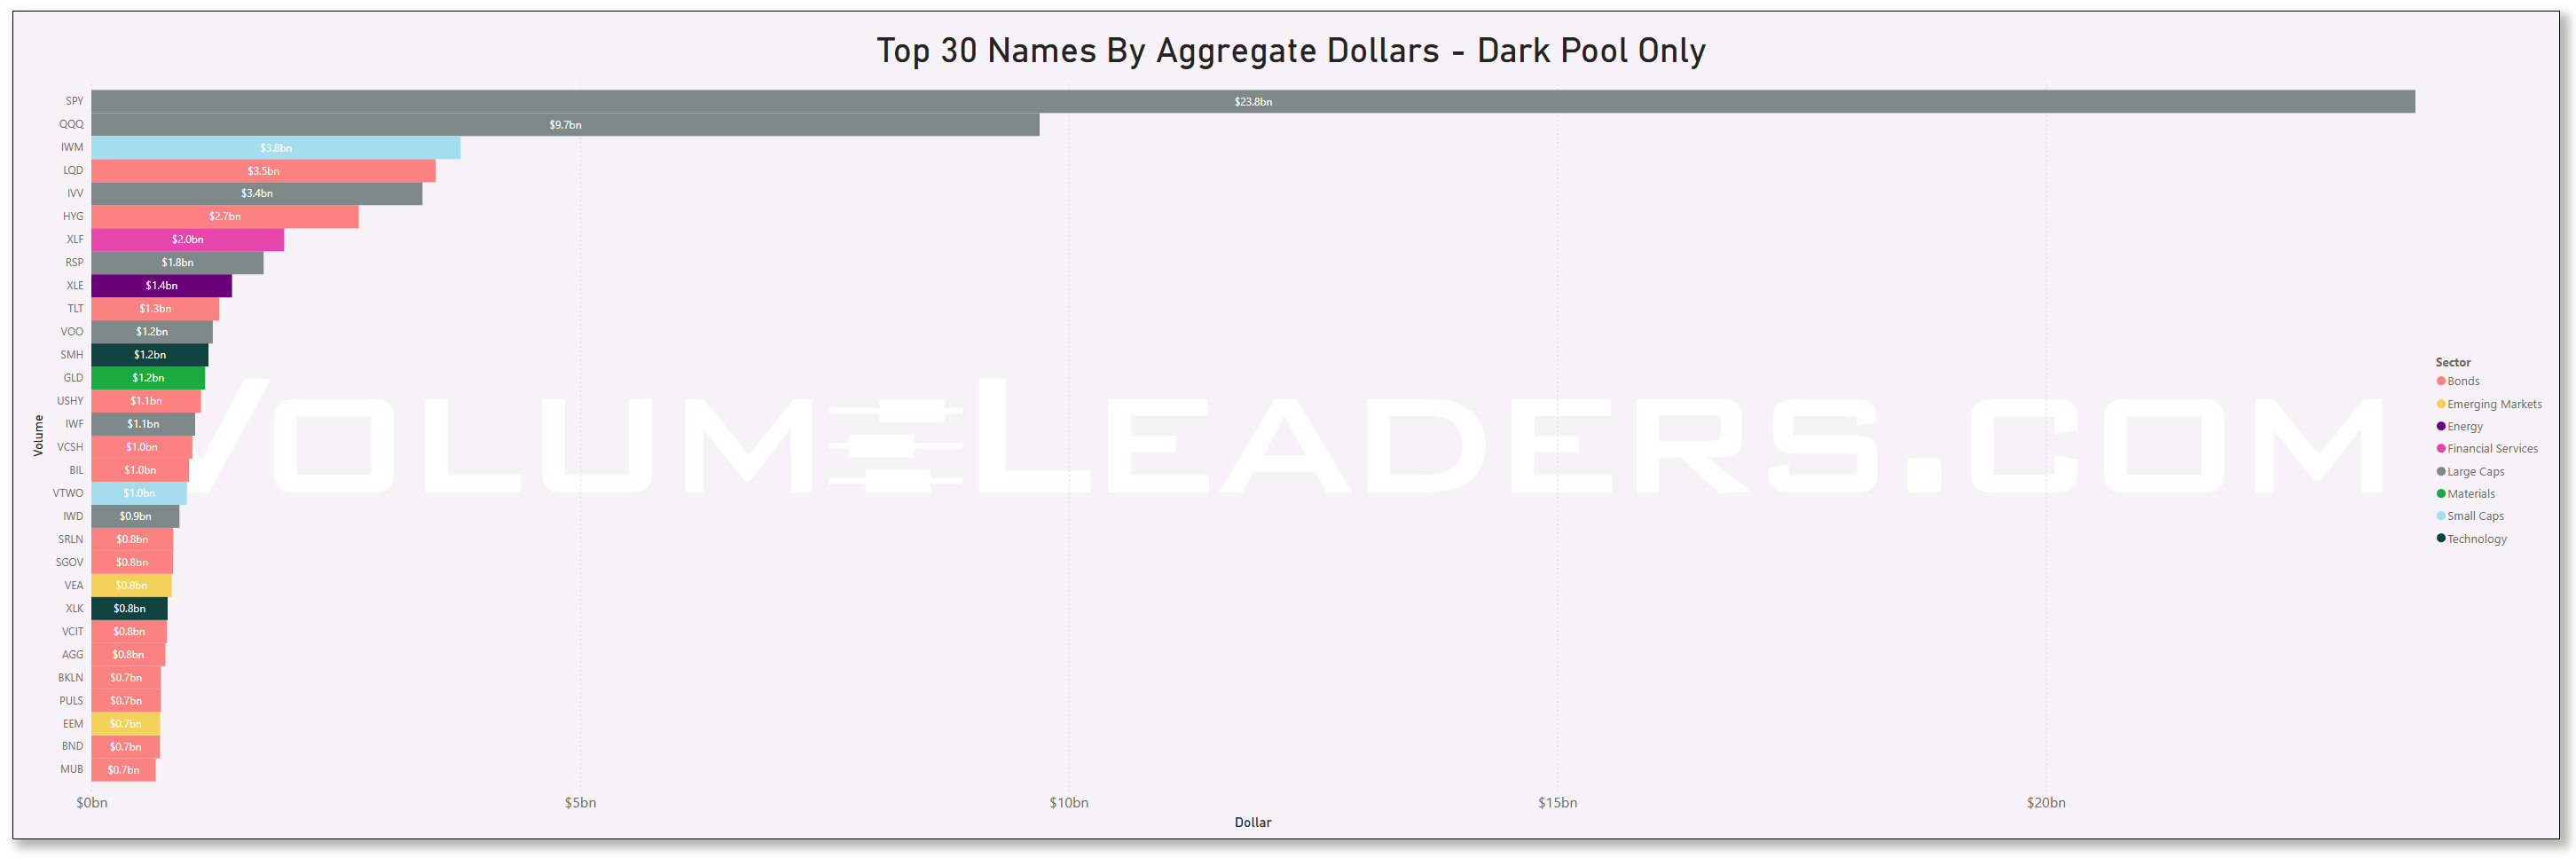
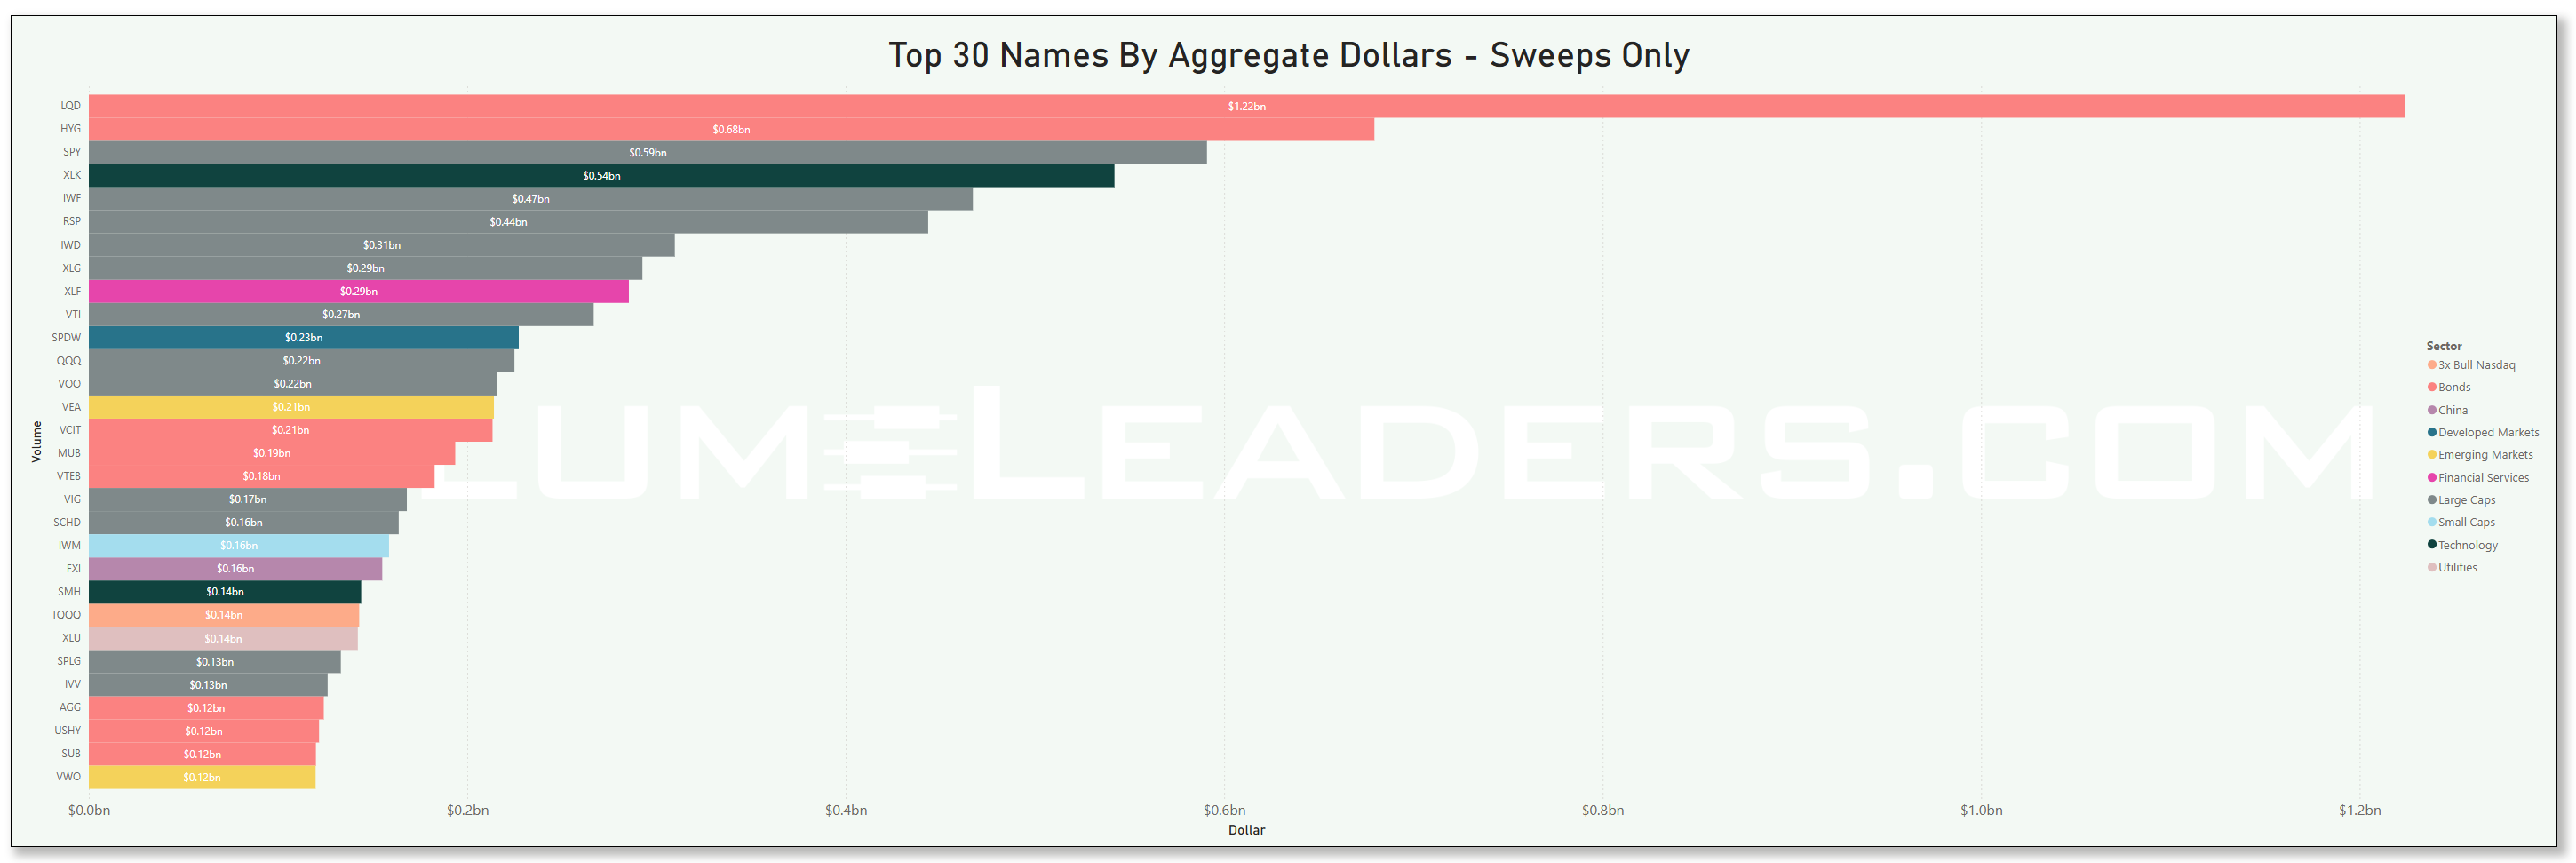
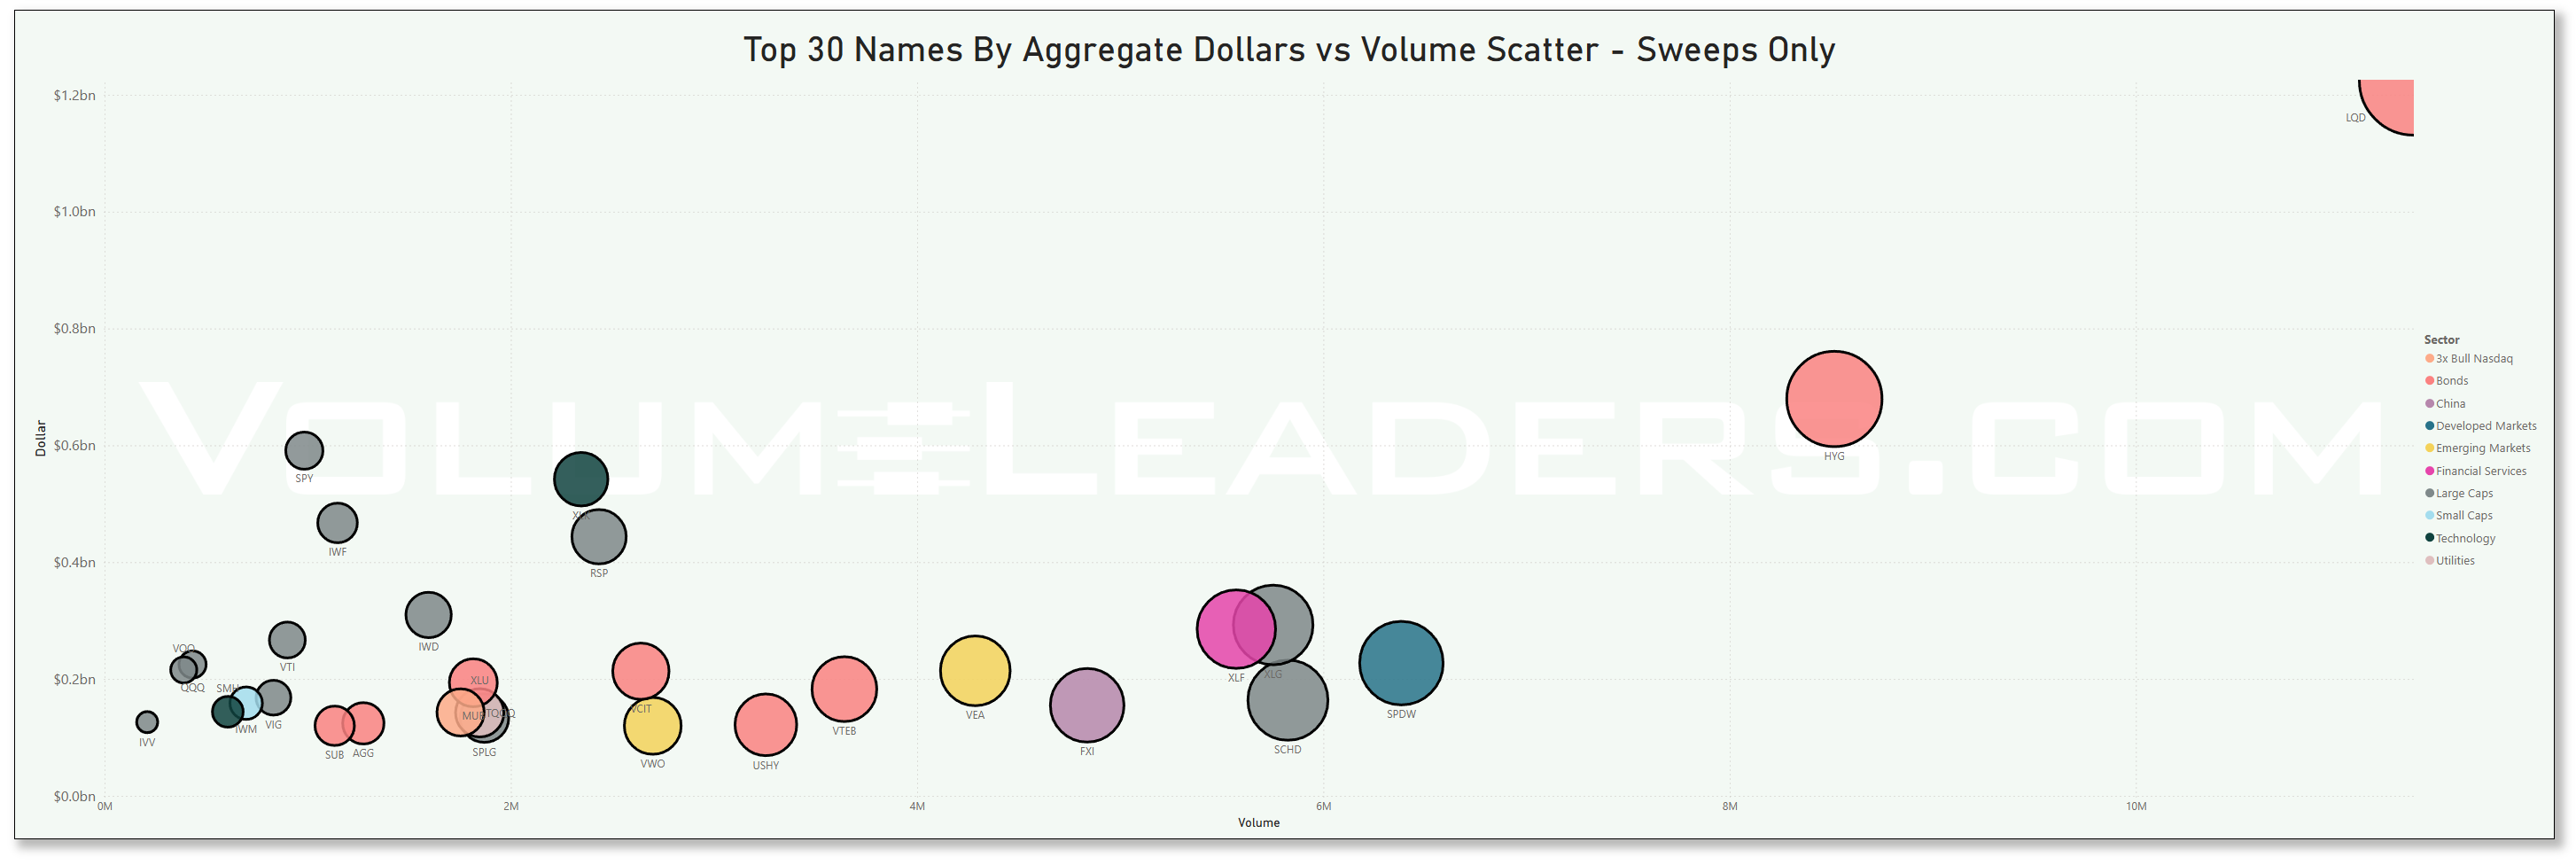
Top Institutional Order Flow In Individual Names By Trade-Type For Equities
These are incredibly important charts to watch as they contains lots of nuanced suggestions at a thematic level. Watch these charts closely week-to-week to stay informed about where institutional money is flowing, adjust your strategies based on momentum, align your portfolio with macroeconomic and market trends, and manage risks more effectively by avoiding sectors losing institutional favor.
Sector Rotation Insights: The chart highlights which sectors are attracting institutional activity and which are losing favor. Institutions often lead market trends, so tracking shifts in their focus can indicate sector rotations.
Sentiment Analysis: The level of institutional activity reflects confidence in specific sectors. Rising activity in traditionally defensive sectors (e.g., healthcare, utilities) may indicate caution, while a surge in growth sectors (e.g., technology, consumer discretionary) could suggest optimism.
Emerging Trends: Sudden spikes in a previously overlooked sector, like industrials or consumer staples, might hint at emerging opportunities or structural shifts.
Macro Themes: Changes in sector activity often align with broader macroeconomic themes like inflation, interest rates, or geopolitical events. For instance:
Increased activity in energy might indicate concerns about oil supply or rising prices.
Growth in technology could align with innovations or favorable policies.
Risk Management: Declining institutional activity in a sector might signal weakening fundamentals or heightened risks.
Spotting Overcrowding: Excessive activity in a single sector over multiple weeks may suggest overcrowding, which could lead to heightened volatility if institutions begin to exit.
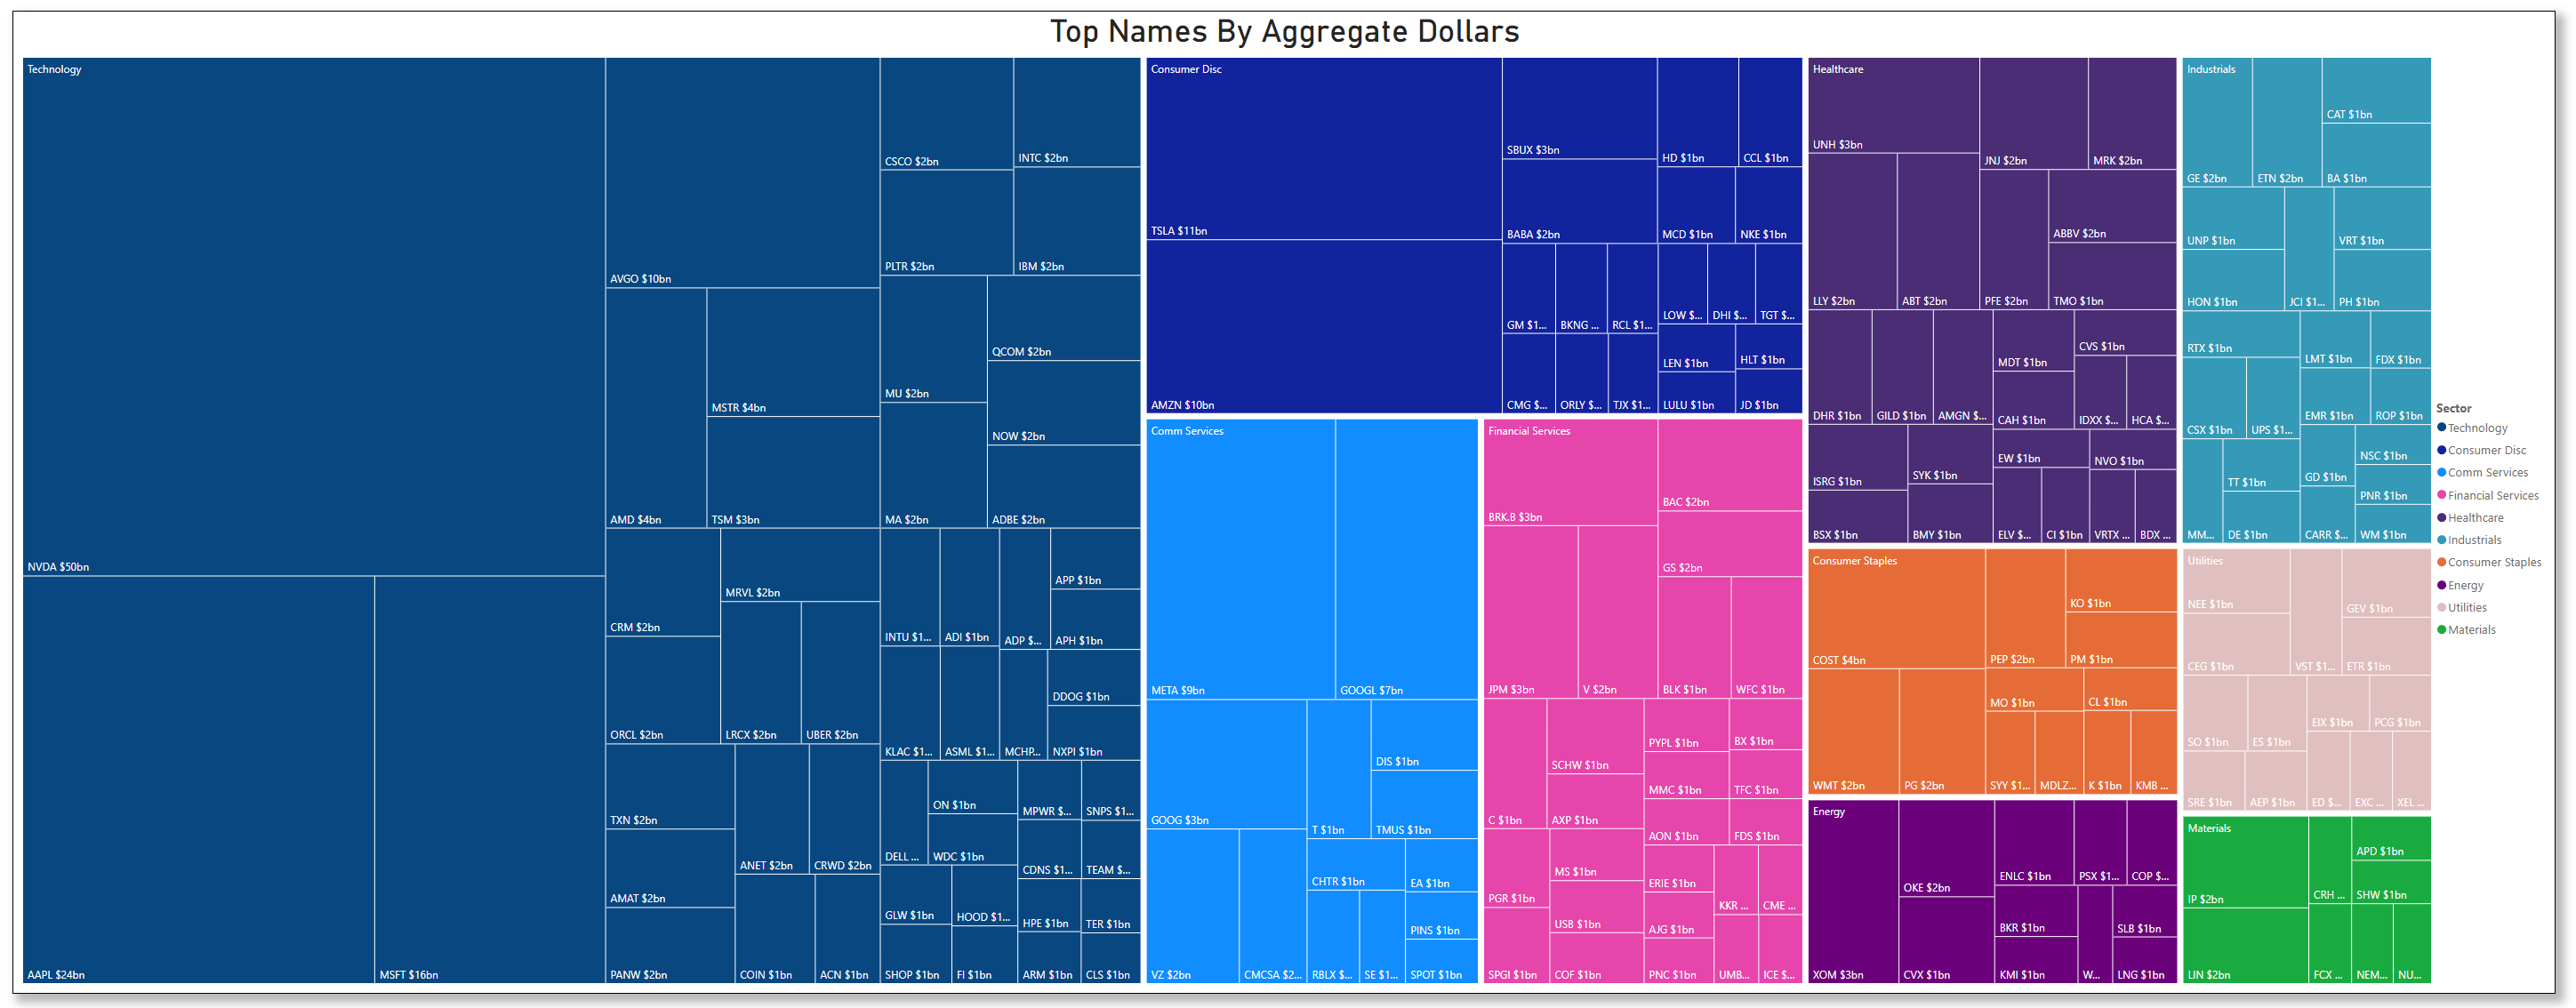
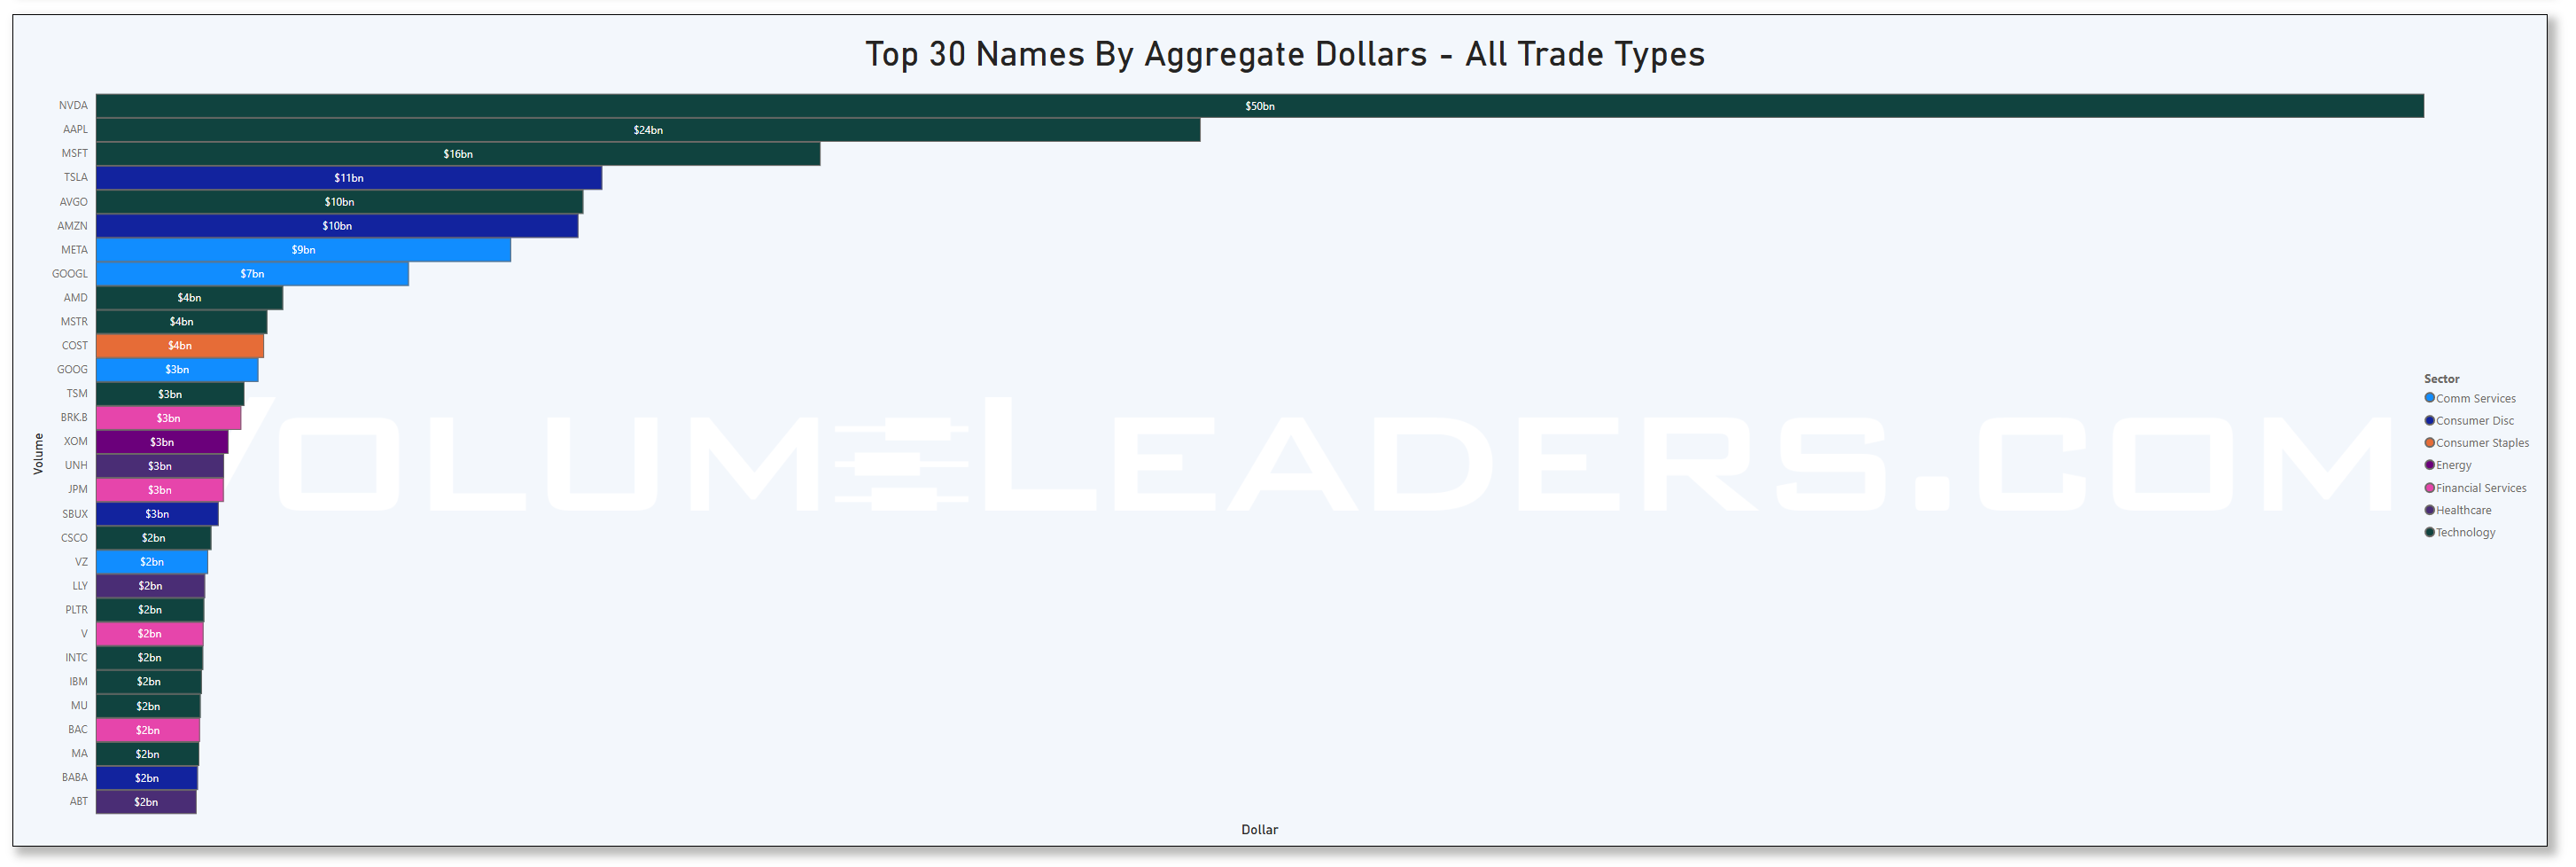
Many excellent trade ideas and sources of inspiration can be found in these prints below. While only the top 30 from each group are displayed, the complete results are accessible in VolumeLeaders.com for you to explore at your convenience any time. Remember to configure trade alerts within the platform to ensure institutional order flows that capture your interest or are significant to you aren’t missed. The blue charts encompass all types of trades, including blocks on lit exchanges; the purple charts exclusively depict dark pool trades; and the green charts represent sweeps only.
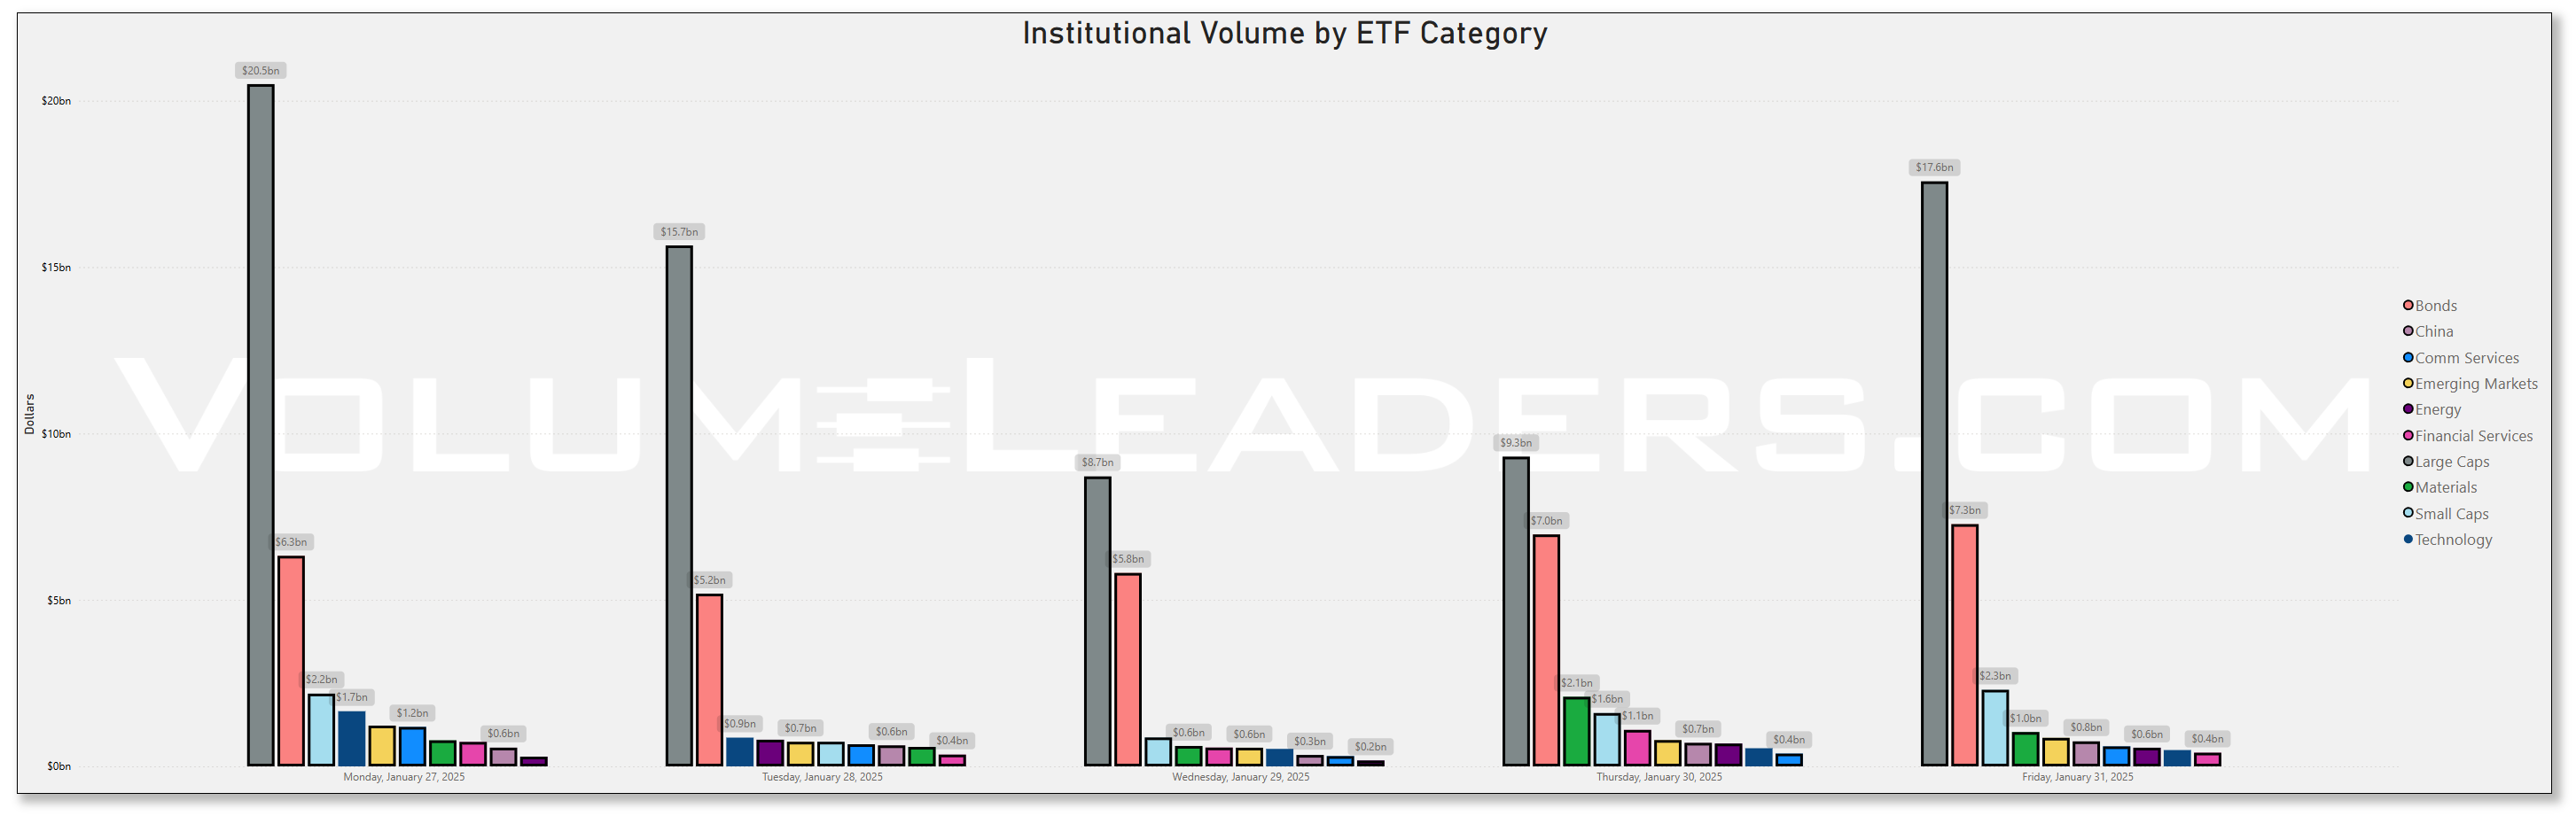
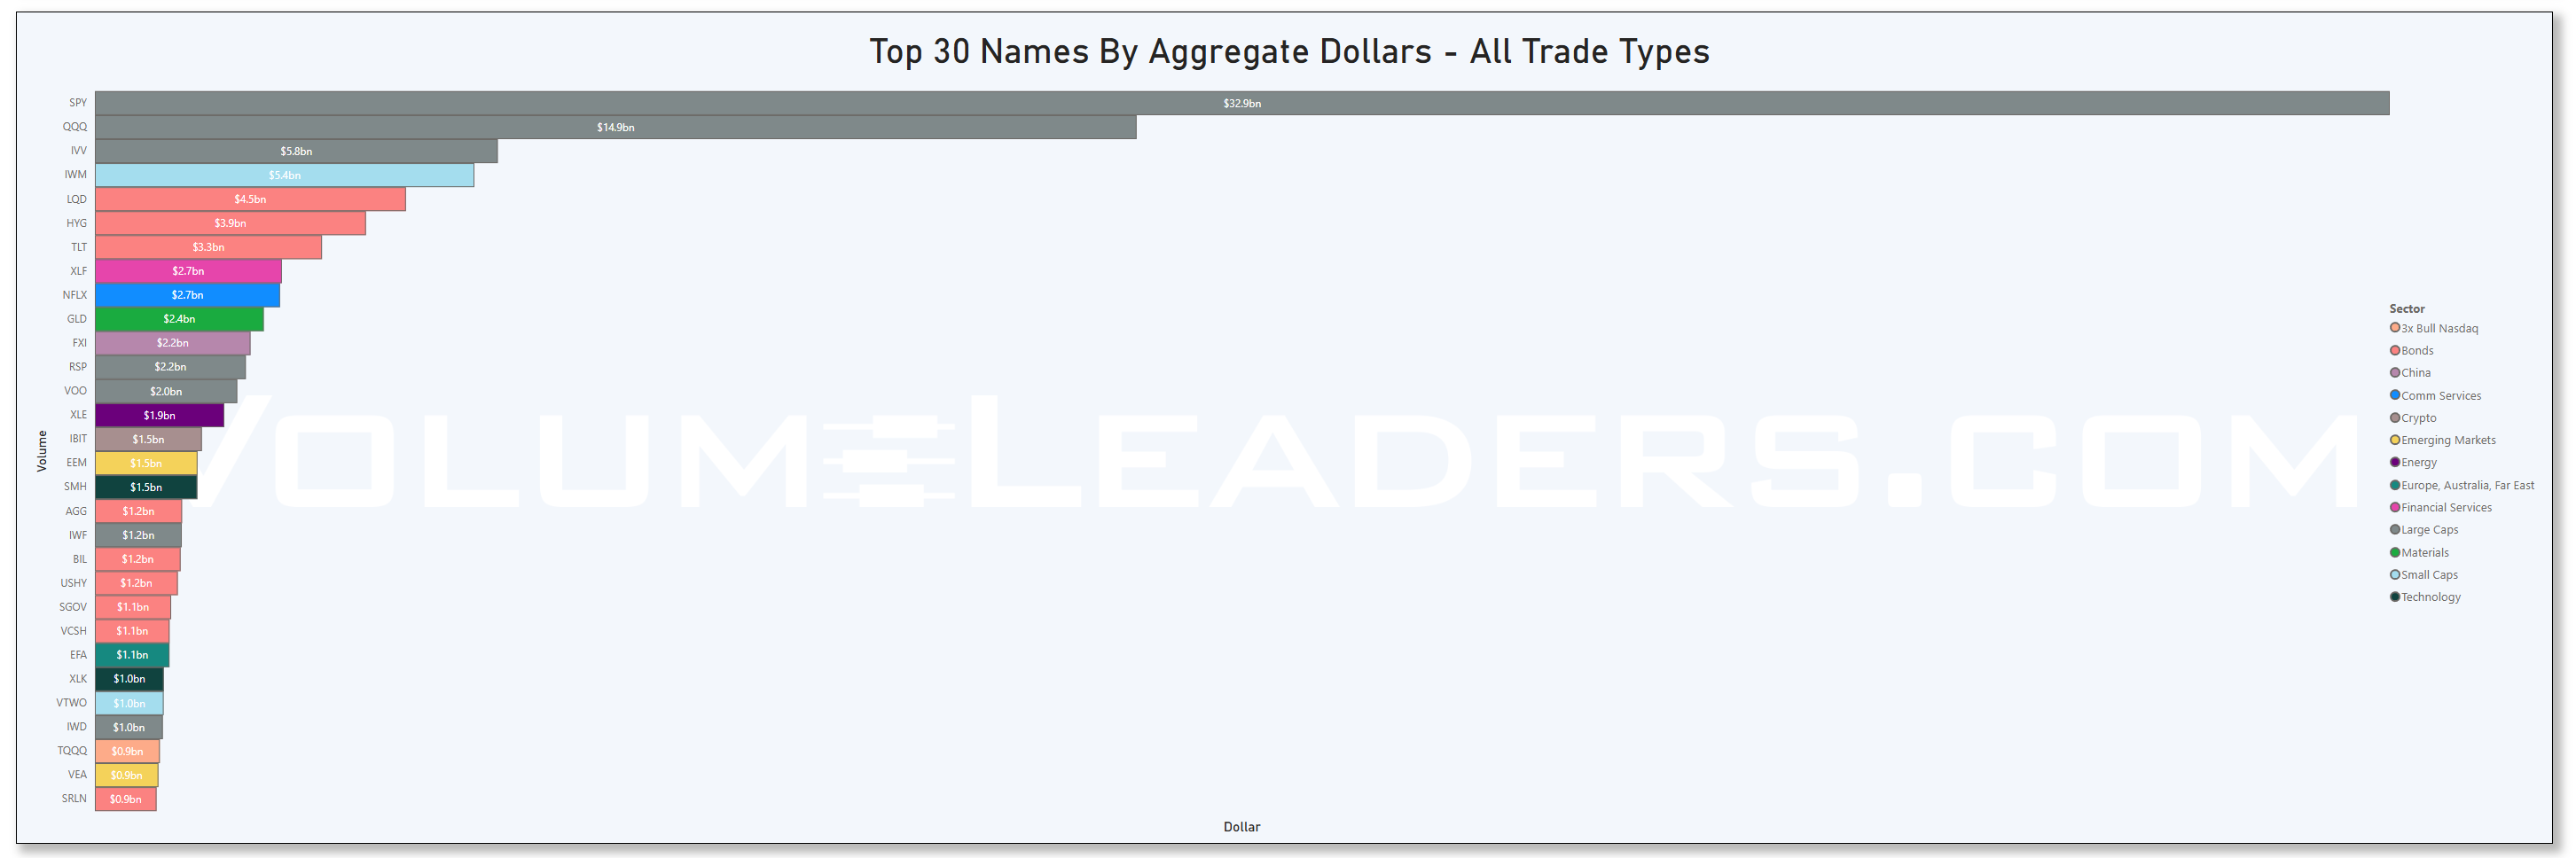
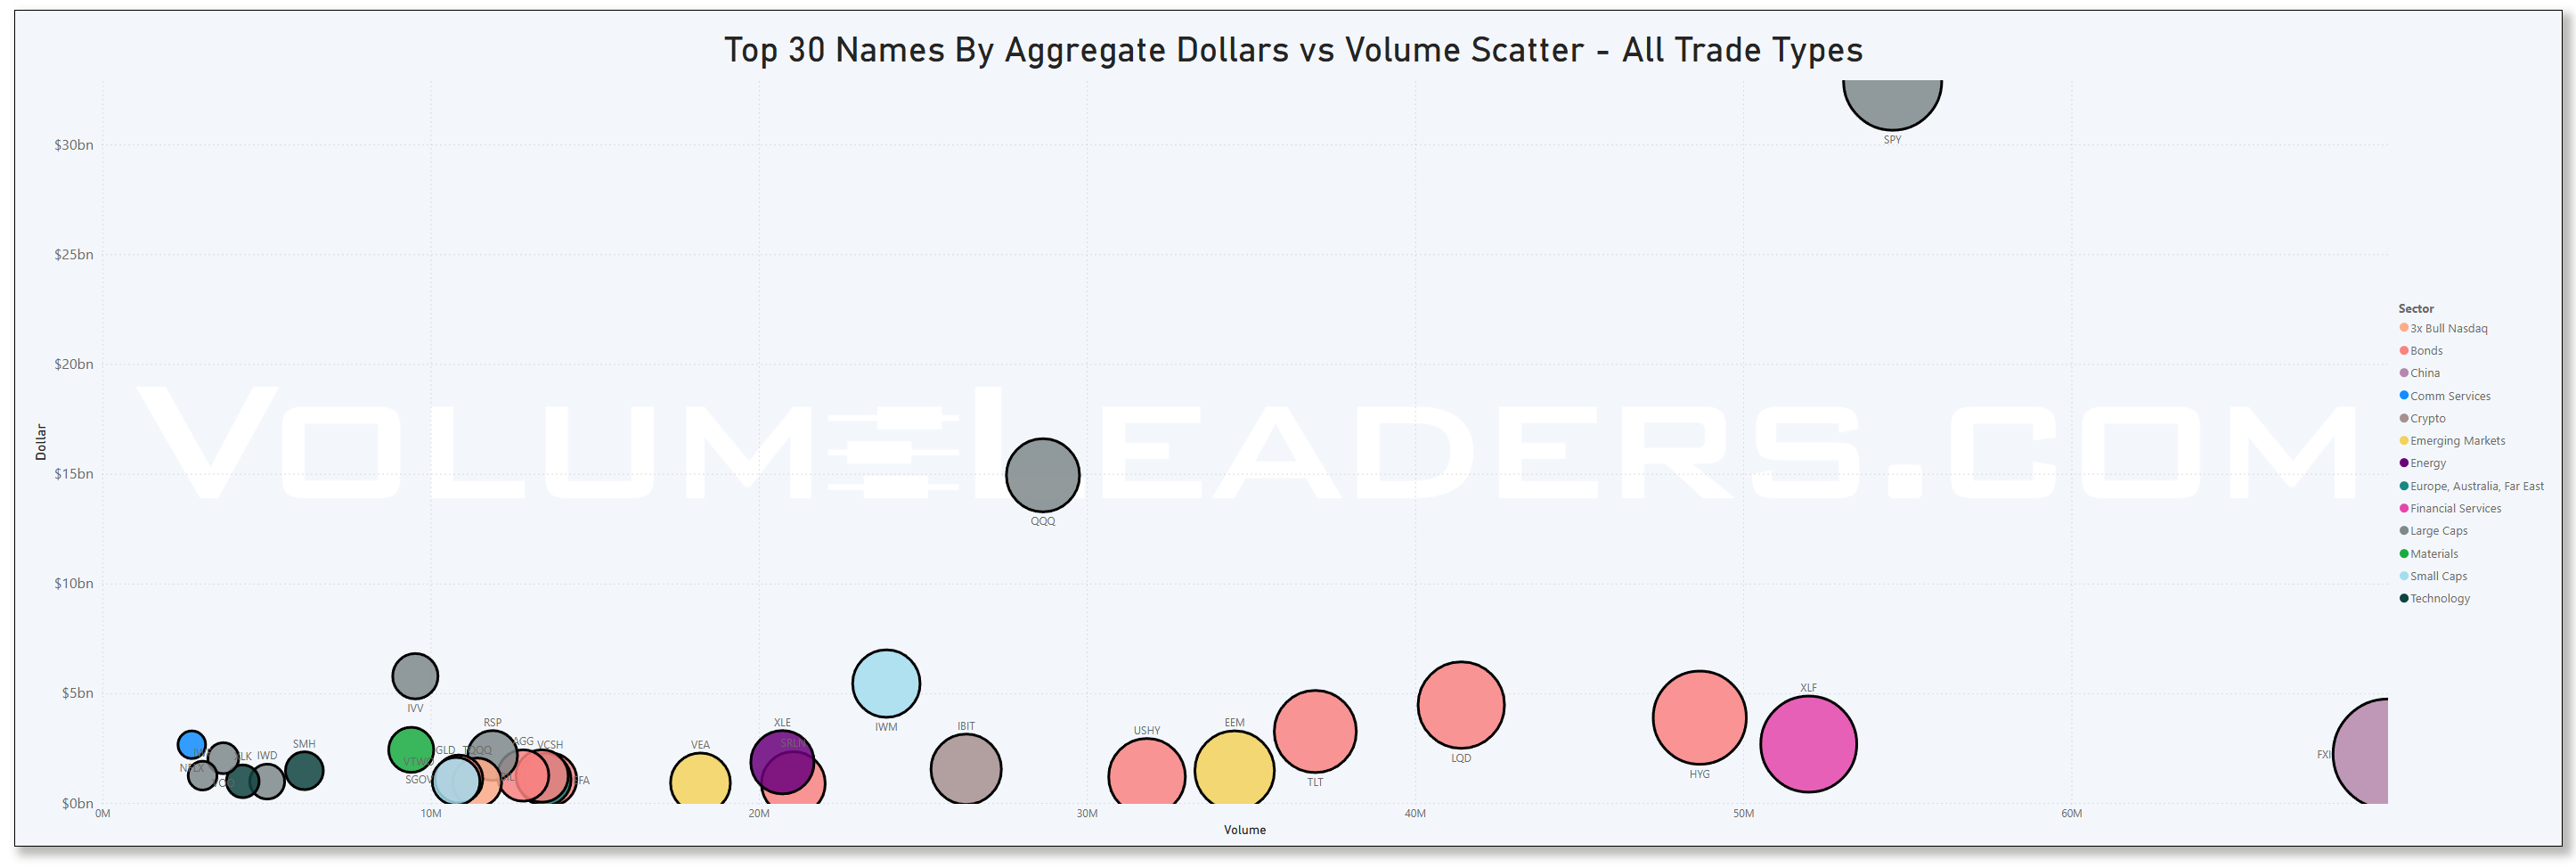
Top Institutional Order Flow In Individual Names By Trade-Type For ETFs

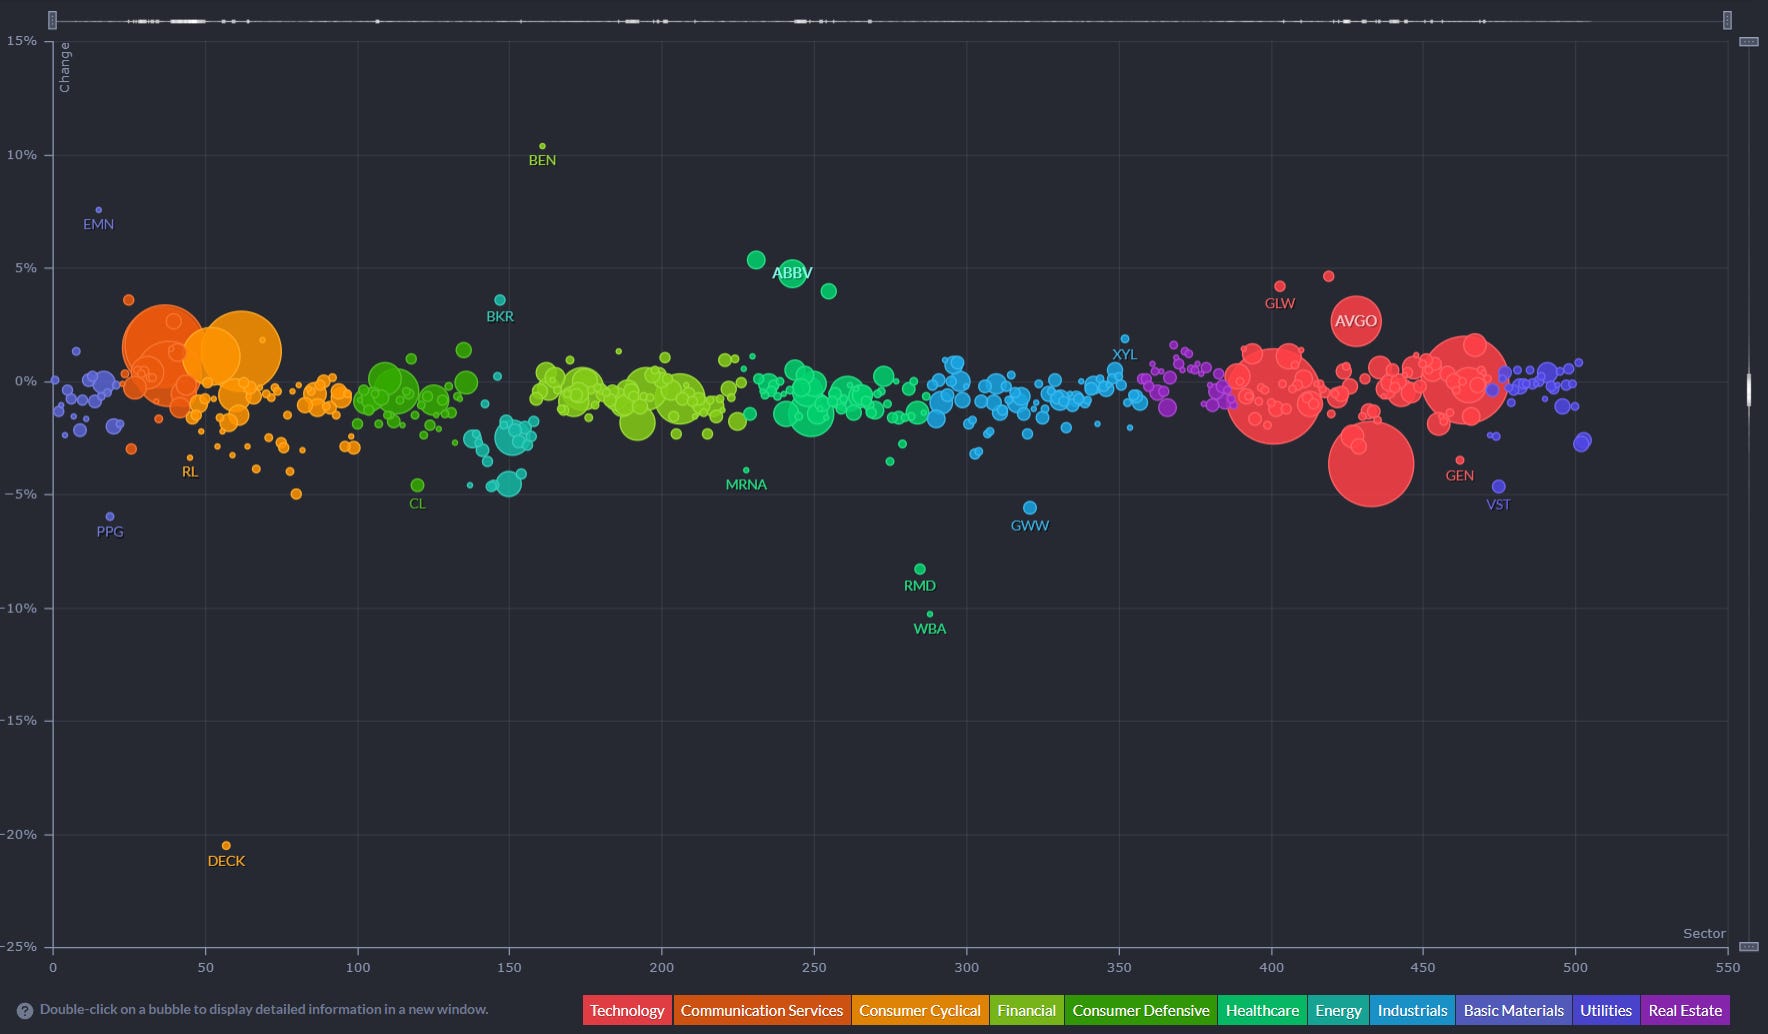
Last Week’s Institutionally-Backed Gainers & Losers
If you’re going to bet on a name, consider one that is officially endorsed by an institution! These are the top percent gainers (green) and percent losers (red) from this week’s open-to-close that had a trade price greater than $20 and institutional involvement. Continue watching tickers from this and prior stacks as these names frequently turn into multi-leg trades with a lot of movement!

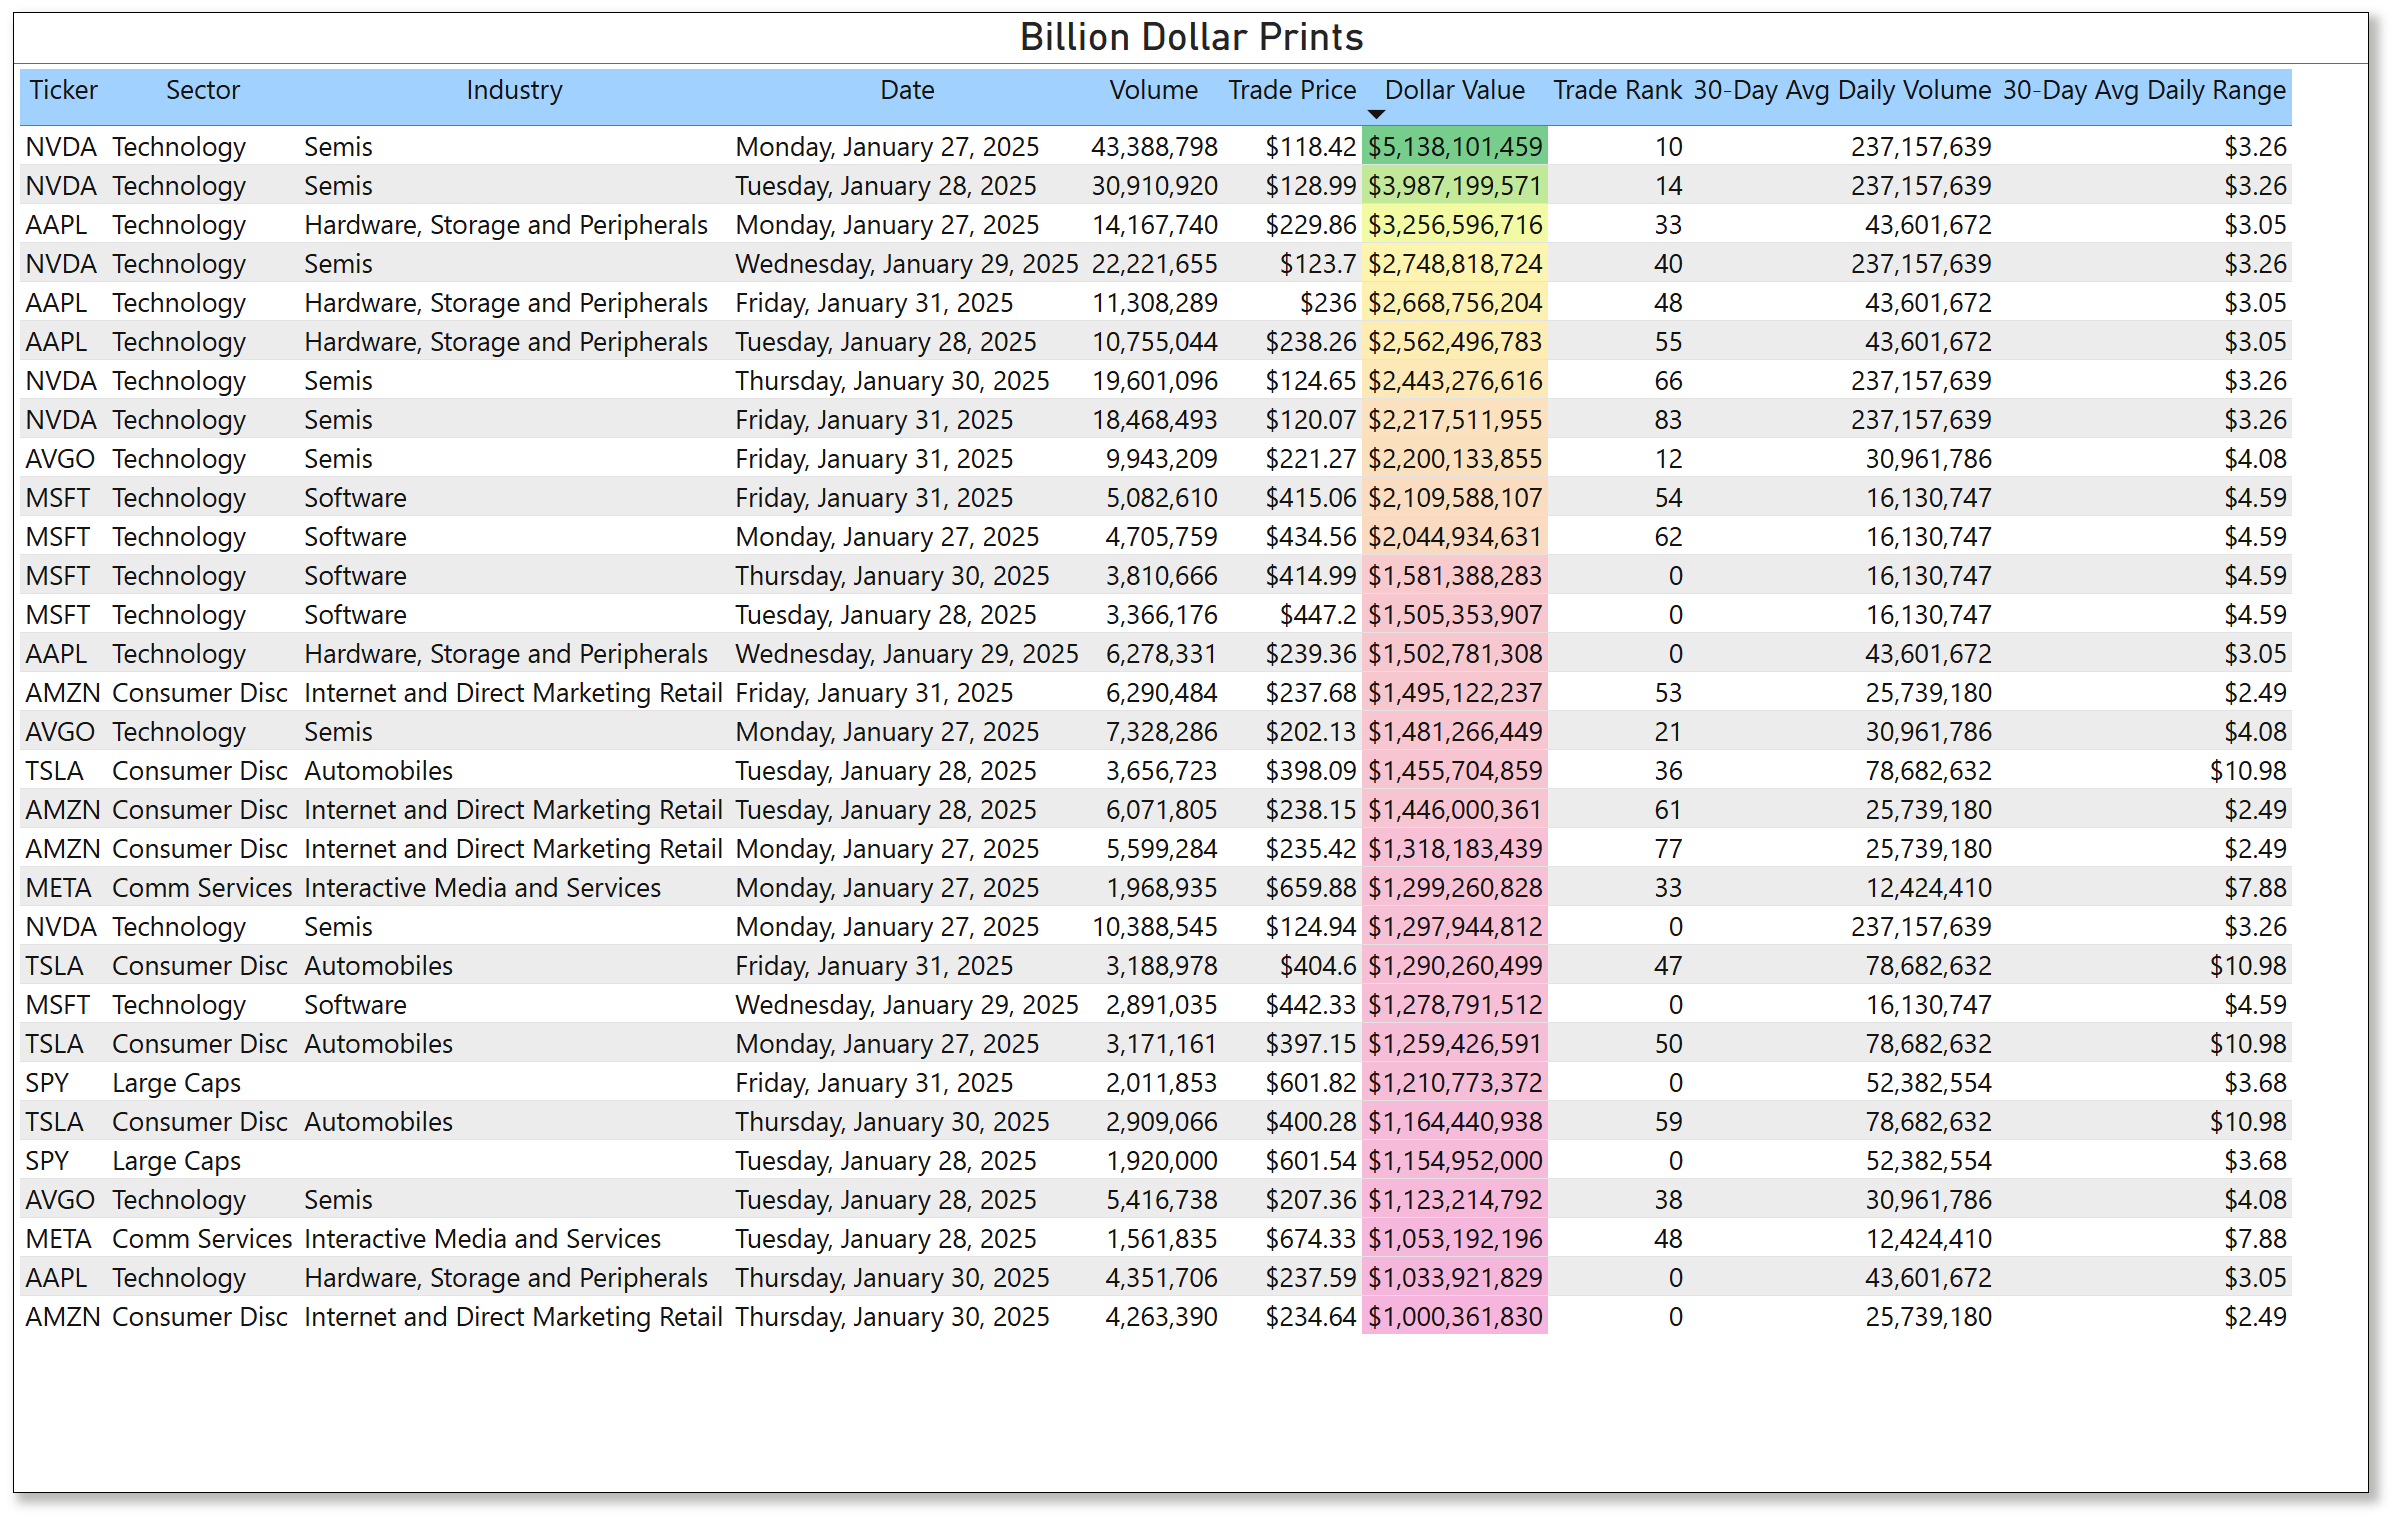
Last Week’s Billion-Dollar Prints
Tickers that printed a trade worth at least $1B last week get a special shout-out… Welcome to the club. These are massive commitments by institutions that should not be ignored.
Investments In Focus: Bull vs Bear Arguments
Please read “Institutional S/R Levels For Major Indices” at the top of this stack to understand the nature and importance of what we’re looking at here visually. Institutions leave footprints that VolumeLeaders.com can illustrate for you while providing context to assess things like institutional conviction and urgency. Theses and data given below are not financial advice, just personal observations that may be wrong; consult a certified financial advisor before making any investment decisions.
TDOC 0.00%↑
Teladoc Health, Inc. (NYSE: TDOC) is a leading provider of virtual healthcare services, offering a range of solutions including telemedicine, mental health support, and chronic condition management.
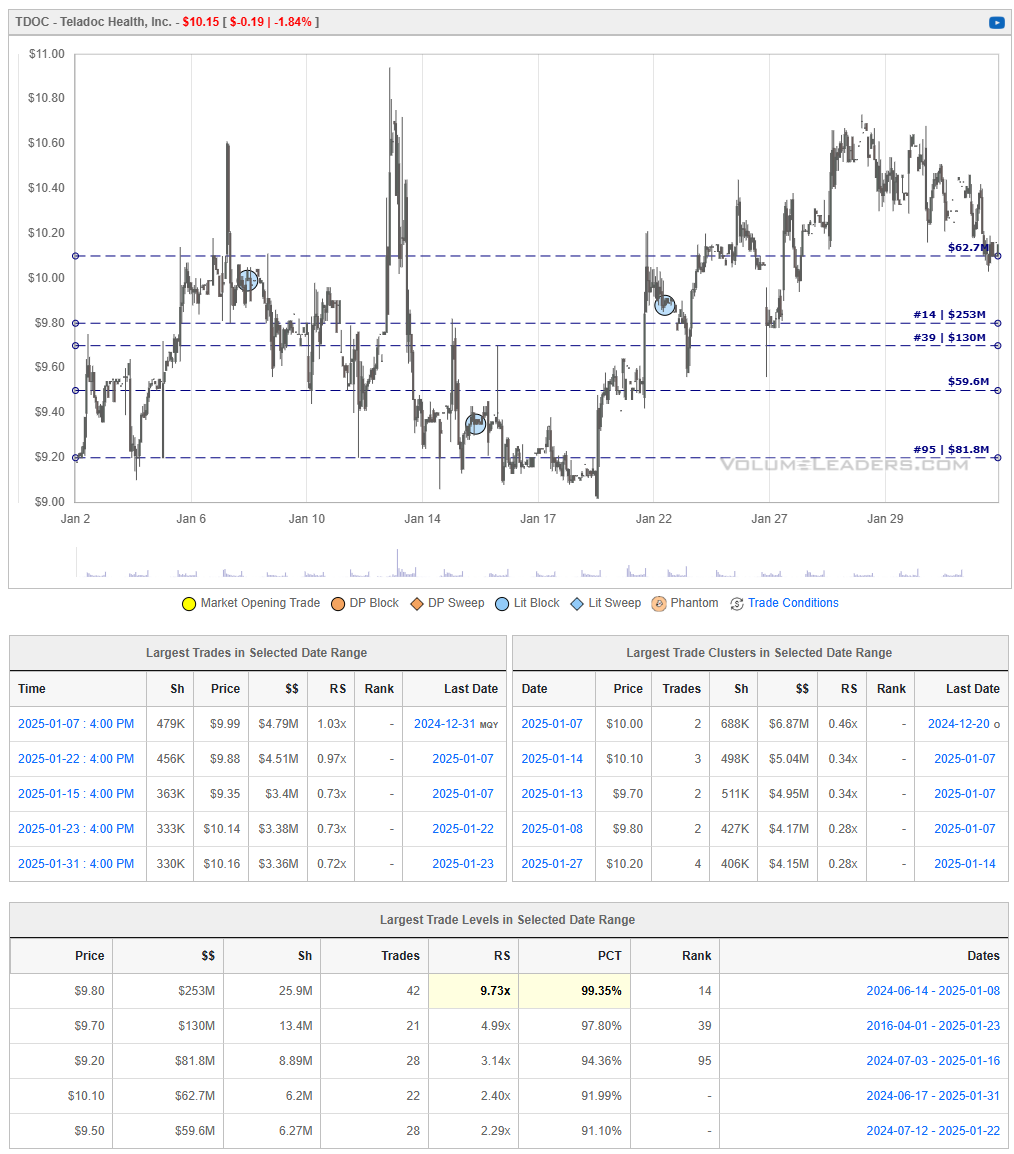
Bullish Perspective:
Strategic Partnerships: Teladoc has recently partnered with Amazon to expand its Health Benefits Connector program, enabling eligible Amazon customers to explore and enroll in Teladoc's chronic condition management programs. This collaboration aims to improve access to care and enhance user engagement.
Analyst Optimism: The company has received a consensus "Buy" rating from 20 analysts, with a 12-month average price target of $12.08, suggesting a potential upside of approximately 18.9% from the current price.
Financial Performance: In 2023, Teladoc reported revenues of $2.60 billion, an 8.13% increase from the previous year, indicating effective growth strategies and market demand for virtual healthcare services.
Market Position: As a pioneer in telemedicine, Teladoc is well-positioned to capitalize on the increasing adoption of virtual healthcare solutions, driven by technological advancements and changing patient preferences.
Service Diversification: The company's comprehensive service offerings, including mental health support and chronic disease management, cater to a broad patient base, enhancing its market reach and revenue potential.
Bearish Perspective:
Competitive Pressures: The telehealth industry is becoming increasingly competitive, with new entrants and established companies expanding their virtual care services, which could impact Teladoc's market share and pricing power.
Profitability Concerns: Despite revenue growth, Teladoc has reported net losses, raising questions about its path to profitability and long-term financial sustainability.
Stock Volatility: TDOC's stock has experienced significant fluctuations, with a 52-week range between $6.76 and $21.74, indicating potential instability and risk for investors.
Integration Challenges: As Teladoc continues to expand through partnerships and acquisitions, it may face challenges in integrating new services and technologies, which could affect operational efficiency and service quality.
Regulatory Risks: Changes in healthcare regulations and reimbursement policies could impact Teladoc's operations and financial performance, especially as telehealth policies evolve post-pandemic.
In summary, Teladoc Health's strategic partnerships, positive analyst outlook, and revenue growth highlight its potential in the expanding virtual healthcare market. However, investors should consider competitive dynamics, profitability concerns, and regulatory risks when evaluating the company's prospects.
TROW 0.00%↑
T. Rowe Price Group, Inc. (NASDAQ: TROW) is a global investment management firm offering a range of services, including mutual funds, advisory services, and retirement plans.
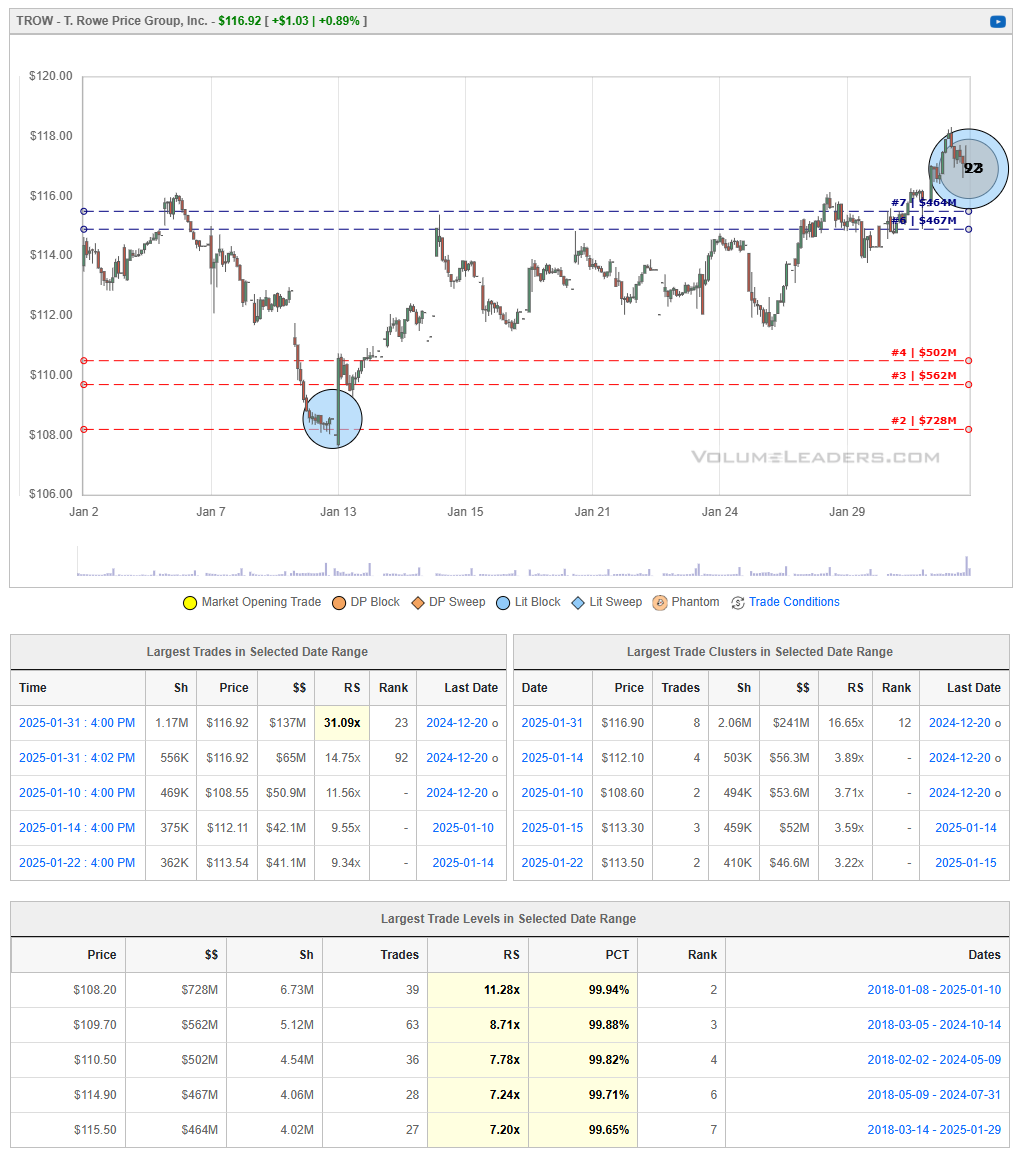
Bullish Perspective:
Strong Financial Performance: In the third quarter of 2024, T. Rowe Price reported a 17.4% increase in profit, reaching $586.5 million, or $2.57 per share, up from $499.5 million, or $2.17 per share, in the same period the previous year. This growth was driven by an 11.5% rise in investment advisory fees, totaling $1.63 billion.
Robust Assets Under Management (AUM): As of December 31, 2024, the firm's AUM stood at $1.61 trillion, reflecting its strong market position and effective investment strategies.
Consistent Dividend Payments: The company declared a quarterly dividend of $1.24 per share, payable on December 27, 2024, demonstrating its commitment to returning value to shareholders.
Positive Analyst Outlook: Analysts have a consensus "Buy" rating on TROW, with a 12-month average price target of $126.00, suggesting potential upside from the current price.
Strategic Initiatives: The firm continues to innovate, as evidenced by the launch of a special edition of "The Angle" podcast focusing on executive leadership, aiming to engage clients and stakeholders effectively.
Bearish Perspective:
Net Outflows: In December 2024, T. Rowe Price experienced preliminary net outflows of $10.9 billion, contributing to total net outflows of $43.2 billion for the year, which may raise concerns about client retention and asset growth.
Market Volatility Exposure: As an investment management firm, T. Rowe Price's revenues are closely tied to market performance. Prolonged market downturns or increased volatility could negatively impact AUM and fee income.
Fee Compression: The asset management industry faces pressure to reduce fees due to competition and the rise of passive investment products, which could affect the firm's profit margins.
Regulatory Risks: Changes in financial regulations or compliance requirements may increase operational costs or limit business practices, potentially impacting profitability.
Economic Sensitivity: Economic downturns can lead to reduced investor confidence and lower investment inflows, adversely affecting the firm's financial performance.
In summary, T. Rowe Price Group, Inc. showcases strengths through strong financial performance, substantial AUM, and strategic initiatives. However, potential investors should consider net outflows, market volatility exposure, and industry challenges when evaluating investment decisions.
INOD 0.00%↑
Innodata Inc. (NASDAQ: INOD) is a data engineering company specializing in transforming complex data into valuable insights for businesses across various industries.
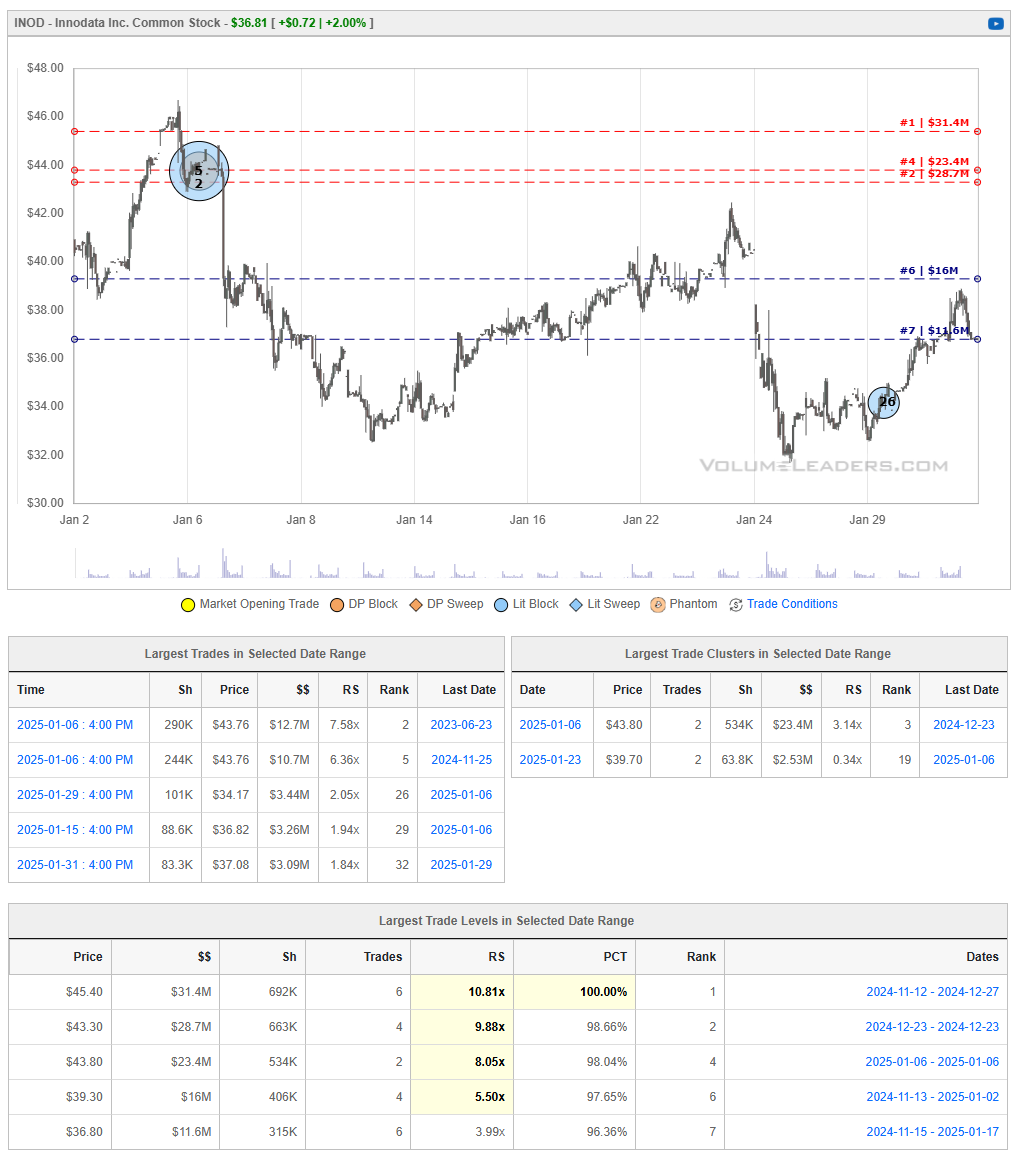
Bullish Perspective:
Record Revenue Growth: In the third quarter of 2024, Innodata reported a 136% year-over-year increase in revenue, indicating strong demand for its data solutions.
Strategic Client Acquisitions: The company secured three new major technology clients in 2024, expanding its customer base and enhancing future revenue potential.
Positive Analyst Outlook: Analysts have set a one-year price target range of $40.00 to $54.00 for INOD, suggesting potential upside from the current price.
Bearish Perspective:
Stock Volatility: INOD has experienced significant price fluctuations, with a 52-week range between $5.46 and $55.17, indicating potential investment risk.
High Valuation Metrics: The company's price-to-earnings ratio stands at 79.47, which may be considered high compared to industry peers.
Market Competition: Operating in the competitive data engineering sector, Innodata faces challenges from other firms offering similar services, which could impact its market share.
In summary, Innodata Inc. has demonstrated impressive revenue growth and strategic client expansion, positioning it well in the data engineering industry. However, investors should be mindful of the stock's volatility, valuation metrics, and competitive landscape when considering an investment.
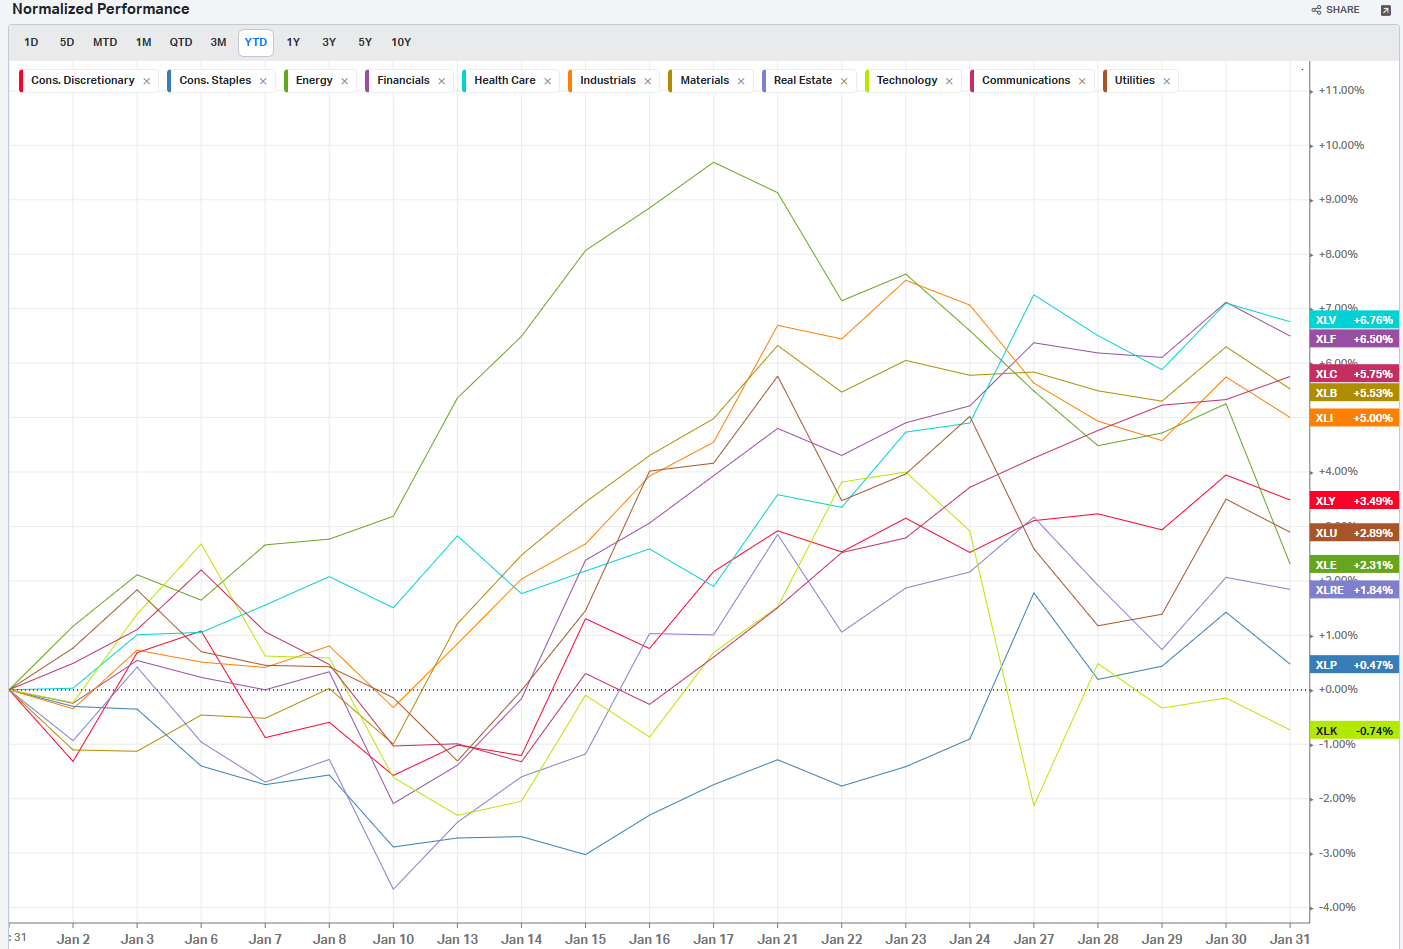
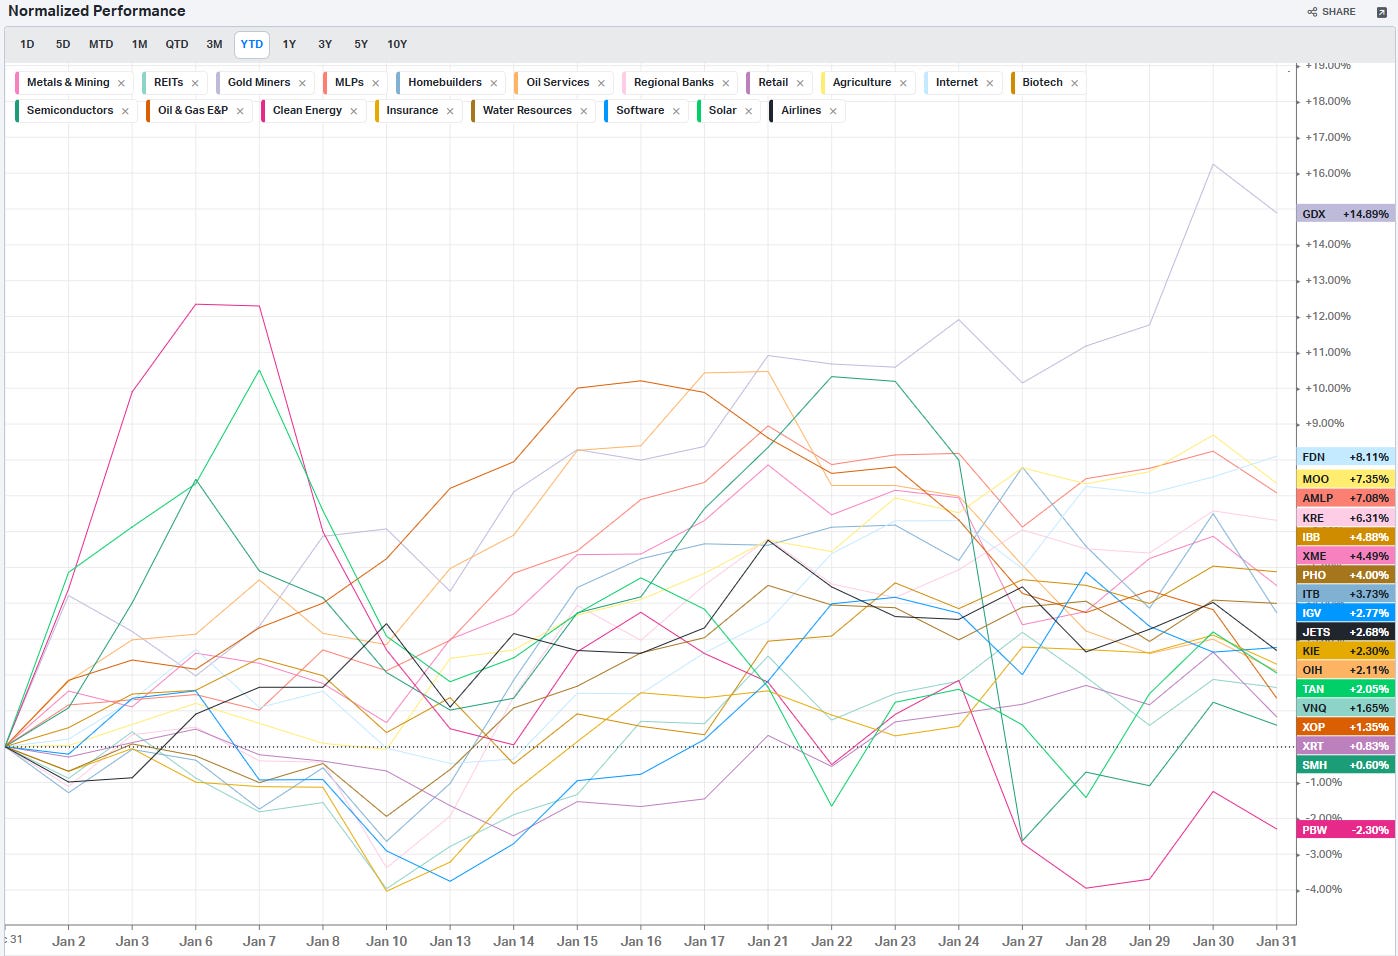
Summary Of Thematic Performance YTD
VolumeLeaders.com provides a lot of pre-built filters for thematics so that you can quickly dive into specific areas of the market. These performance overviews are provided here only for inspiration. Consider targeting leaders and/or laggards in the best and worst sectors, for example.
S&P By Sector
S&P By Industry
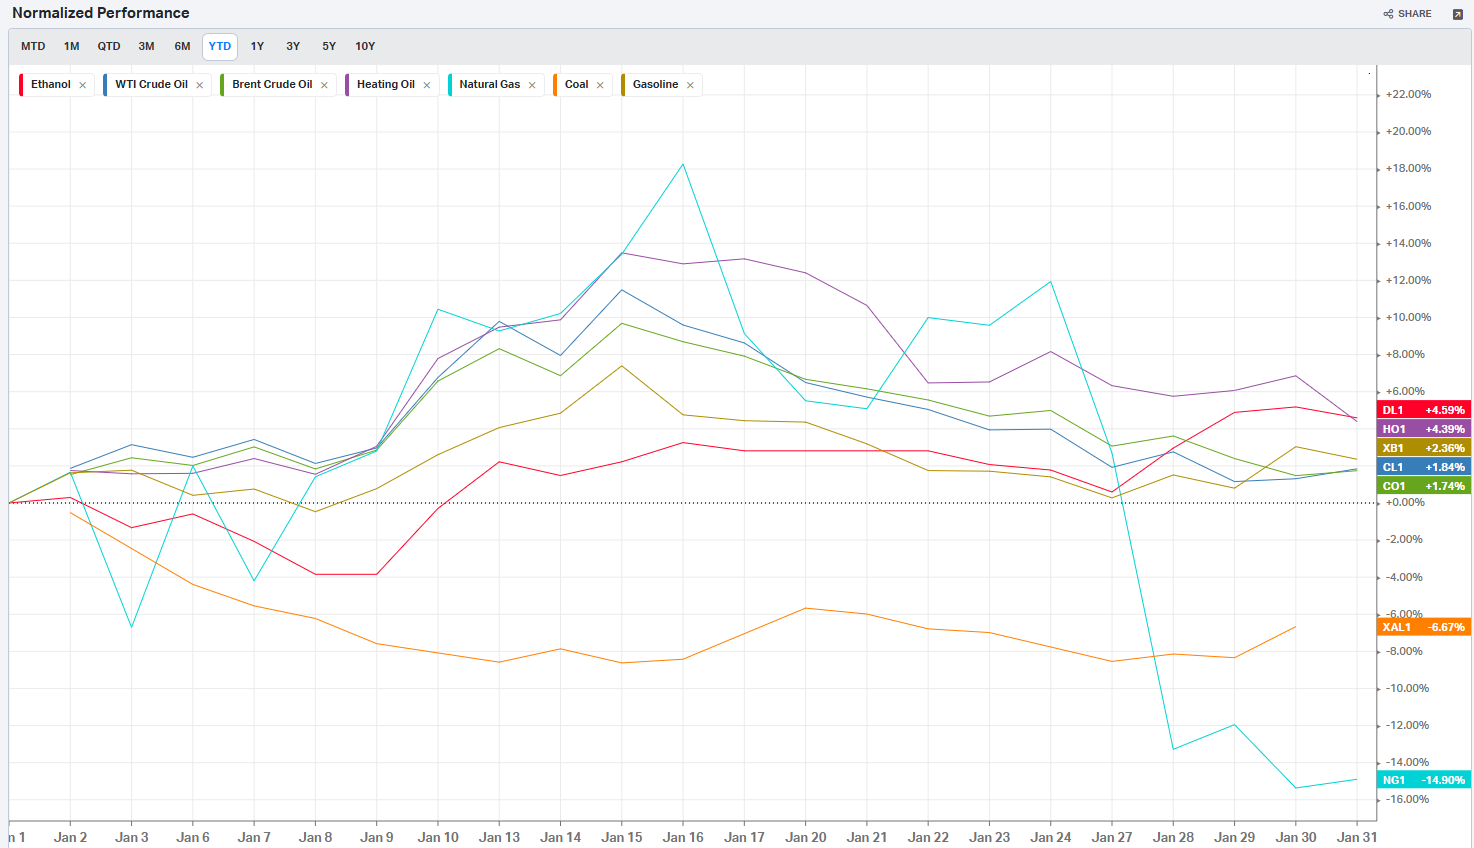
Commodities: Energy
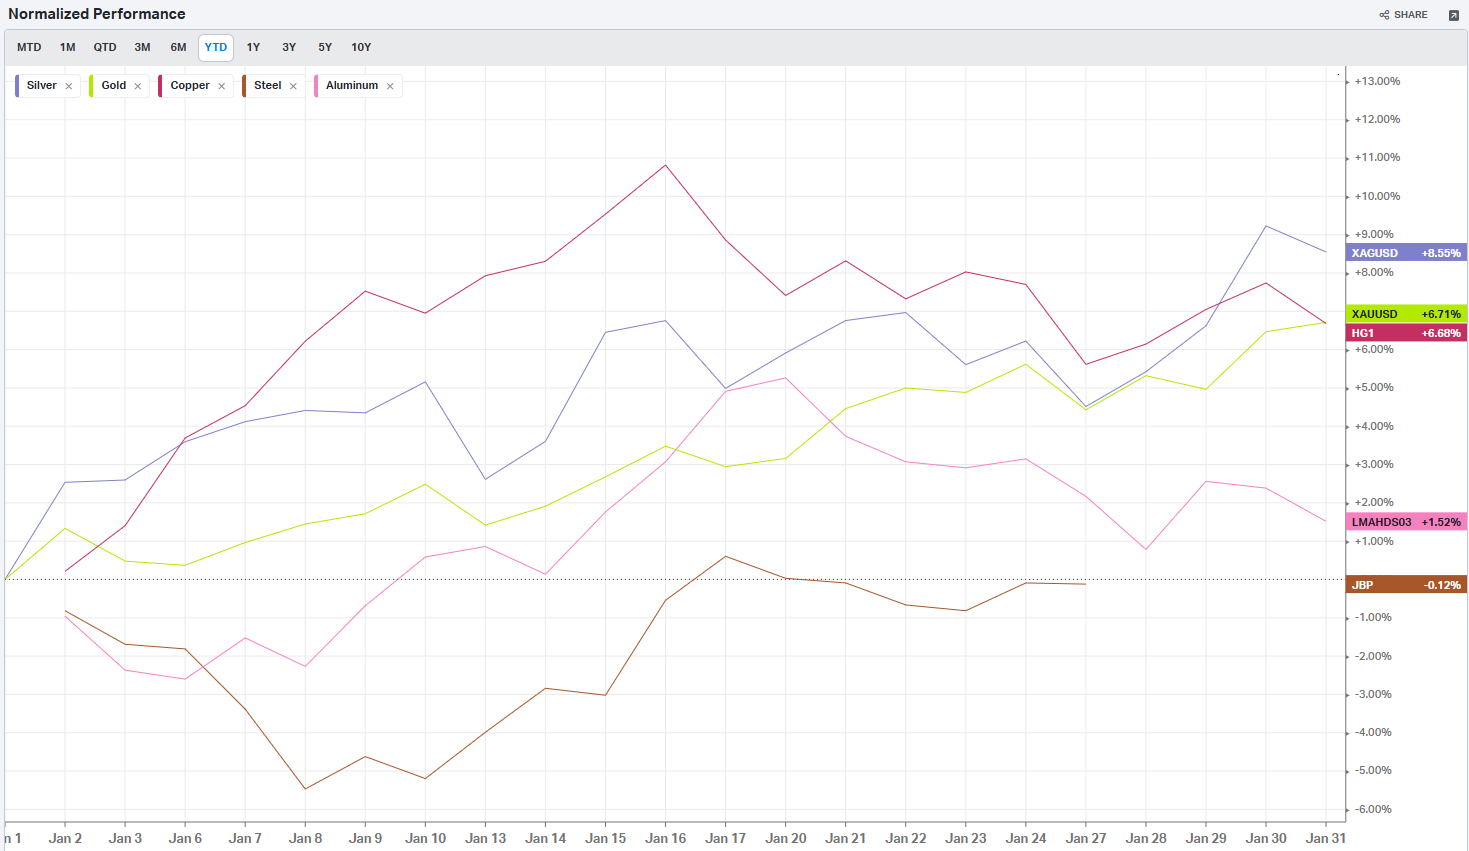
Commodities: Metals
Commodities: Agriculture

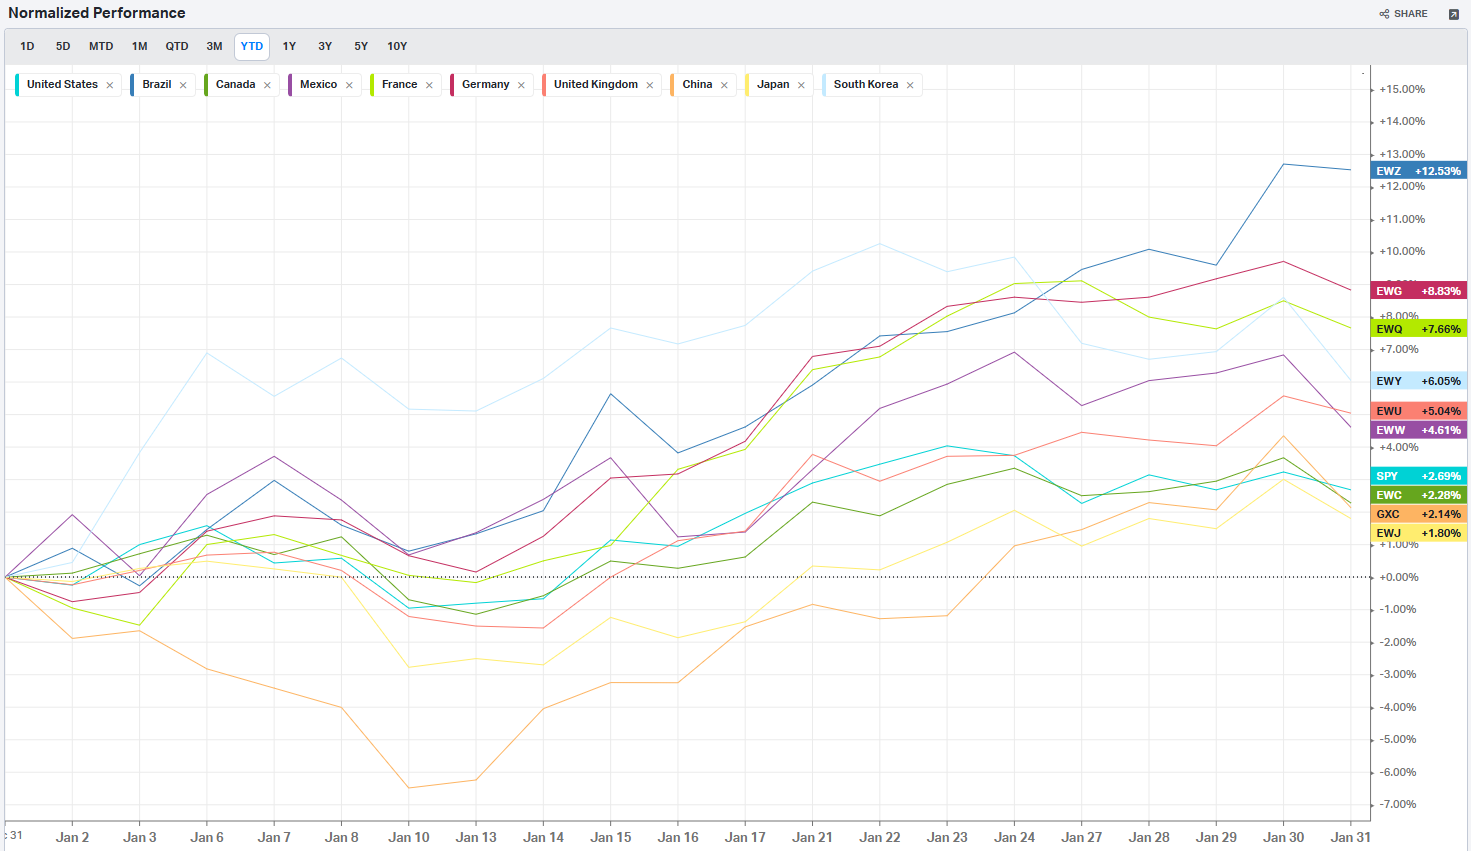
Country ETFs
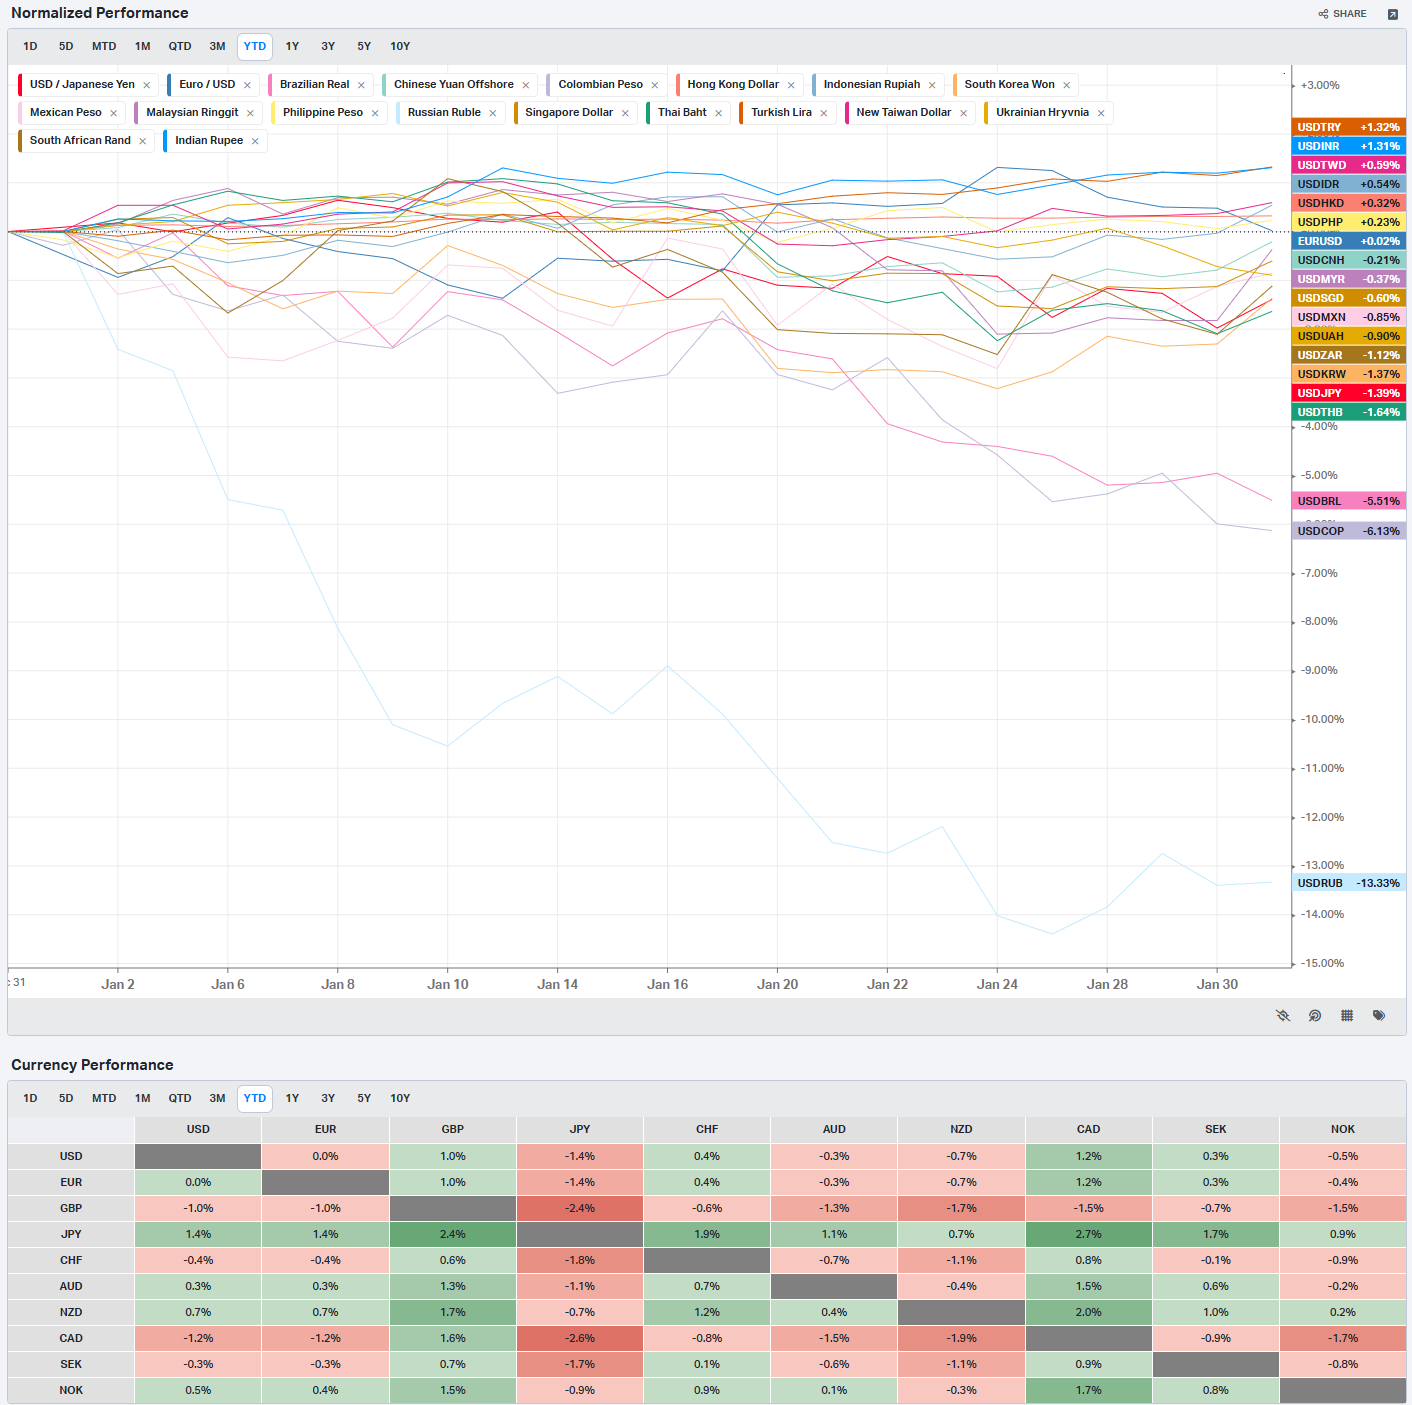
Currencies
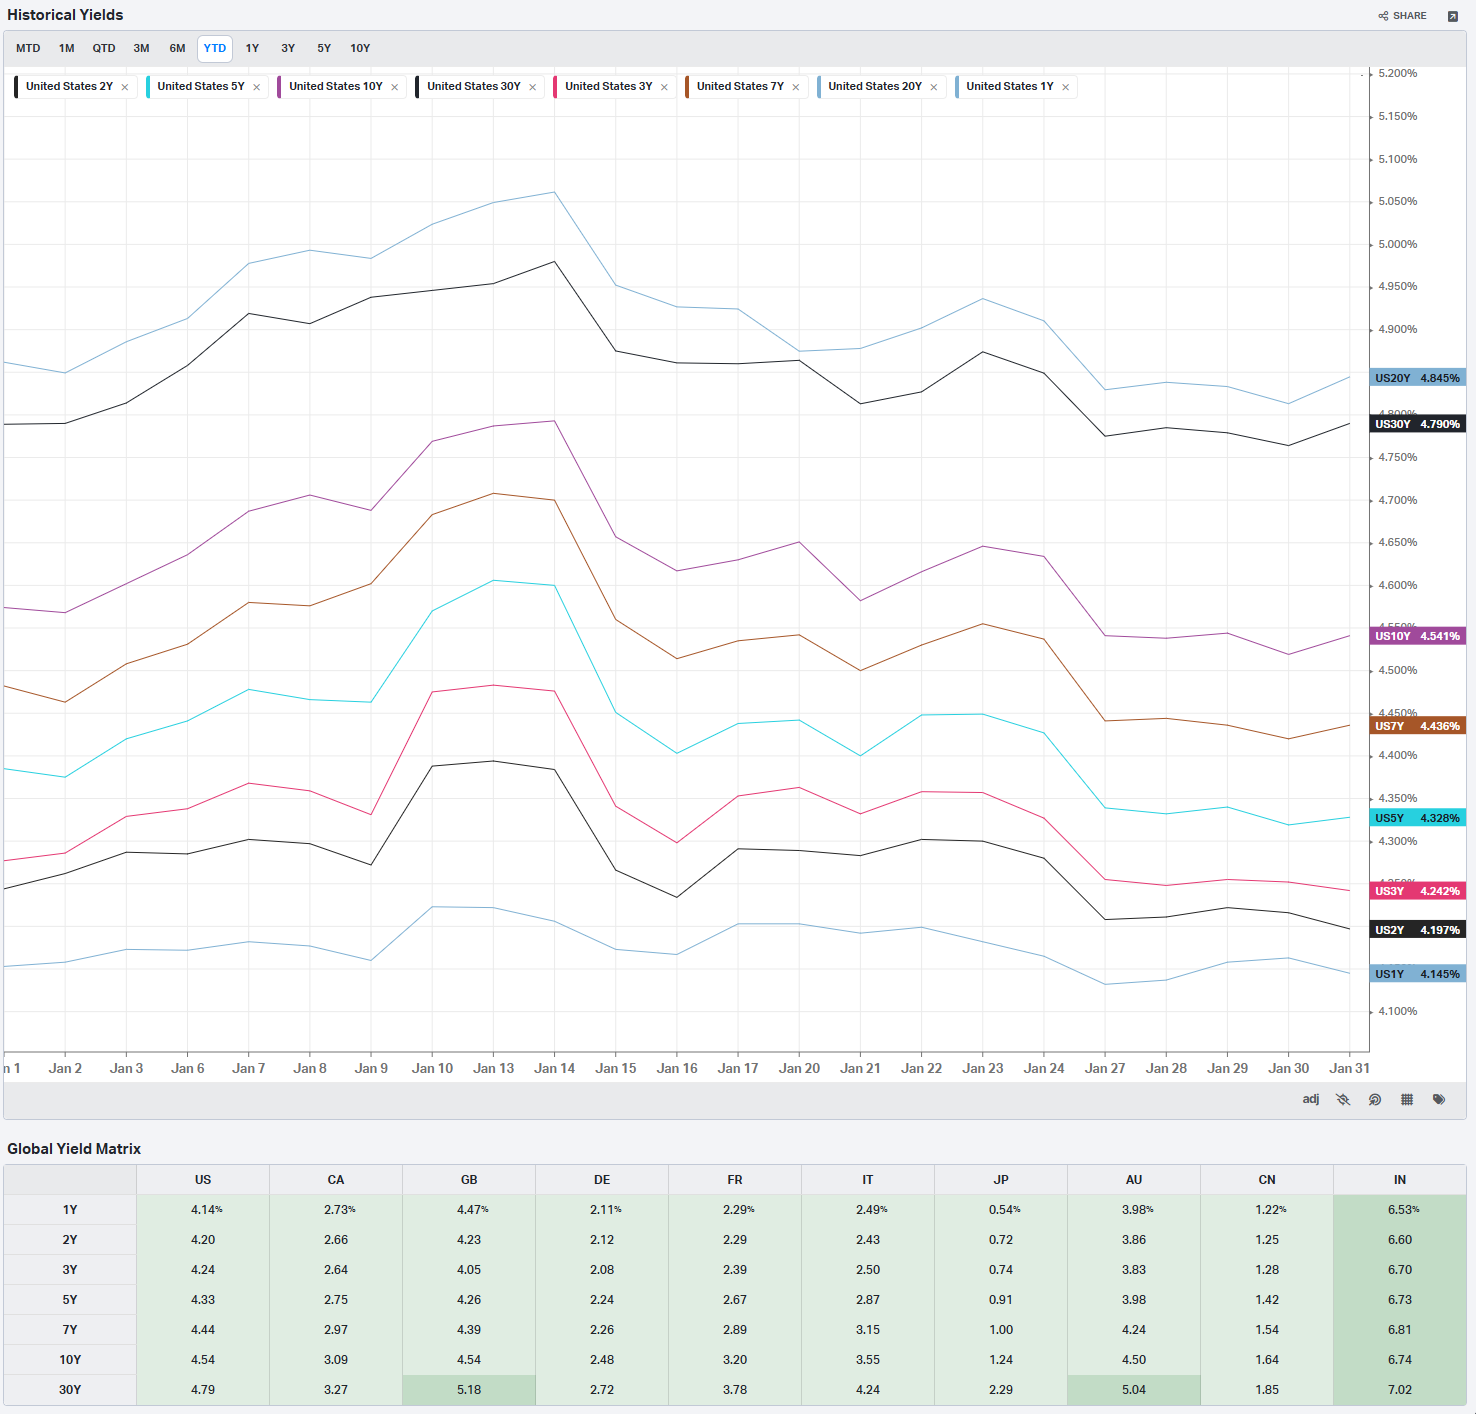
Global Yields
Factors: Style
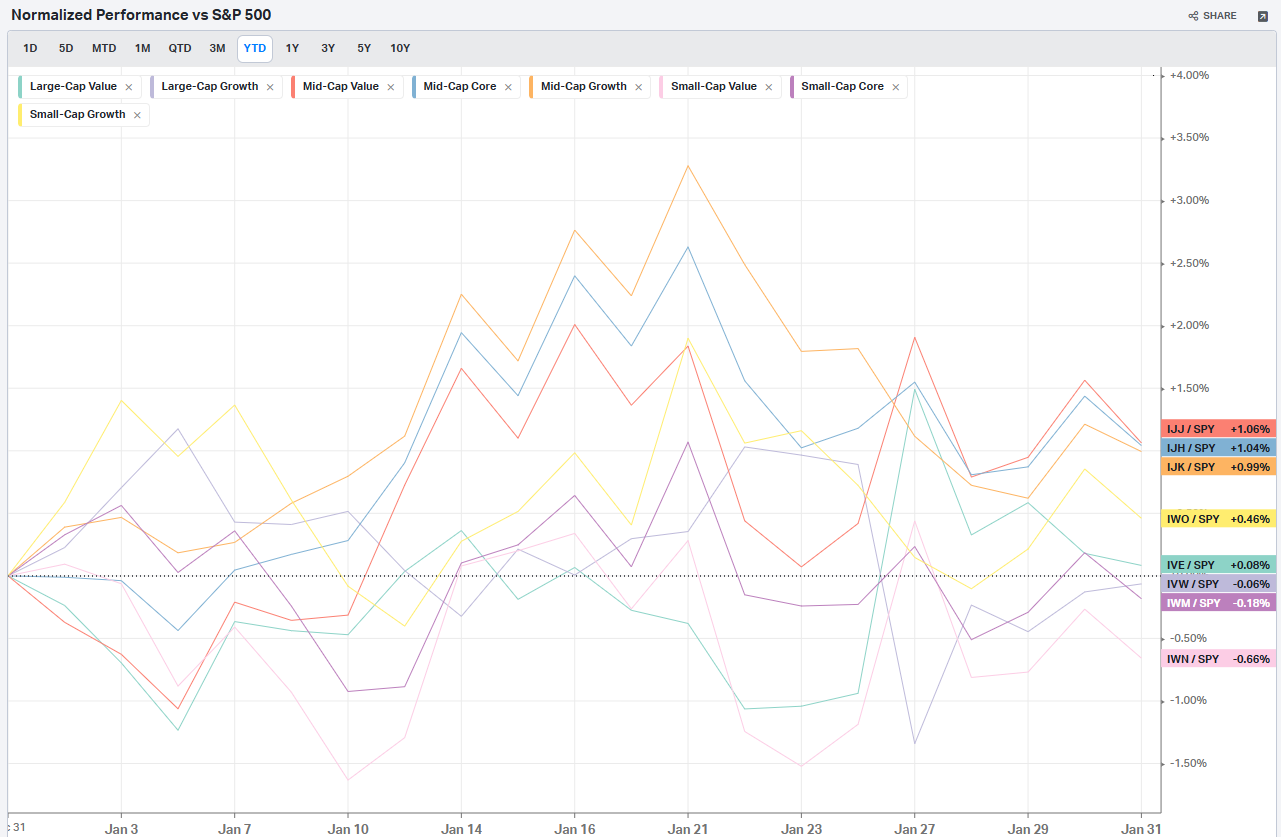
Factors: Size vs Value
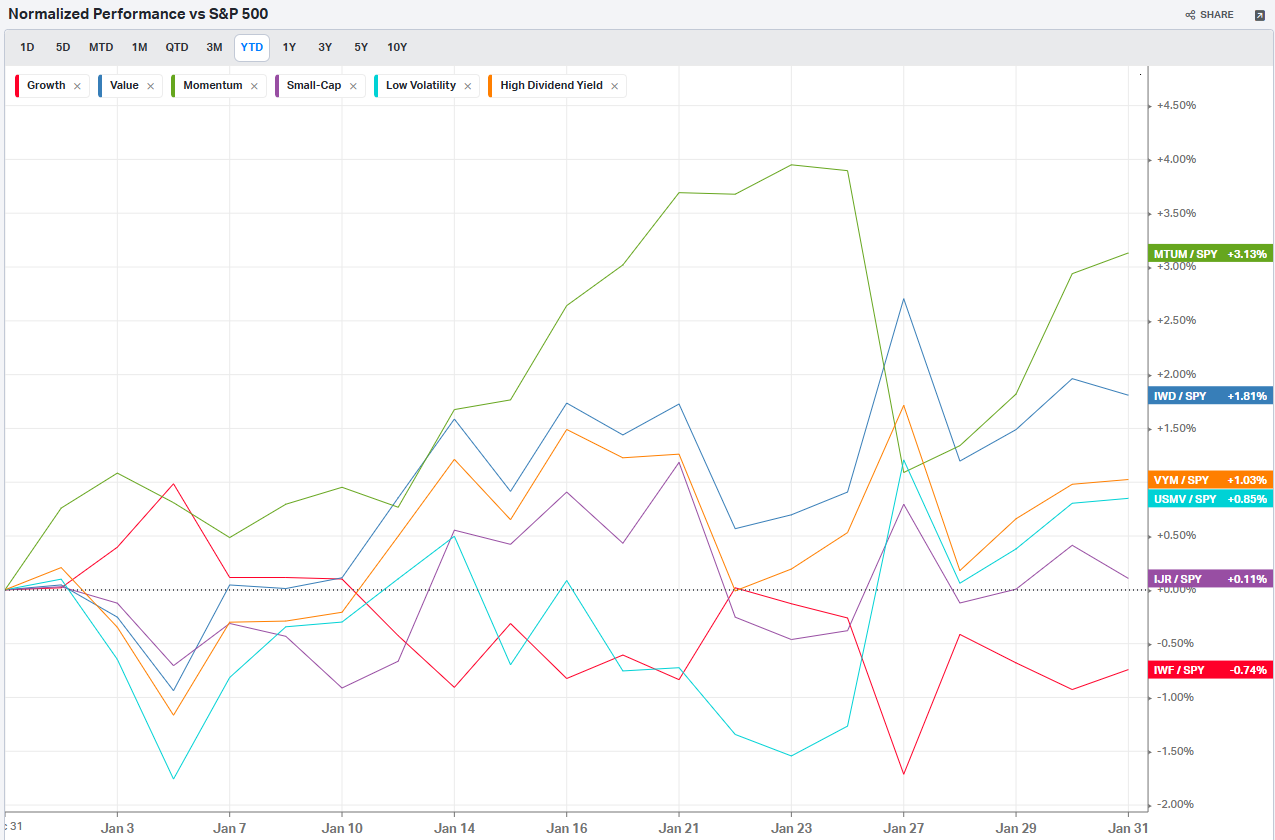
Factors: Qualitative
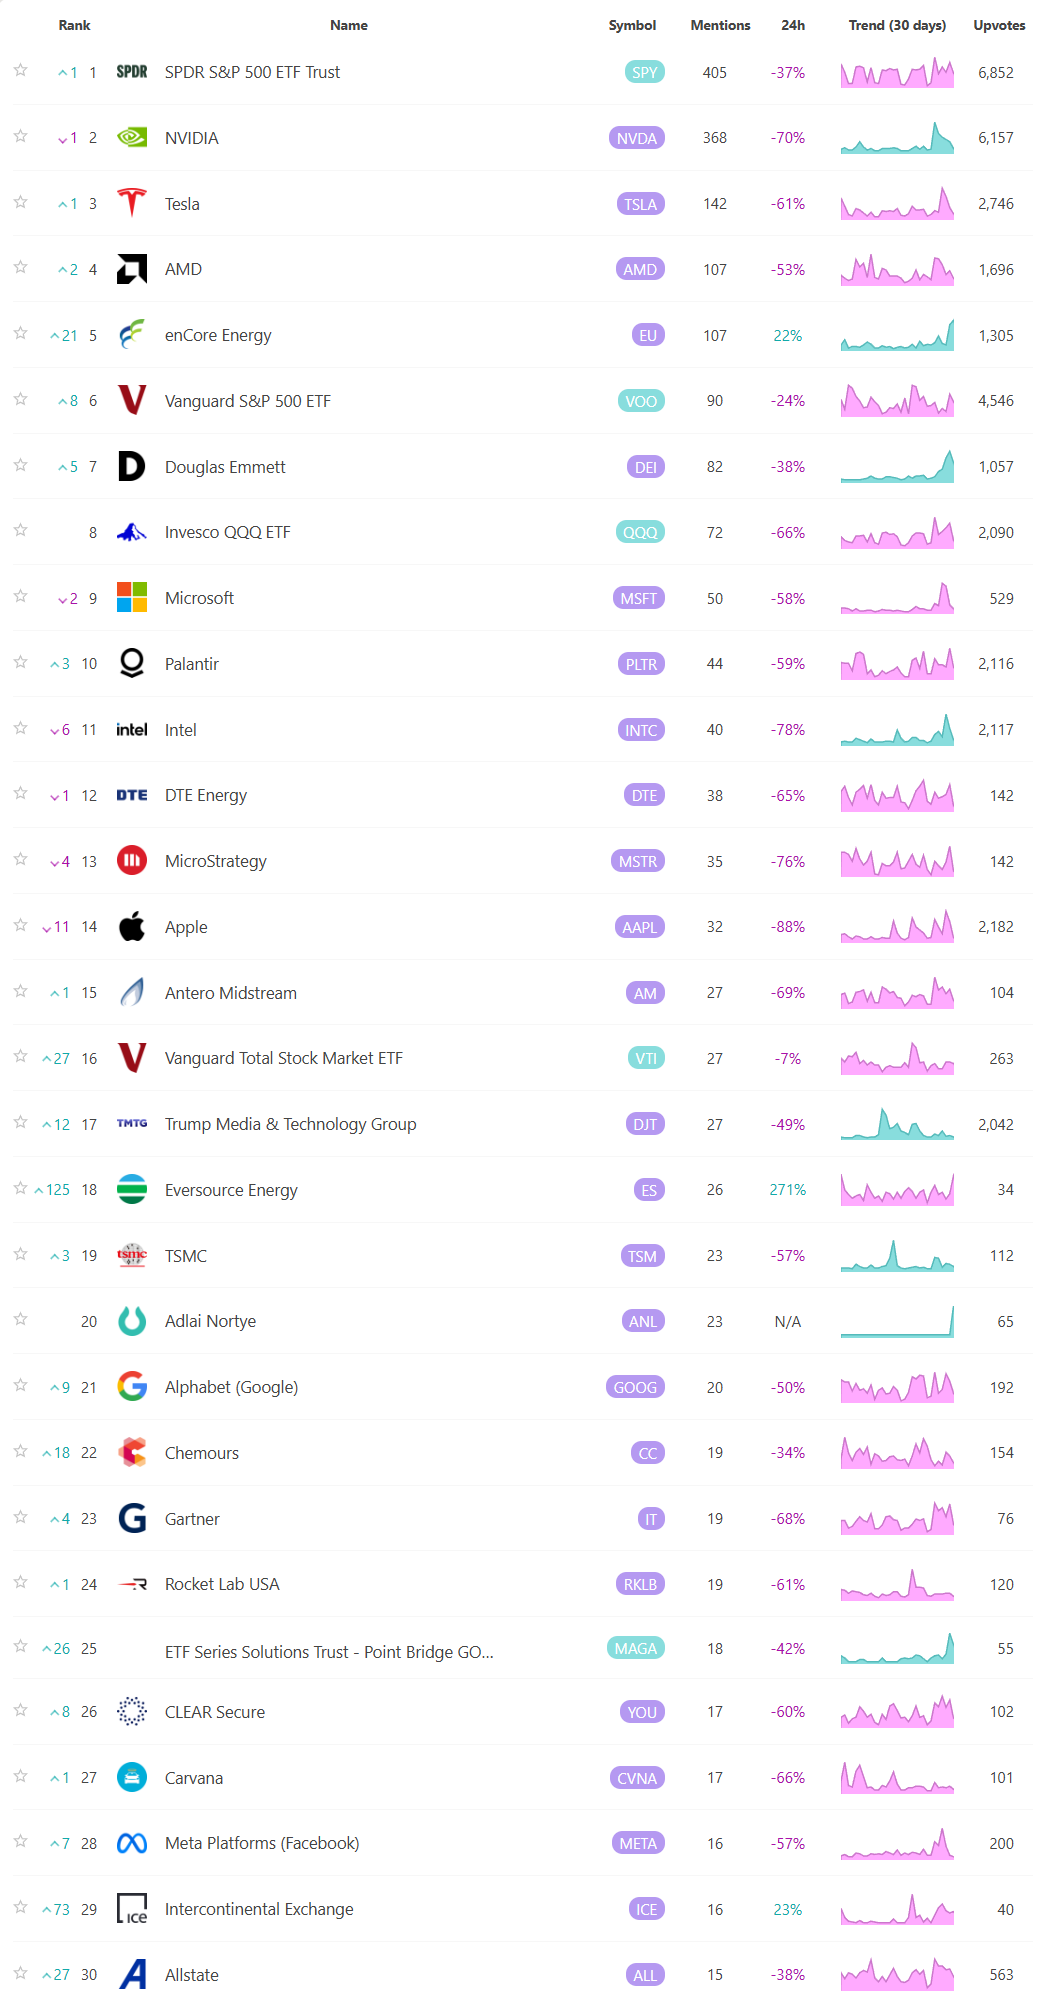
Social Media Favs
Analyzing social sentiment can provide valuable insights for investment strategies by offering a pulse on public perception, mood, and market sentiment that traditional financial indicators might not capture. Here’s how social sentiment analysis can enhance investment decisions:
Market Momentum: Positive or negative social sentiment can signal impending momentum shifts. When public opinion on a stock, sector, or asset class changes sharply, it can create buying or selling pressure, especially if that sentiment becomes widespread.
Early Detection of Trends: Social sentiment data can help investors spot trends before they show up in technical or fundamental data. For example, increased positive chatter around a particular company or sector might indicate growing interest or excitement, which could lead to price appreciation.
Gauge Retail Investor Impact: With the rise of retail investor platforms, collective sentiment on social media can lead to significant price movements (e.g., meme stocks). Understanding how retail investors view certain stocks can help in identifying high-volatility opportunities.
Event Reaction Monitoring: Social sentiment can provide real-time reactions to news events, product releases, or earnings reports. Investors can use this information to gauge market reaction quickly and adjust their strategies accordingly.
Complementing Quantitative Models: By adding a social sentiment layer to quantitative models, investors can enhance predictions. For example, a model that tracks historical price and volume data might perform even better when factoring in sentiment trends as a measure of market psychology.
Risk Management: Negative sentiment spikes can be a signal of potential downturns or increased volatility. By monitoring sentiment, investors might avoid or hedge against investments in companies experiencing a public relations crisis or facing negative perceptions.
Long-Term Sentiment Trends: Sustained sentiment trends, whether positive or negative, often mirror longer-term market cycles. Tracking sentiment trends over time can help identify shifts in investor psychology that could affect longer-term investments or sector rotations.
For these reasons, sentiment analysis, when combined with other tools, can provide a comprehensive view of both immediate market reactions and underlying investor attitudes, helping investors position themselves strategically across various time frames. Here are the most mentioned/discussed tickers on Reddit from some of the most active Subreddits for trading:
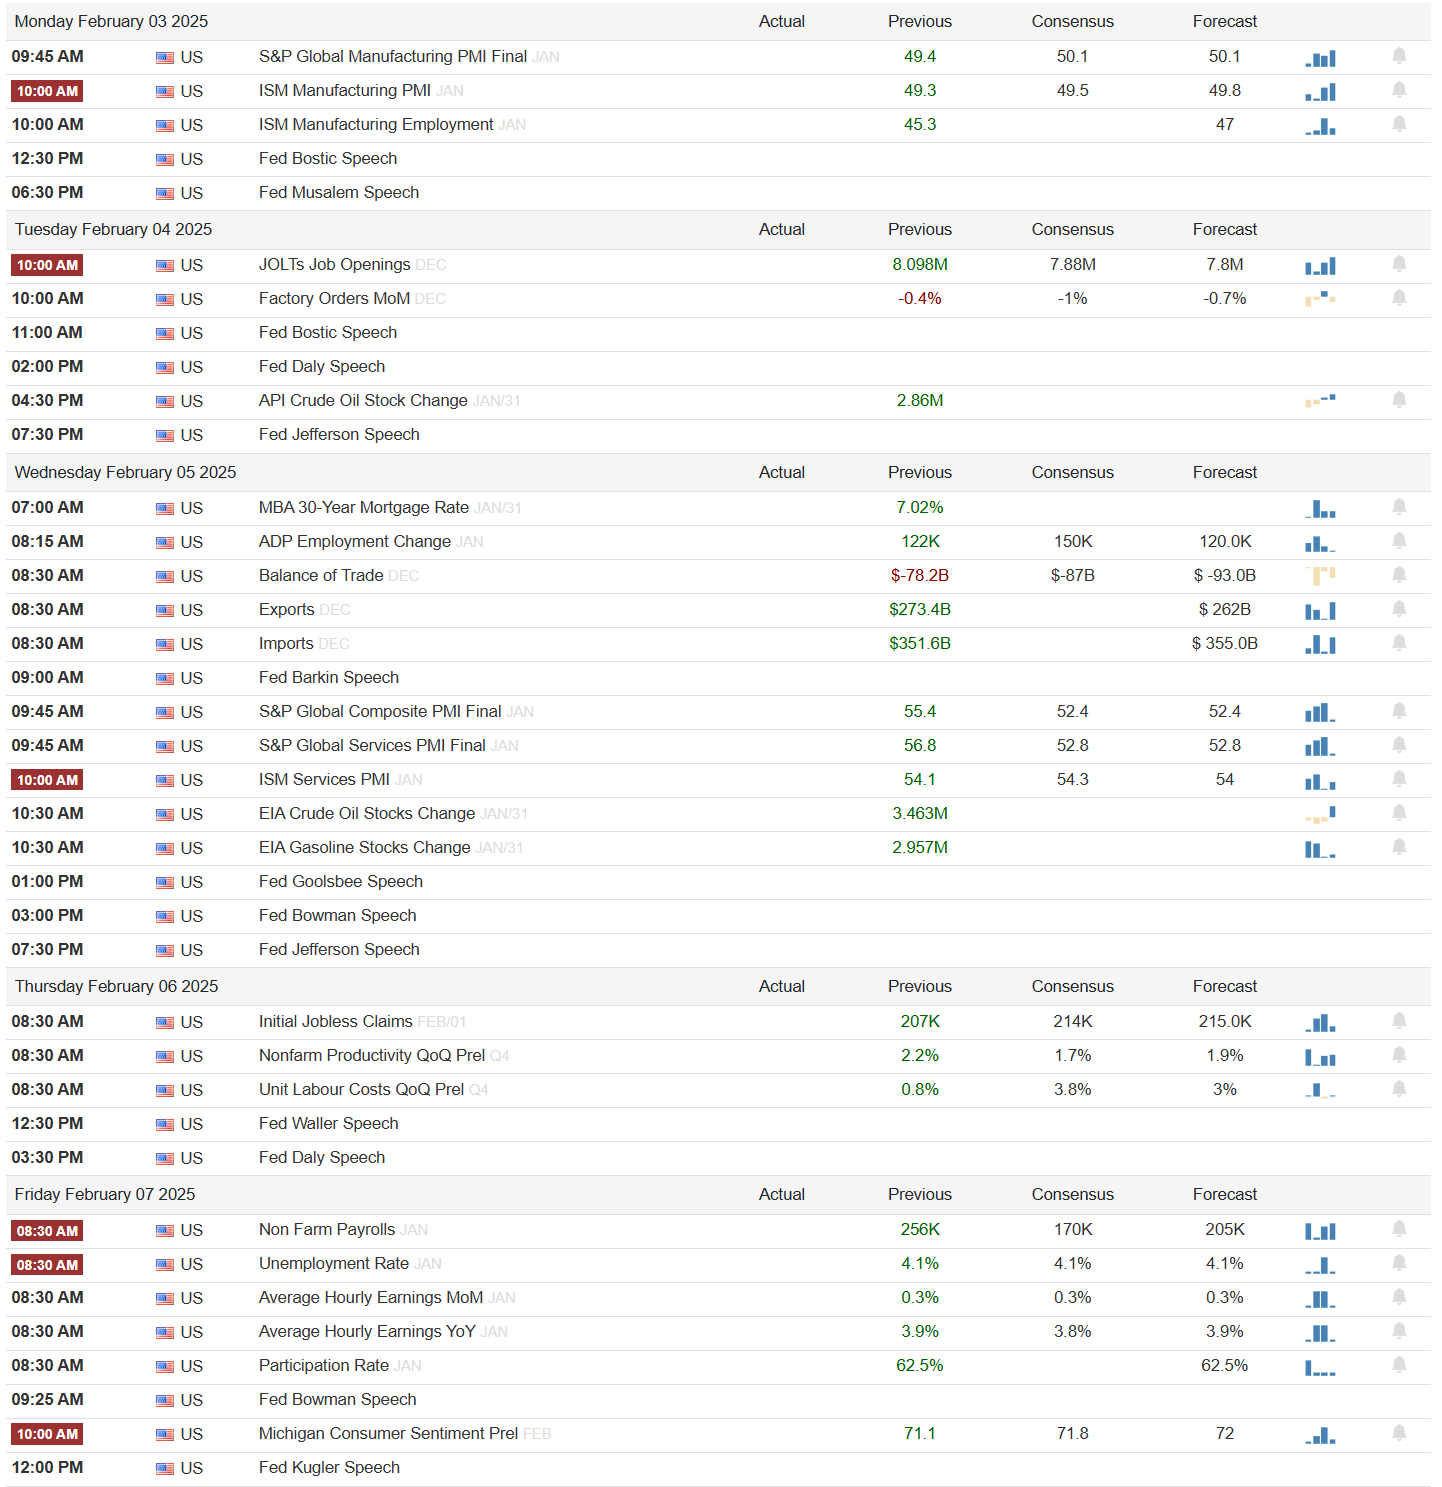
Events On Deck This Week
Here are key events happening this week that have the potential to cause outsized moves in the market or heightened short-term volatility.
Econ Events By Day of Week
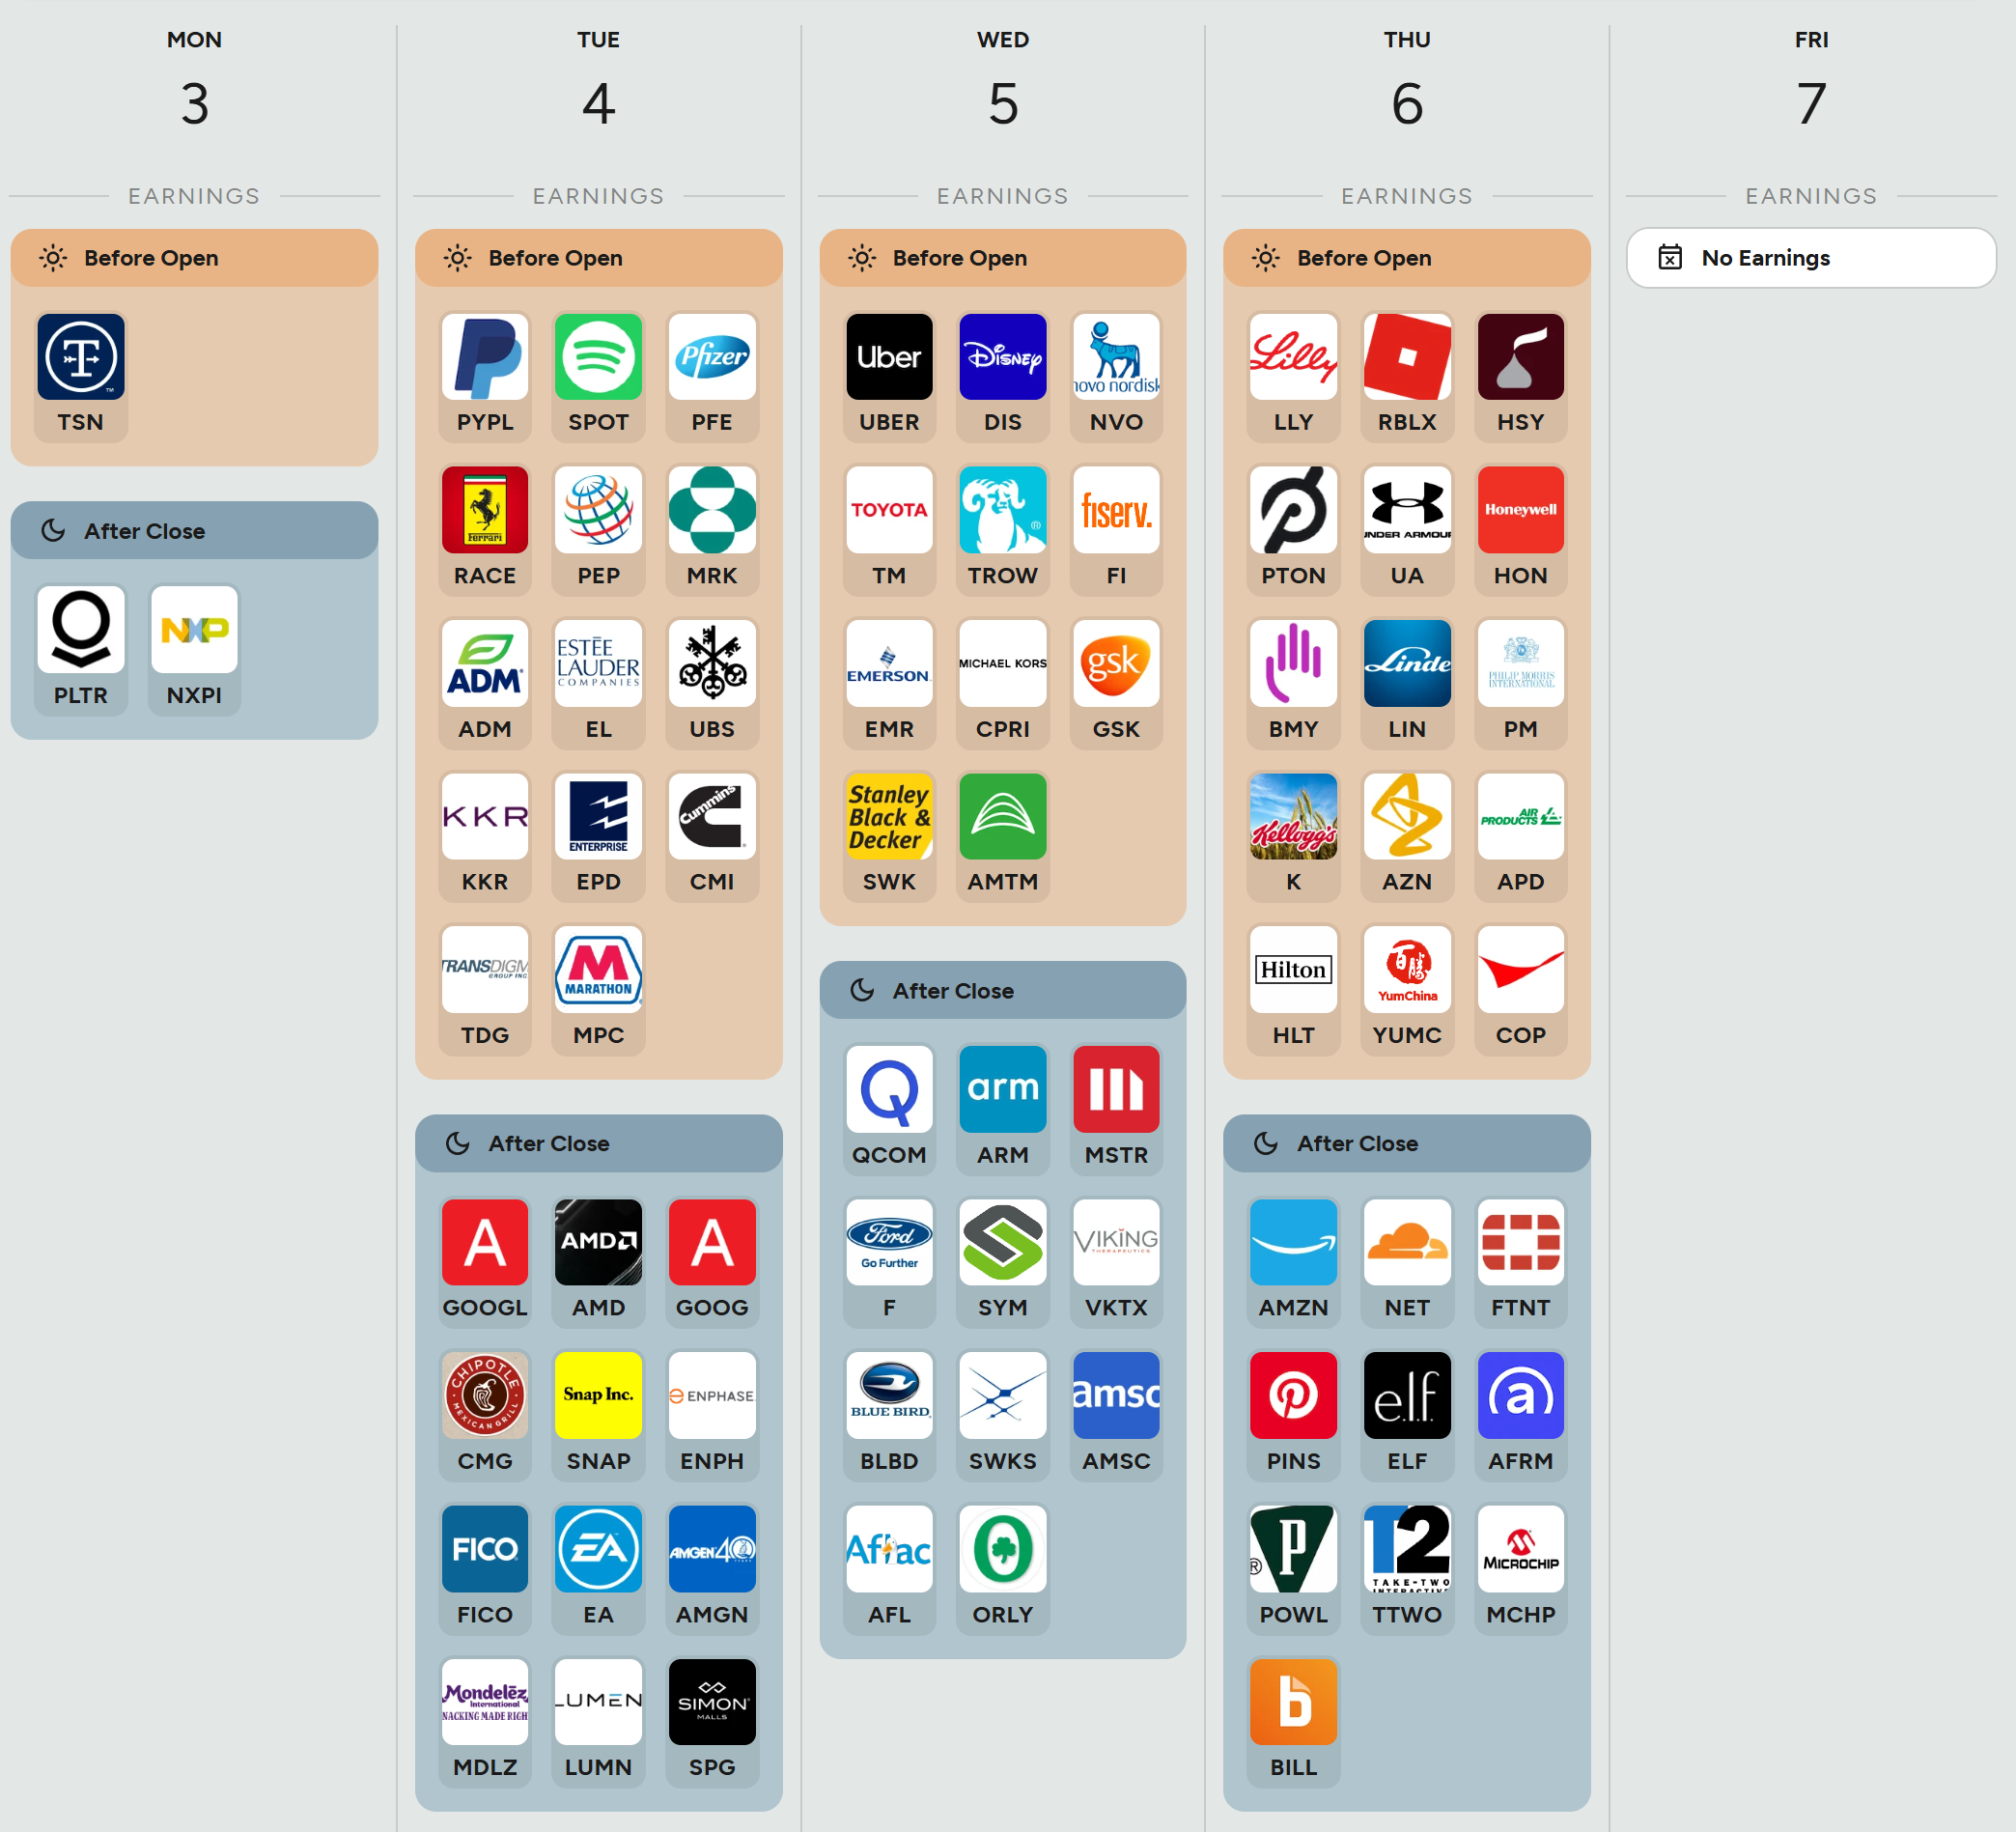
Anticipated Earnings By Day of Week
Thank you for being part of our community and for taking the time to read this publication. Your engagement and insights mean a great deal to all of us, and we're genuinely grateful to share this space with such dedicated and thoughtful readers. Wishing you a productive and successful week ahead in the markets. May the coming days bring clarity and great opportunities. Happy trading!