Market Momentum: Your Weekly Financial Forecast & Market Prep
Issue 28 / What to expect Jan 13, 2025 thru Jan 17, 2025

In This Issue
Market-On-Close: All of last week’s market-moving news and macro context in under 5 minutes + futures-snapshots
Special Coverage: Getting Defensive with Personal Portfolios in a Volatile Environment
The Latest Investor Sentiment Readings
Institutional Support & Resistance Levels For Major Indices: Exactly where to look for support and resistance this week in SPY, QQQ, IWM & DIA
Institutional Activity By Sector: Institutional order flow by sector including the top institutionally-backed names in those sectors. We break it all down and provide the key insights and take-aways you need to navigate institutional positioning this week.
Top Institutional Order Flow In Individual Names: All of the largest sweeps and blocks on lit exchanges and hidden dark pools
Investments In Focus: Bull vs Bear arguments for FVRR, HDB, RDY, VV, RGTI, SAP
Top Institutionally-Backed Gainers & Losers: An explosive watchlist for day traders seeking high-volatility
Normalized Performance By Thematics YTD (Sector, Industry, Factor, Energy, Metals, Currencies, and more): which corners of the markets are beating benchmarks, which ones are overlooked and which ones are over-crowded
Key Econ Events and Earnings On-Deck For This Week

Market-On-Close
Shifting Tides: U.S. Financial Markets Face Reality Check Amid Strong Economic Data
The second week of January 2025 has delivered a stark reality check to financial markets, forcing investors to confront a fundamental disconnect between their optimistic rate cut expectations and the persistent strength of the U.S. economy. As major indices retreated from their recent highs, with the S&P 500 and Dow Jones Industrial Average both falling to two-month lows, the market narrative has shifted dramatically from when the Federal Reserve might cut rates to whether such cuts are even warranted in the current economic environment.

The catalyst for this reassessment came from Friday's remarkably robust employment report, which showed the U.S. economy added 256,000 jobs in December, substantially exceeding consensus expectations of 165,000. This demonstration of labor market resilience, coupled with an unexpected drop in the unemployment rate to 4.1%, has complicated the Federal Reserve's path forward. While strong employment typically signals economic health, in the current context it presents a complex challenge for monetary policy makers attempting to navigate the final mile of their inflation fight.

The market's reaction to this strong economic data was swift and decisive. Treasury yields surged, with the benchmark 10-year yield climbing to 4.786%, its highest level in 14 months. This sharp move in yields reflects a fundamental repricing of rate cut expectations, with market participants now discounting the probability of a January rate cut to a mere 3%. The ripple effects of this reassessment were felt across asset classes, leading to particularly pronounced weakness in growth stocks and other rate-sensitive sectors.
Adding to these concerns, the University of Michigan's consumer sentiment survey revealed a troubling uptick in inflation expectations. The jump in both short-term and long-term inflation expectations to 3.3% suggests that despite the Federal Reserve's aggressive tightening campaign, inflationary pressures may be becoming more deeply entrenched in economic behavior and expectations. This development is particularly worrisome for Federal Reserve officials, who view inflation expectations as a crucial indicator of their policy effectiveness.
The technology sector, which had led the market's recent advance, faced additional headwinds beyond just higher rates. Reports that the Biden administration is considering new restrictions on AI chip sales introduced another layer of uncertainty for semiconductor stocks. Industry leaders like Nvidia and AMD saw their shares decline significantly, with AMD facing additional pressure from a Goldman Sachs downgrade. This regulatory uncertainty, combined with elevated valuations and rising yields, has caused investors to reassess their positioning in the sector that had been the market's primary driver.
However, not all sectors succumbed to the selling pressure. Energy stocks demonstrated relative strength as crude oil prices reached three-month highs. Companies like Coterra Energy, Devon Energy, and Diamondback Energy posted gains exceeding 2%, suggesting that investors are beginning to position for a potential environment of sustained economic strength rather than the slower growth scenario that had been previously priced into markets.
The fixed income markets have perhaps seen the most dramatic shift in sentiment. Beyond the move in Treasury yields, corporate bond spreads have widened, reflecting growing concern about the impact of higher-for-longer rates on corporate borrowing costs. The international bond markets have not been immune to these pressures, with German bund yields reaching six-month highs and UK gilt yields touching levels not seen in decades.
This market environment marks a significant departure from the euphoric conditions that characterized the end of 2024. The combination of strong economic data and persistent inflation concerns has forced investors to confront the possibility that the Federal Reserve's restrictive monetary policy stance may need to remain in place longer than previously anticipated. This reassessment is occurring against a backdrop of historically high valuations, particularly in the technology sector, creating a potentially volatile mix for markets.
Looking ahead, several key catalysts could determine the market's direction in the coming weeks. The start of fourth-quarter earnings season will provide crucial insight into corporate America's ability to maintain profitability in a higher-rate environment. The upcoming Consumer Price Index report will be closely watched for signs of whether December's strong wage growth is translating into broader inflationary pressures. Additionally, markets will be particularly attuned to any shifts in Federal Reserve communication that might signal a change in their policy stance.

For investors, this environment demands a more nuanced approach than the relatively straightforward strategies that worked in 2024. The market's reaction to strong economic data suggests that good news for the economy might not necessarily translate into good news for asset prices, particularly if it leads to a longer period of restrictive monetary policy. This dynamic argues for increased attention to valuation and quality factors in portfolio construction.
The recent market action also highlights the importance of maintaining appropriate diversification across sectors and asset classes. While technology stocks have dominated returns in recent years, the current environment may favor a broader approach that includes exposure to both growth and value sectors. The strong performance of energy stocks amid market weakness serves as a reminder that different sectors can provide valuable portfolio diversification benefits in changing market conditions.
The fixed income market's dramatic moves suggest that bonds may finally be returning to their traditional role as a source of both income and potential portfolio protection. The higher yields now available across the fixed income spectrum offer investors more attractive entry points, though careful attention to duration risk remains warranted given the uncertain path of monetary policy.
As we progress through 2025, markets appear to be entering a new phase where the easy assumptions about Federal Reserve policy and market direction that characterized much of 2024 are being challenged. This environment demands a more disciplined approach to investment decision-making, with increased attention to fundamentals, valuation, and risk management. While the strong economic data suggests the U.S. economy remains on solid footing, the path forward for markets may be more challenging than many investors had anticipated at the start of the year.
The coming weeks will be crucial in determining whether the current market weakness represents a healthy correction in an ongoing bull market or the start of a more significant adjustment to higher-for-longer interest rates. Either way, investors would be wise to prepare for an environment of increased volatility as markets digest the implications of continued economic strength and its impact on monetary policy expectations.
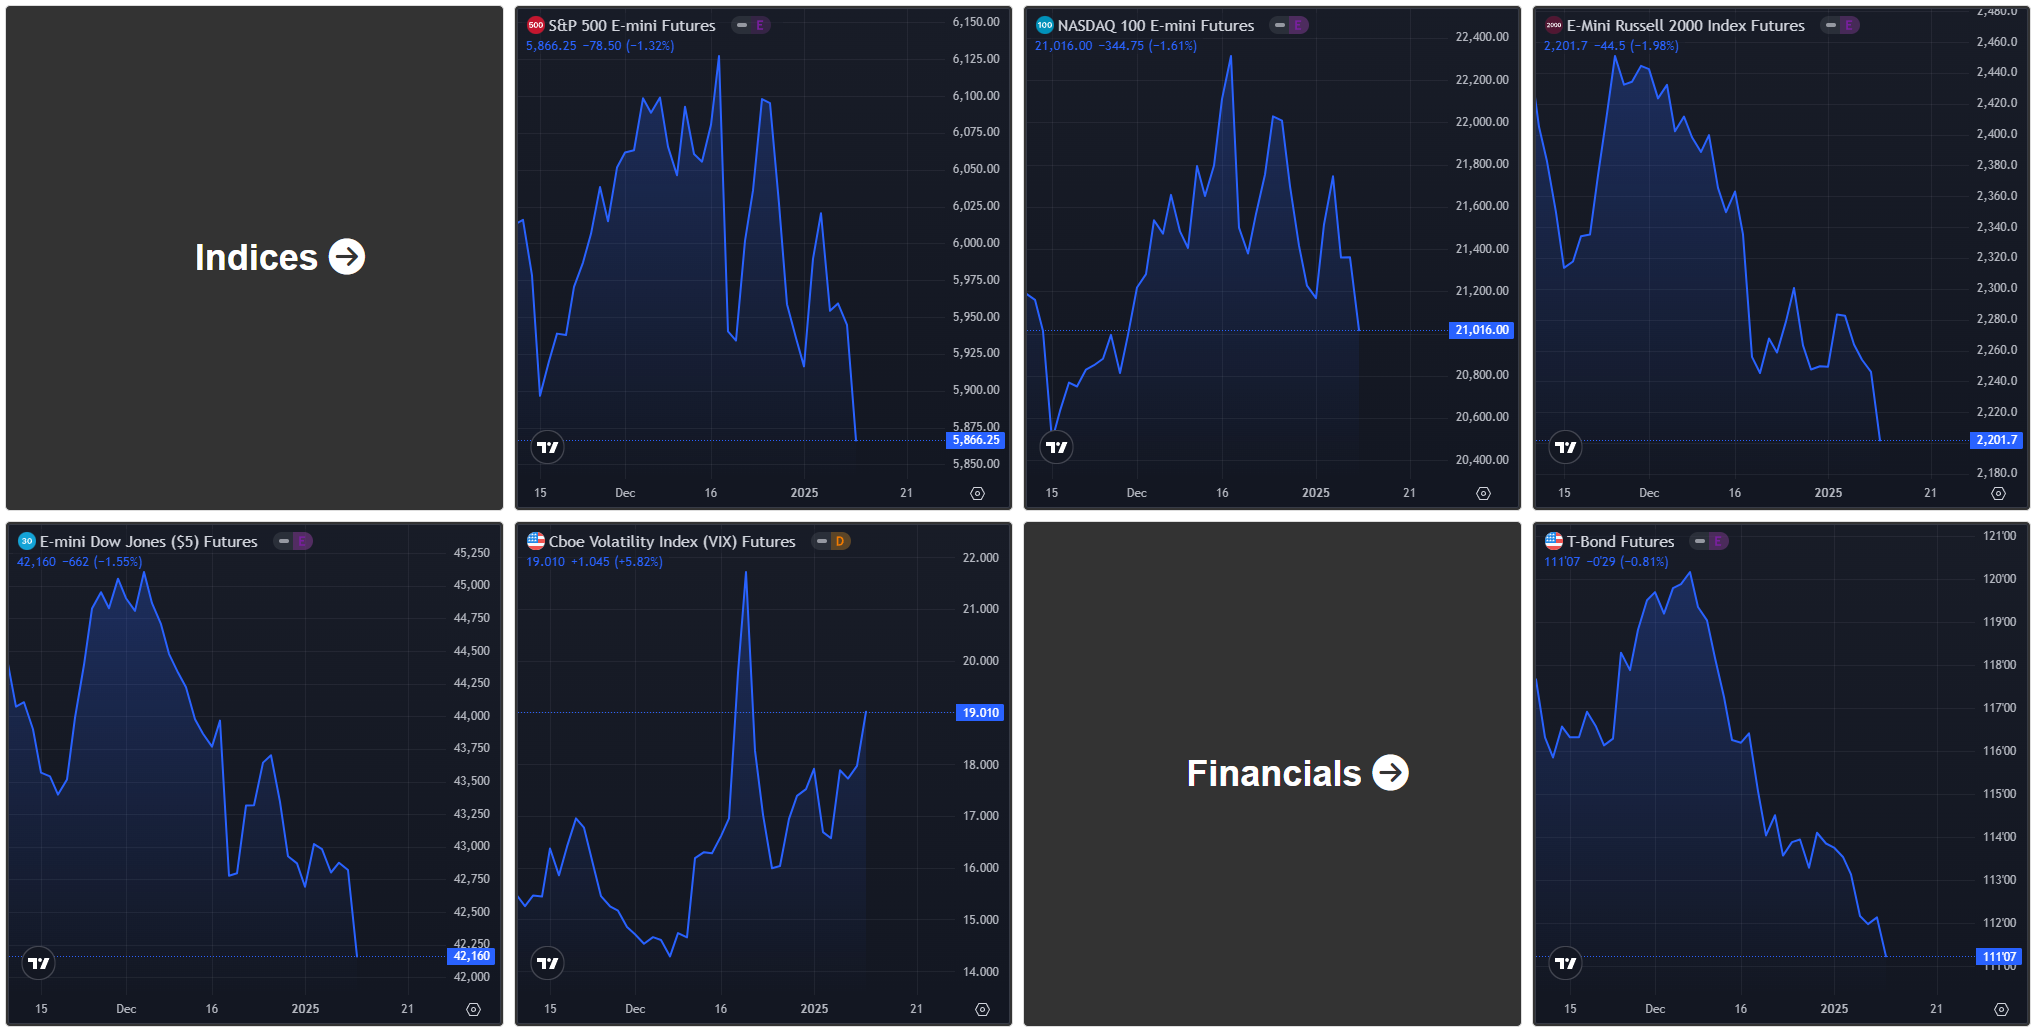
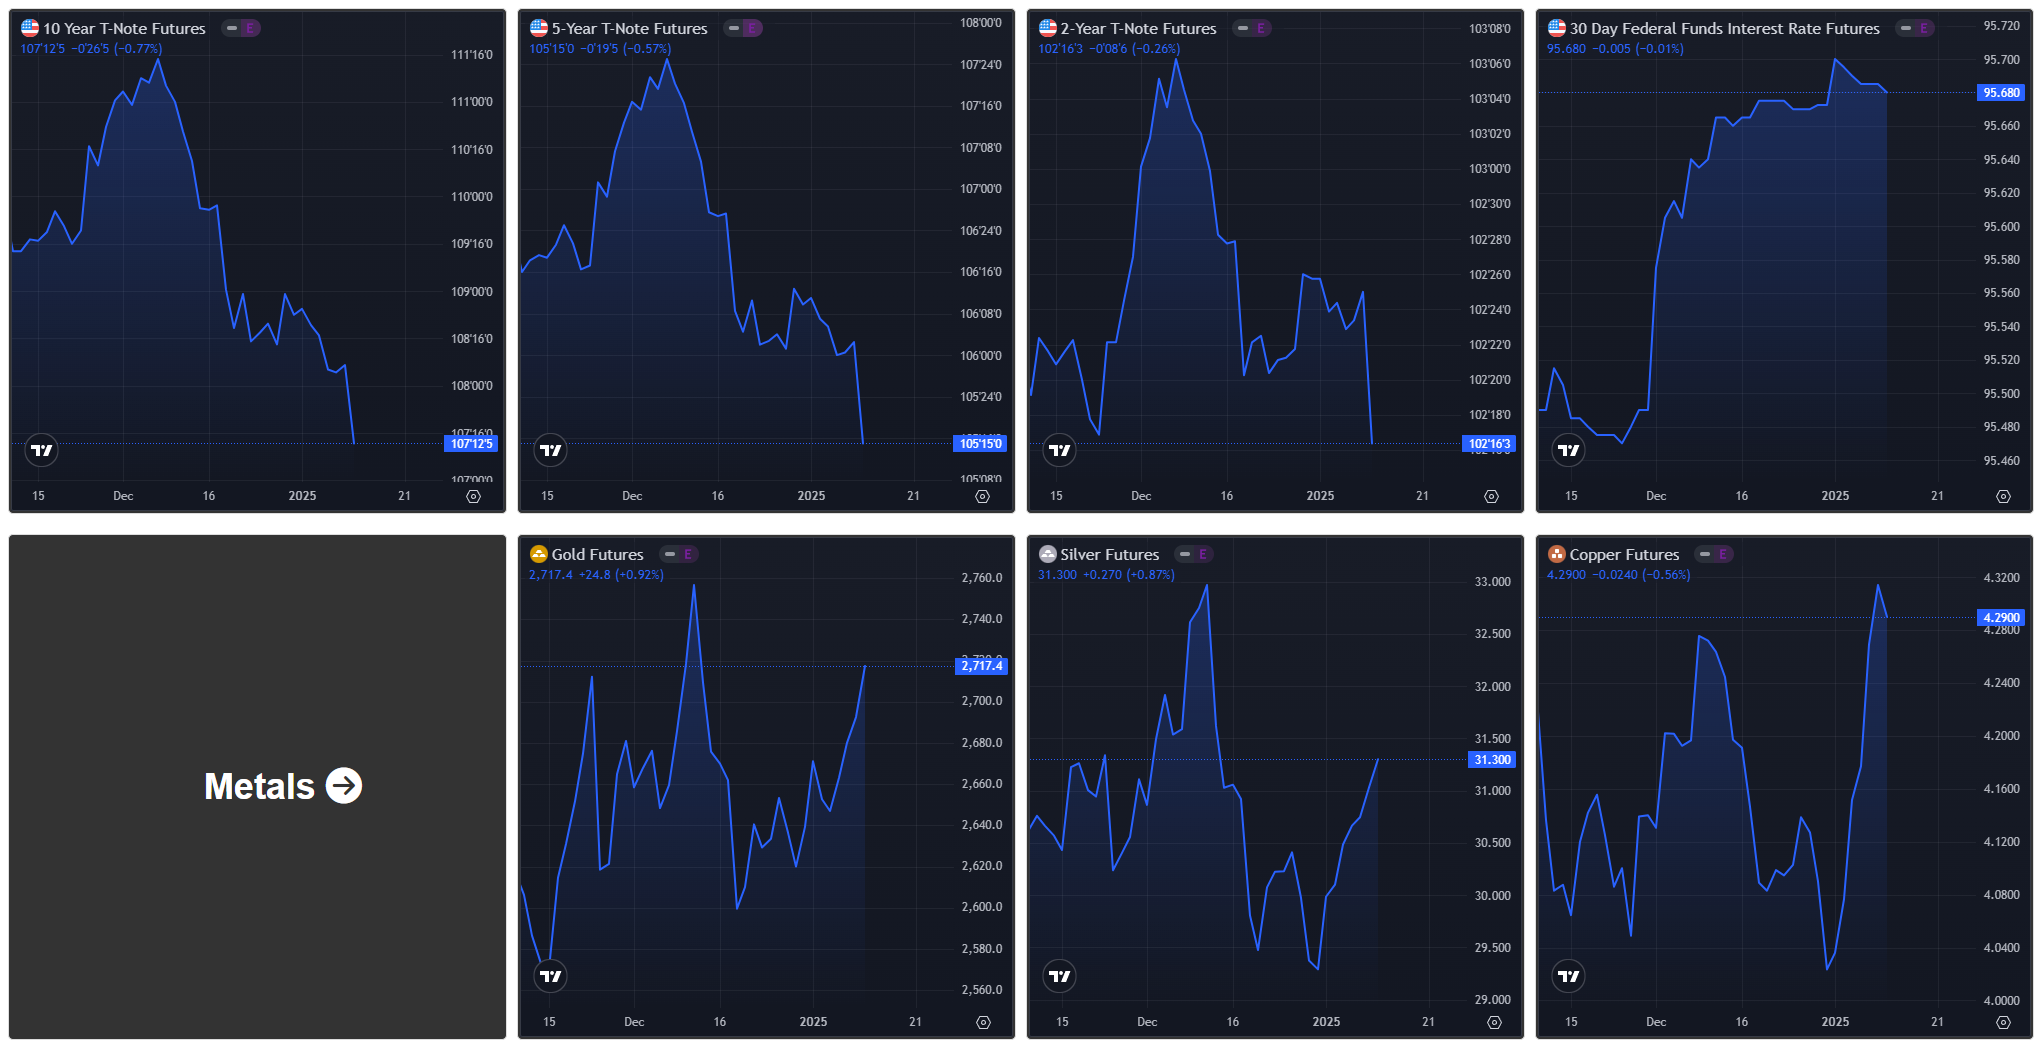
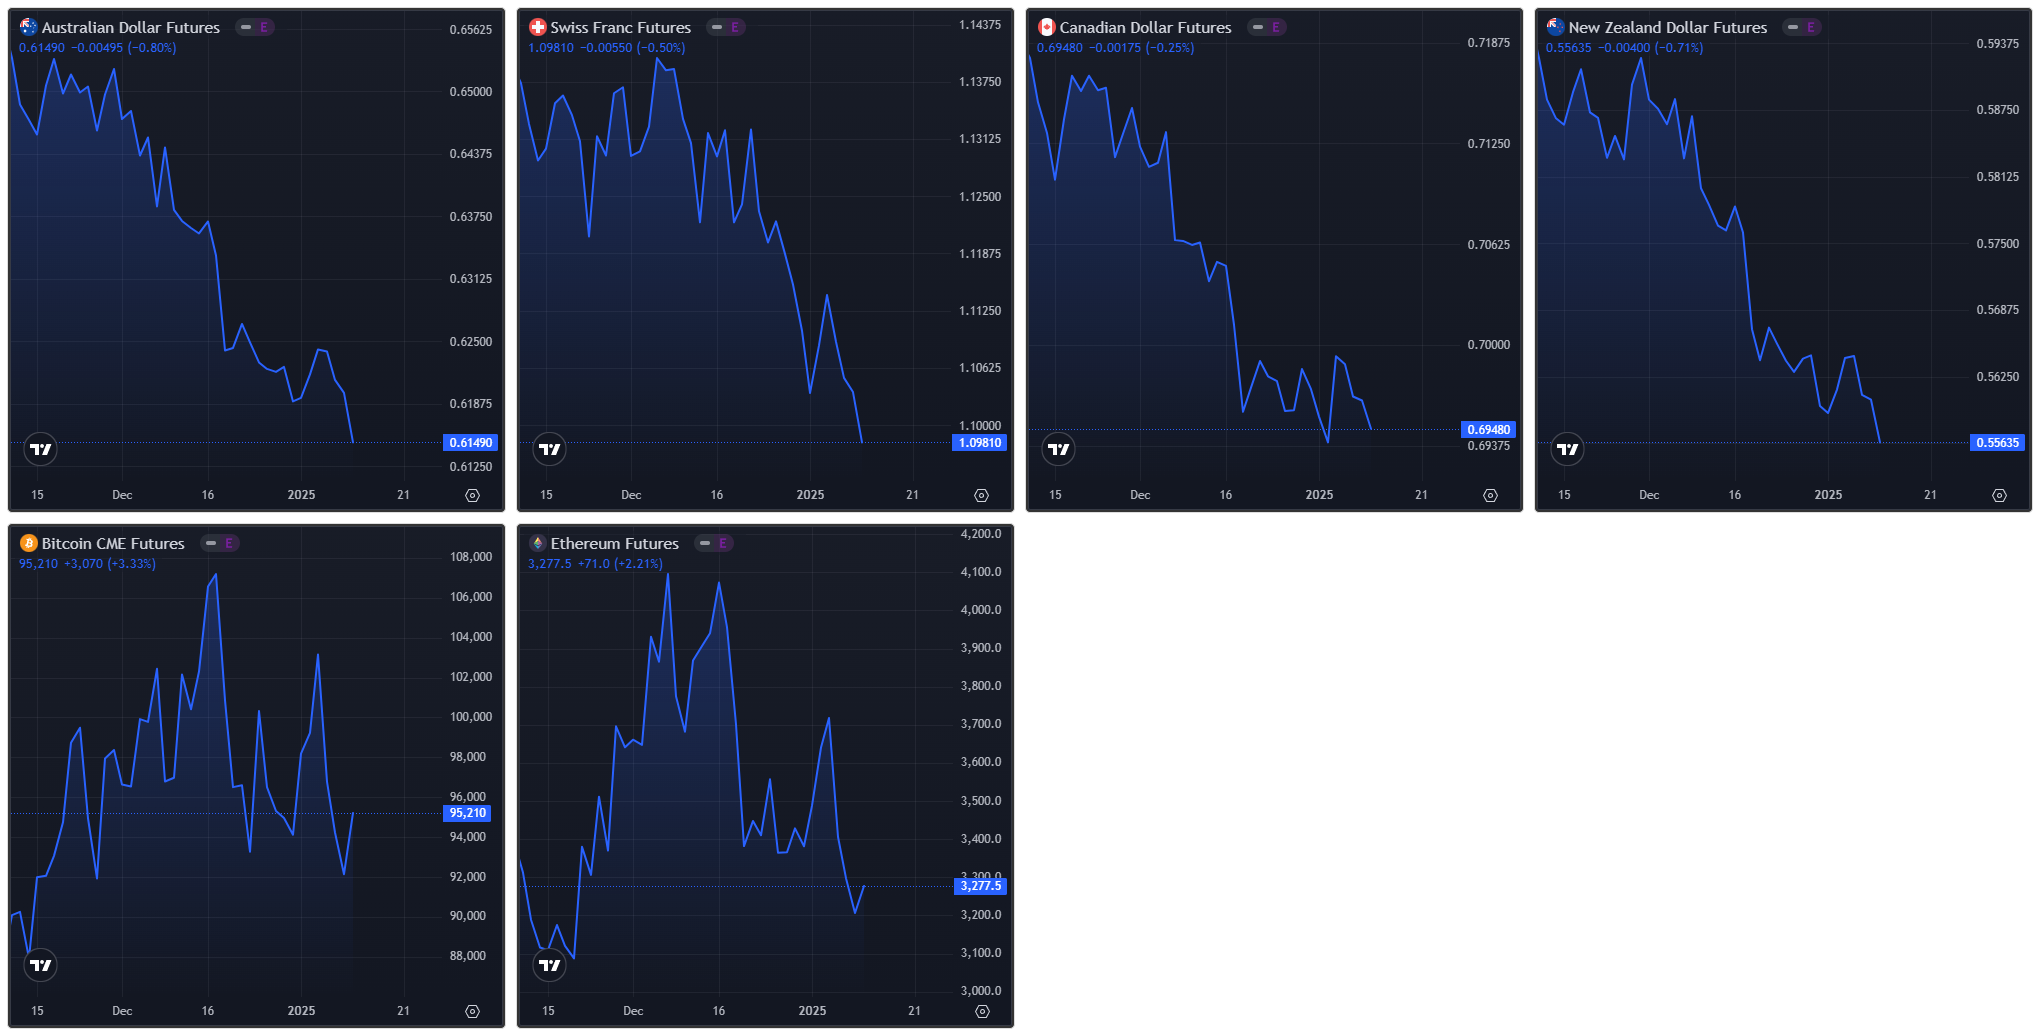
Futures Markets Snapshots
S&P 500: Sector Insights
Technology
Microsoft ( MSFT -0.00%↓ +0.09%): Flat performance reflects investor caution despite optimism around cloud services. The slowdown in broader tech is currently hampering upside.
Oracle ( ORCL 0.00%↑ -6.95%): Significant declines linked to earnings that missed expectations continue to weigh on price, driven by slowing cloud revenue growth as competitors like Microsoft and Amazon gain market share. Ex-dividend was Friday the 10th.
Nvidia ( NVDA -0.10%↓ -1.74%): Declined after weeks of strong gains as investors rotated out of high-growth AI names into value sectors. Profit-taking also played a role.
Advanced Micro Devices ( AMD -0.28%↓ -3.81%): Under pressure from mixed analyst reports suggesting rising competition in the semiconductor market. Mizuho cut its price target to $160.
Consumer Cyclical
Tesla ( TSLA -0.20%↓ +4.08%): Gained after announcing strong delivery numbers and optimism around new EV product launches, including the Cybertruck.
Amazon ( AMZN 0.00%↑ -0.58%): Marginal losses as the e-commerce giant continues to face scrutiny over slowing retail growth and rising costs in its logistics network.
Communication Services
Alphabet ( GOOG 0.00%↑ +1.33%): The company outperformed on optimism around its AI capabilities and growing market share in digital advertising.
Meta Platforms ( META 0.00%↑ +2.77%): Gains were supported by better-than-expected adoption of its Threads platform and advertising rebound in key markets.
Netflix ( NFLX 0.00%↑ -5.53%): Declined as concerns about subscriber growth surfaced, driven by intensifying competition in the streaming industry.
Healthcare
Eli Lilly ( LLY 0.06%↑ +2.81%): Strong gains were tied to positive drug trial results and optimism around its diabetes and obesity treatments.
UnitedHealth Group ( UNH 0.00%↑ +3.21%): The stock rose this week, driven by optimism around its Medicare Advantage enrollments, bolstered by positive sentiment from recent industry trends and an analyst upgrade highlighting its strong competitive positioning in the managed care space
Industrials
General Electric ( GE 0.00%↑ +1.84%): Continued strength in its aerospace division, bolstered by demand for jet engines, helped the stock outperform.
Boeing ( BA 0.00%↑ -2.24%): Declined due to reports of ongoing production delays affecting key aircraft models.
Consumer Staples
Walmart ( WMT 0.00%↑ +3.33%): Outperformed as consumer demand for value shopping remains resilient in the face of inflationary pressures.
Procter & Gamble ( PG 0.00%↑ -4.47%): Declined due to concerns over slowing demand for consumer goods as discretionary spending tightens.
Energy
Chevron ( CVX 0.00%↑ +4.38%): Strong gains followed a rebound in crude oil prices, supported by tighter OPEC production quotas.
ExxonMobil ( XOM 0.00%↑ -0.72%): Marginal losses may reflect concerns over its refining margins despite strong oil prices and little in the way of news this week.
Financials
JP Morgan ( JPM 0.00%↑ -0.05%): Flat performance reflects a balance between strong deposit growth and concerns about higher funding costs impacting net interest margins ahead of earnings from a number of Financial-names starting next week
Bank of America (BAC, +1.95%): Benefited from investor optimism over rising interest rates improving margins on lending portfolios ahead of earnings on the 16th.
Utilities
Duke Energy ( DUK 0.00%↑ -5.71%): Declined sharply as rising Treasury yields make dividend-paying stocks less attractive to income-focused investors. Duke held its quarterly dividend at $1.045/share but the downside-surprise in earnings back in Nov is still weighing on the stock.
Key Takeaways
Technology Weakness: Continued selloff in tech names like Oracle and Nvidia reflects broader market caution around high valuations.
Healthcare Strength: Gains in healthcare were driven by company-specific catalysts, including positive drug trials (Eli Lilly) and robust enrollments (UnitedHealth) and possibly indicate rotation into defensives.
Energy Rebound: The sector was buoyed by rising oil prices and OPEC-led production cuts, benefiting Chevron significantly.
Consumer Staples Underperformed: Household goods names like Procter & Gamble struggled under slowing consumer spending trends.
ETF Insights

US Large Cap
SPY (-0.71%) and QQQ (-0.60%): Both broad-market ETFs saw marginal declines, driven by continued rate-sensitive rotations out of growth stocks, though losses were relatively muted this week.
RSP (-0.84%): The equal-weighted S&P 500 ETF slightly underperformed SPY, reflecting continued struggles in smaller names and more even distribution of weakness across sectors.
US Sector ETFs
Technology (XLK, -1.38%): The technology sector remained under pressure due to rate concerns impacting valuations. However, leveraged bear ETF SOXS (-3.33%) declined, suggesting some recovery in semiconductors, while SOXX (+0.64%) gained modestly as certain chip stocks rebounded.
Healthcare (XLV, +1.48%): Outperformed due to continued strength in managed care providers and biotech names. This was supported by defensive positioning amidst macro uncertainty.
XBI (-2.28%): Biotech-focused ETFs underperformed relative to broader healthcare due to specific regulatory and funding concerns in smaller biotech names.
Energy (XLE, +2.00%): The energy sector led gains, supported by a rebound in crude oil prices.
XOP (+3.33%): Outperformed within energy, reflecting strong momentum in oil exploration and production stocks.
Consumer Discretionary (XLY, -0.26%): Marginal declines reflect ongoing consumer spending concerns. Homebuilders like ITB (-1.37%) remained under pressure amid rising mortgage rates.
Small and Mid-Cap ETFs
IWM (-1.95%) and MDY (-0.47%): Small- and mid-cap ETFs underperformed as rising borrowing costs and tightening credit conditions weighed on smaller, more rate-sensitive companies.
Leveraged bear small-cap ETF TZA (+6.02%) surged, reflecting bearish sentiment in the segment.
Global and International ETFs
China ( FXI 0.00%↑ , -4.15%): Chinese ETFs posted significant losses as weak economic data and geopolitical tensions weighed on sentiment.
Leveraged bull ETF YINN (-12.49%) was particularly hard-hit, reflecting continued bearishness in Chinese equities.
Emerging Markets ( EEM 0.00%↑ , -1.60%): Declined broadly as a stronger dollar and global growth concerns put pressure on developing economies.
Japan ( EWJ 0.00%↑ , -2.64%): Japanese ETFs fell, reversing some recent strength, as concerns over global growth began to weigh on industrial and export-heavy economies.
Fixed Income
TLT -0.05%↓ (-2.41%): Long-duration Treasury ETFs declined as bond yields continued to rise amidst fears of higher-for-longer interest rates.
Leveraged long Treasury ETF TMF (-7.35%) saw outsized losses due to its sensitivity to rising rates.
IEF -0.07%↓ (-1.26%): Intermediate-term Treasuries also struggled, reflecting broader fixed-income challenges.
Commodities
Gold ( GLD 0.00%↑ , +1.14%) and Silver ( SLV 0.00%↑ , +2.52%): Precious metals rebounded this week as safe-haven demand picked up amidst economic uncertainty and geopolitical risks.
Crude Oil ( USO 0.00%↑ , +6.55%): Oil ETFs surged on the back of tightening OPEC production cuts and geopolitical concerns, further lifting energy-related ETFs.
Leverage and Inverse ETFs
SOXL 0.00%↑ (-1.41%) and SOXS (-3.33%): Mixed performance in leveraged semiconductor ETFs reflects ongoing volatility in the chip space, with some stabilization this week.
TNA 0.00%↑ (-6.08%): Leveraged bullish small-cap ETF suffered significantly as smaller companies remained under pressure.
TZA 0.00%↑ (+6.02%): Small-cap bear ETFs rallied on the back of weak sentiment in the small-cap segment.
Cryptocurrency ETFs
BITO 0.00%↑ (-2.91%): Crypto ETFs fell slightly as Bitcoin retraced some recent gains, reflecting profit-taking and regulatory concerns.
GBTC 0.00%↑ (-2.76%): Similarly declined as the market consolidated after a strong rally in prior weeks.
Key Takeaways
Energy Leads the Market: The energy sector was the standout performer, with crude oil prices surging, benefiting ETFs like XLE 0.00%↑ and XOP 0.00%↑ .
China Weakness: Chinese ETFs were among the worst performers due to weak economic data and geopolitical headwinds, dragging down FXI 0.00%↑ and YINN 0.04%↑ .
Fixed Income Under Pressure: Rising bond yields continued to weigh on fixed-income ETFs, with long-duration Treasury ETFs like TLT -0.05%↓ and TMF 0.00%↑ seeing notable declines.
Small-Cap Struggles Persist: Small-cap ETFs significantly underperformed, reflecting heightened sensitivity to rising borrowing costs and credit conditions.

Special Coverage: Getting Defensive with Personal Portfolios in a Volatile Environment
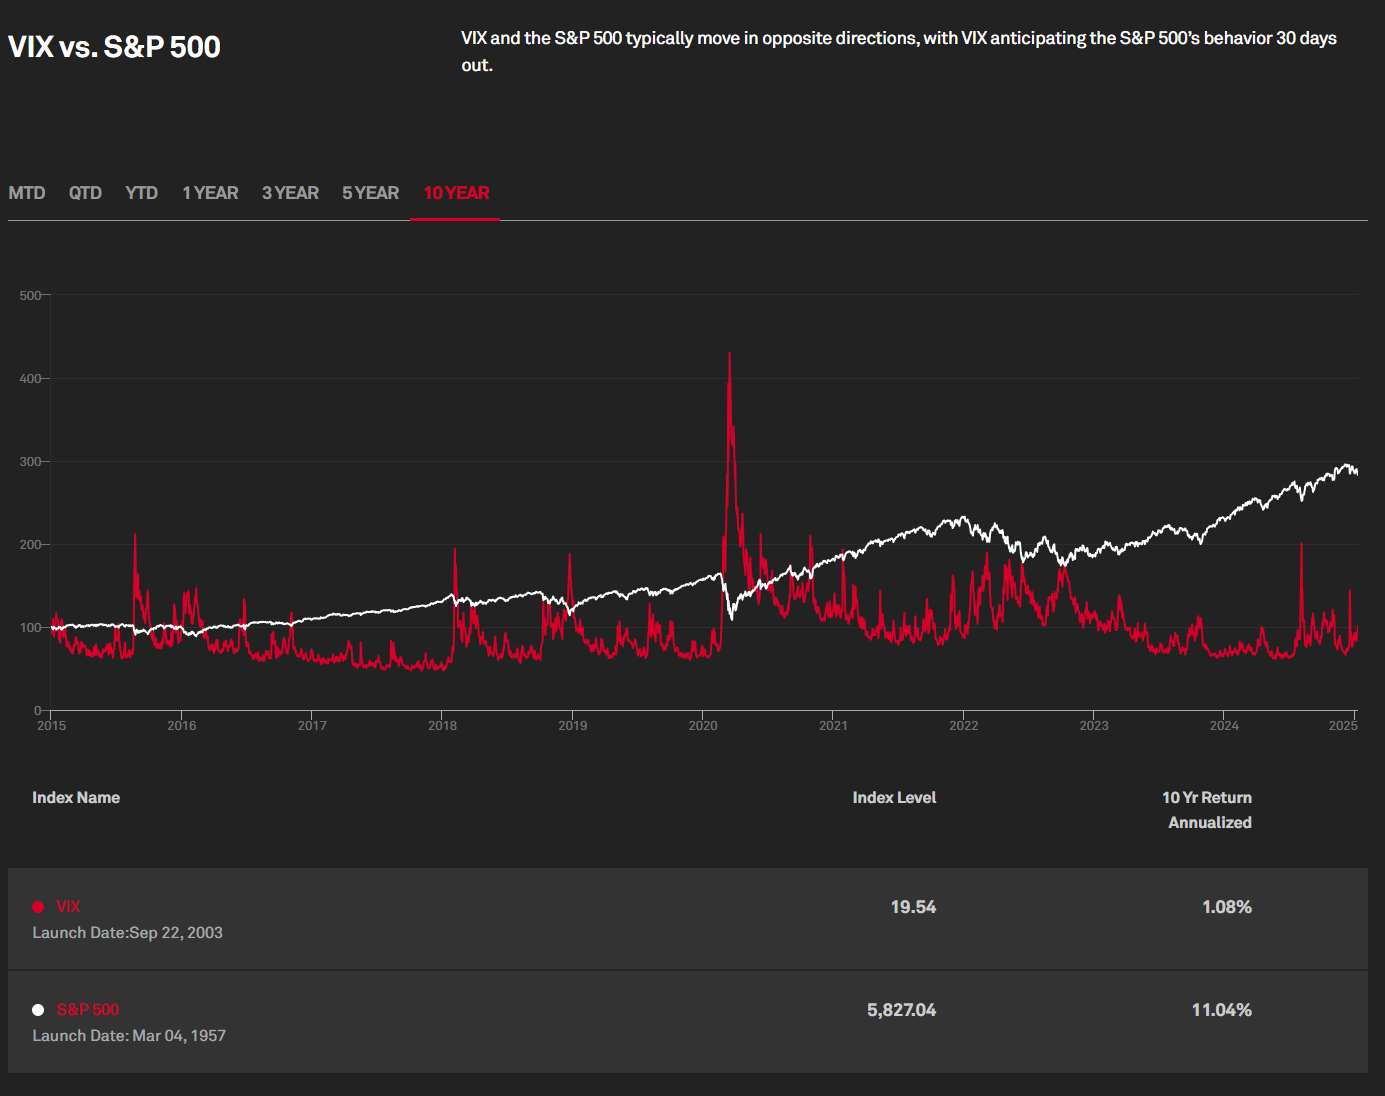
The financial markets are inherently cyclical, oscillating between periods of growth and contraction. Certain moments, however, heighten the risk of volatility: political transitions, economic uncertainty, or macroeconomic shocks. In such an environment, investors often struggle to preserve capital while remaining positioned for future opportunities. Recent trends—such as the consolidation and subsequent sell-off in sectors like Consumer Staples (XLP) and a notable uptick in the VIX—signal the need for a more defensive approach to portfolio management.
This written piece explores how investors can position themselves defensively in a volatile market. We'll examine historically resilient sectors, portfolio instruments designed to reduce risk, and strategies for preserving cash to redeploy under more favorable conditions. Through these insights, investors can better navigate turbulent markets while maintaining long-term financial goals.
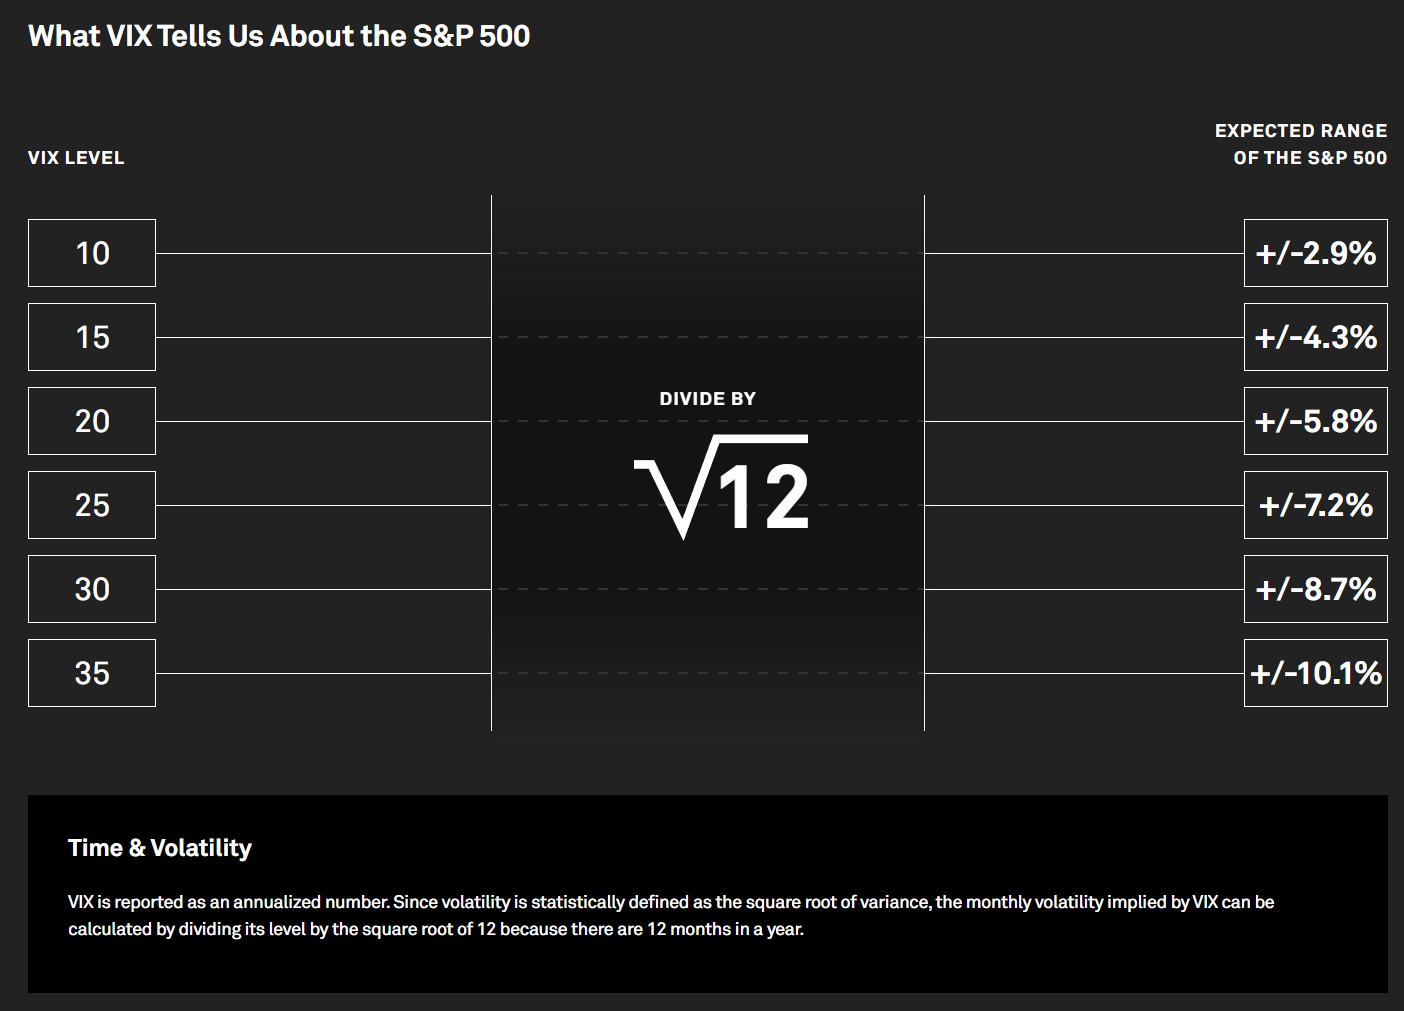
Understanding Market Volatility
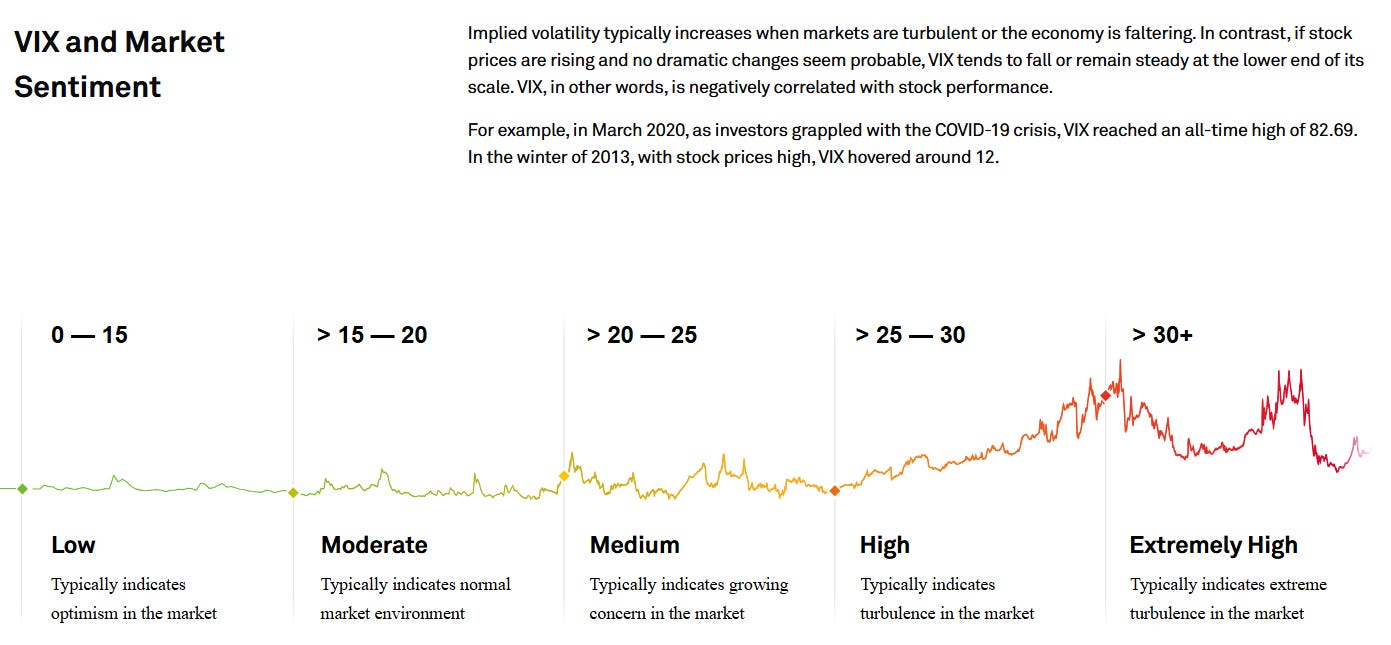
Volatility reflects the degree of price movement in financial markets and is often measured using the CBOE Volatility Index (VIX). While short-term traders may see volatility as an opportunity, it often represents heightened risk for long-term investors. Volatility spikes are typically triggered by uncertainty, whether political, economic, or geopolitical, and can lead to significant portfolio drawdowns if not managed properly.
Key Drivers of Volatility
Economic Uncertainty: Inflation, rising interest rates, and recession fears can destabilize markets.
Political Transitions: Events like presidential inaugurations or changes in government leadership often lead to market jitters.
Geopolitical Tensions: Trade disputes, wars, or supply chain disruptions exacerbate uncertainty.
Market Sentiment: Shifts in investor confidence, often amplified by speculative trading, can lead to sharp sell-offs.
Understanding and recognizing these drivers is crucial for adopting a defensive approach and preparing portfolios to withstand periods of heightened market stress.
Historical Safe-Haven Sectors and Industries
During times of volatility, certain sectors of the market have historically shown resilience. These “defensive” sectors are characterized by consistent demand for their products and services, regardless of economic conditions.
1. Consumer Staples ( XLP 0.00%↑ )
Consumer staples include companies that produce essential goods like food, beverages, and household products. These items remain in demand even during economic downturns, making this sector a traditional safe haven.
Examples of Top Companies: Procter & Gamble ( PG 0.00%↑ ), Coca-Cola ( KO 0.00%↑ ), PepsiCo ( PEP 0.00%↑ ).
Caution: As demonstrated by recent trends, Consumer Staples are not entirely immune to sell-offs, particularly when broader market sentiment deteriorates or defensive sectors are themselves over-valued.
2. Healthcare ( XLV 0.00%↑ )
Healthcare is another defensive sector, as people require medical services and pharmaceuticals regardless of the economy's state. This sector benefits from stable cash flows and growth opportunities, particularly with an aging population driving demand.
Examples of Top Companies: Johnson & Johnson ( JNJ 0.00%↑ ), Pfizer ( PFE 0.11%↑ ), UnitedHealth Group ( UNH 0.00%↑ ).
3. Utilities ( XLU 0.00%↑ )
Utilities, such as electricity and water providers, are considered defensive due to the essential nature of their services. These companies often offer reliable dividends, further enhancing their appeal during market turbulence.
Examples of Top Companies: NextEra Energy ( NEE 0.00%↑ ), Duke Energy ( DUK 0.00%↑ ), Dominion Energy ( D 0.00%↑ ).
4. Real Estate Investment Trusts (REITs)
REITs focused on residential housing and healthcare facilities tend to perform well during economic slowdowns. They provide a stable income through dividends and often hold up better than other real estate sectors during market downturns.
Examples of Top REITs: Public Storage ( PSA 0.00%↑ ), American Tower ( AMT 0.00%↑ ).
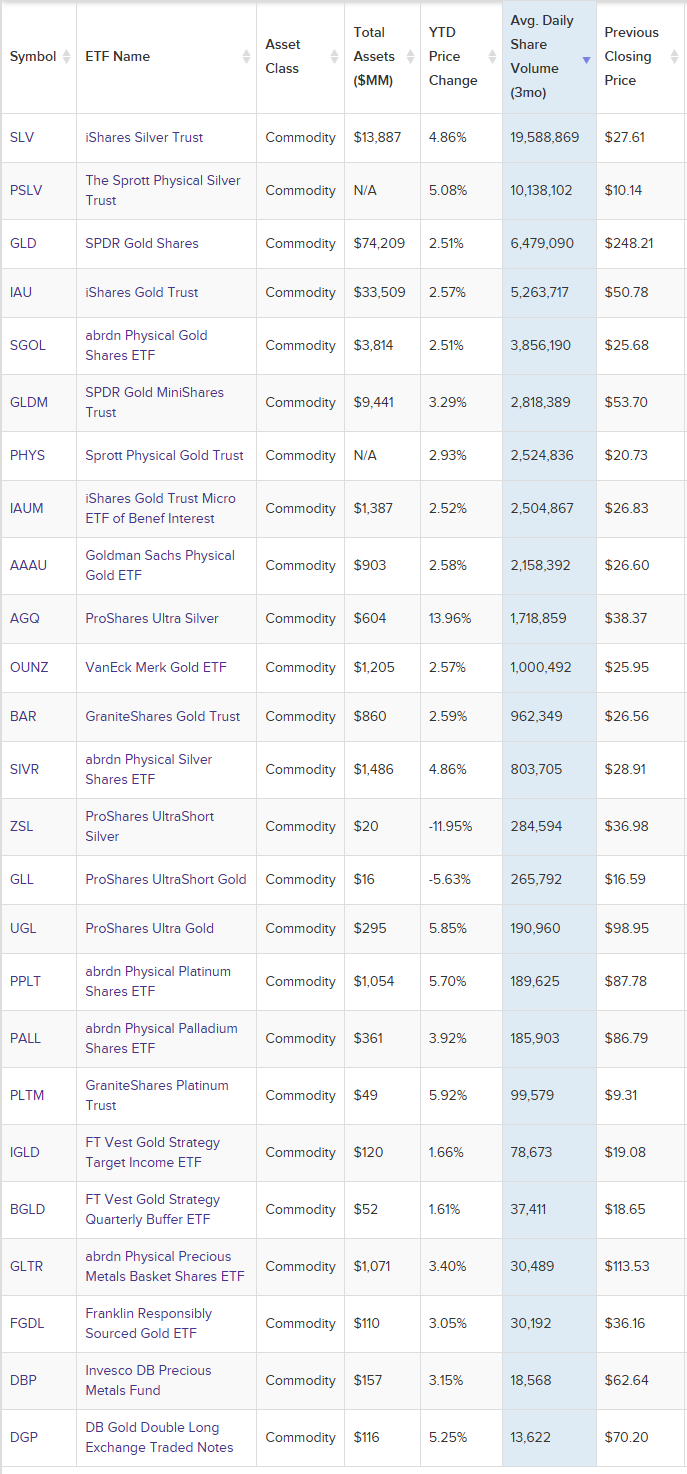
5. Precious Metals
Gold and silver are classic safe-haven assets. Investors often turn to these commodities during periods of uncertainty to preserve value and hedge against inflation.
Top Instruments: SPDR Gold Shares ( GLD 0.00%↑ ), iShares Silver Trust ( SLV 0.00%↑ ). There are many other ETFs for precious metals however:

By diversifying into these sectors, investors can reduce portfolio volatility while maintaining exposure to essential industries.
Portfolio Instruments to Mitigate Volatility
Even with sector diversification, specific financial instruments are necessary to manage portfolio risk effectively. These tools are designed to preserve capital, hedge against losses, and provide liquidity.
1. Cash and Cash Equivalents
Holding cash or cash equivalents, such as Treasury bills or money market funds, provides liquidity and preserves capital. This enables investors to redeploy funds into the market when conditions improve.
2. Bonds
Bonds offer stability and consistent income, acting as a counterweight to equities during volatile periods.
Treasuries: U.S. government bonds are considered risk-free and offer predictable returns.
Municipal Bonds: Provide tax advantages and relatively low risk for high-income investors.
Corporate Bonds: Investment-grade bonds deliver higher yields with moderate risk.
3. Hedging with Derivatives
Derivatives provide a way to protect portfolios without selling underlying assets.
Put Options: Act as insurance by giving the holder the right to sell at a predetermined price.
Covered Calls: Generate income while slightly reducing risk.
Futures Contracts: Hedge exposure to commodities, currencies, or indices.
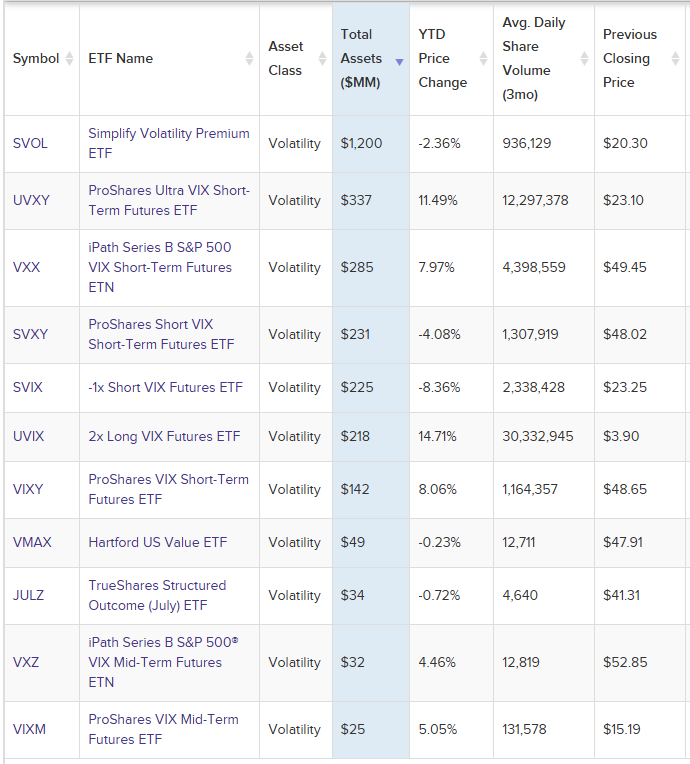
4. Inverse ETFs & Volatility ETFs
Inverse ETFs allow investors to profit from market declines, offering a hedge against falling markets.
Examples: ProShares Short S&P 500 ( SH 0.00%↑ ), ProShares UltraShort QQQ ( QID 0.00%↑ ). There are many liquid options available for you to choose from:

There are also several ETFs that track volatility offering investors ways to hedge against downturns or even profit from them:
5. Low-Volatility ETFs
Low-volatility ETFs aim to reduce risk while maintaining equity exposure.
Examples: iShares MSCI USA Minimum Volatility ETF ( USMV 0.00%↑ ), Invesco S&P 500 Low Volatility ETF ( SPLV 0.00%↑ ).
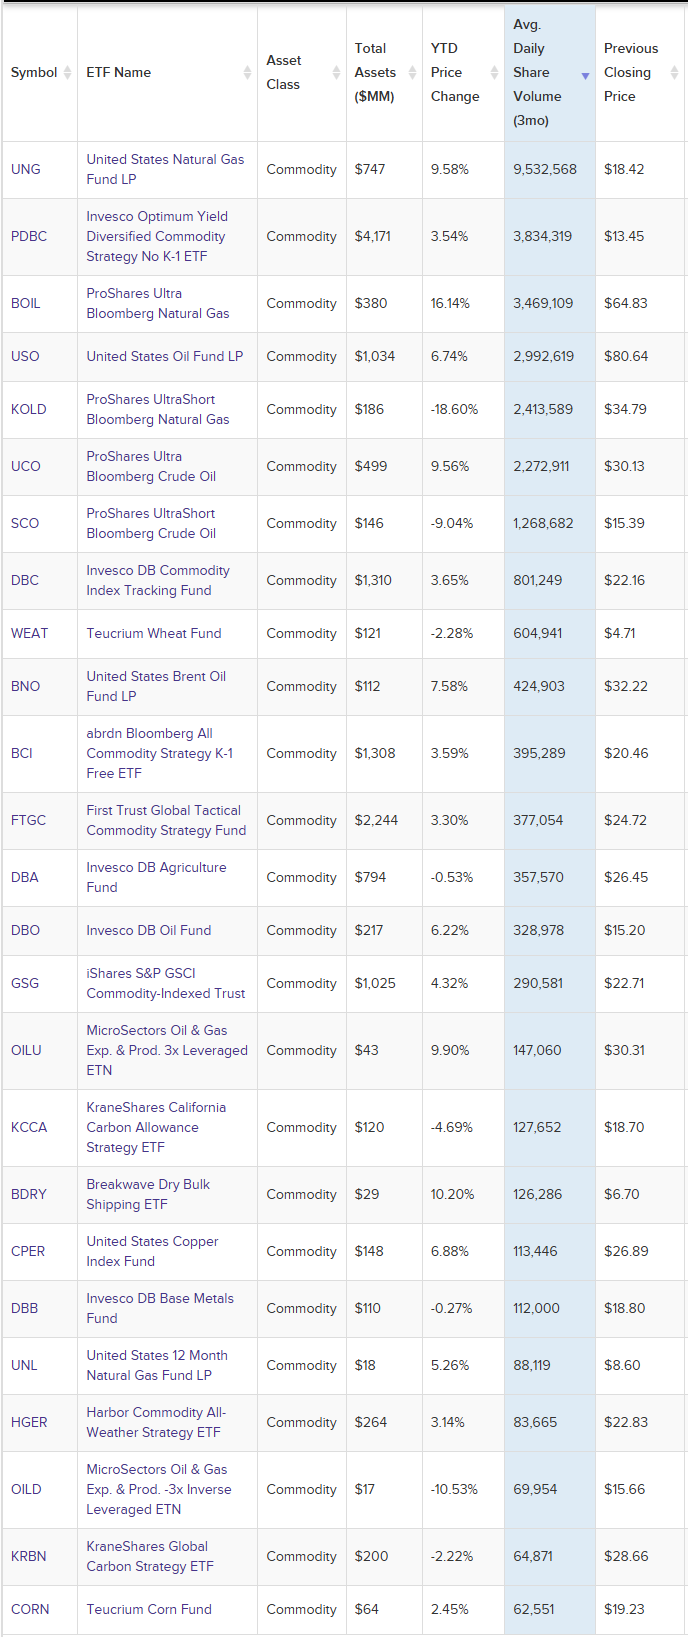
6. Commodities
Beyond precious metals, broader commodity exposure can act as a hedge against inflation and economic downturns. Here’s a short list of some of the most liquid ETFs in this space as an illustration of what is available:
Strategies to Preserve Cash for Redeployment
Preserving cash and maintaining liquidity during market downturns is essential. This enables investors to capitalize on opportunities when valuations become more favorable.
1. Rebalancing Portfolios
Reviewing and adjusting allocations by shifting from high-risk growth stocks to defensive sectors or fixed-income instruments can reduce portfolio risk.
2. Stop-Loss Orders
Stop-loss orders automate selling when an asset's price falls below a predetermined level, limiting your downside risk.
3. Dividend-Paying Stocks
Investing in companies with a history of consistent dividends provides income and stability during downturns.
4. Tactical Asset Allocation
Tactical allocation involves dynamically adjusting portfolio composition based on market conditions, prioritizing defensive assets during periods of volatility.
Lessons from Historical Volatility Events
Examining past periods of heightened volatility provides valuable lessons for defensive investing.
Case Study 1: The 2008 Financial Crisis
Defensive sectors like Consumer Staples and Healthcare outperformed growth sectors.
Bonds and gold emerged as reliable hedges.
Key takeaway: Defensive assets preserved value while the broader market suffered significant losses.
Case Study 2: COVID-19 Market Crash (2020)
Technology and Healthcare rebounded quickly, while Energy and Financials lagged.
Diversification across defensive sectors helped mitigate losses.
Key takeaway: Flexible and diversified strategies proved most effective.
Conclusion
Navigating volatile markets requires discipline, a clear understanding of risk, and the right tools. Defensive investing is not about avoiding risk entirely but about positioning portfolios to withstand downturns while preserving the potential for future growth.
By focusing on historically resilient sectors, incorporating risk-mitigating instruments, and adopting prudent strategies to preserve cash, investors can weather turbulent times and emerge stronger. While no strategy is foolproof, a defensive approach tailored to individual risk tolerance and financial goals can provide the stability and confidence needed to stay the course.
In an environment poised for volatility, adopting a defensive mindset ensures not only the preservation of capital but also the readiness to seize opportunities when the market eventually stabilizes - be prepared to lean into pullbacks as opportunities to diversify and add quality investments at discounted prices across multiple corners of the market.

US Investor Sentiment
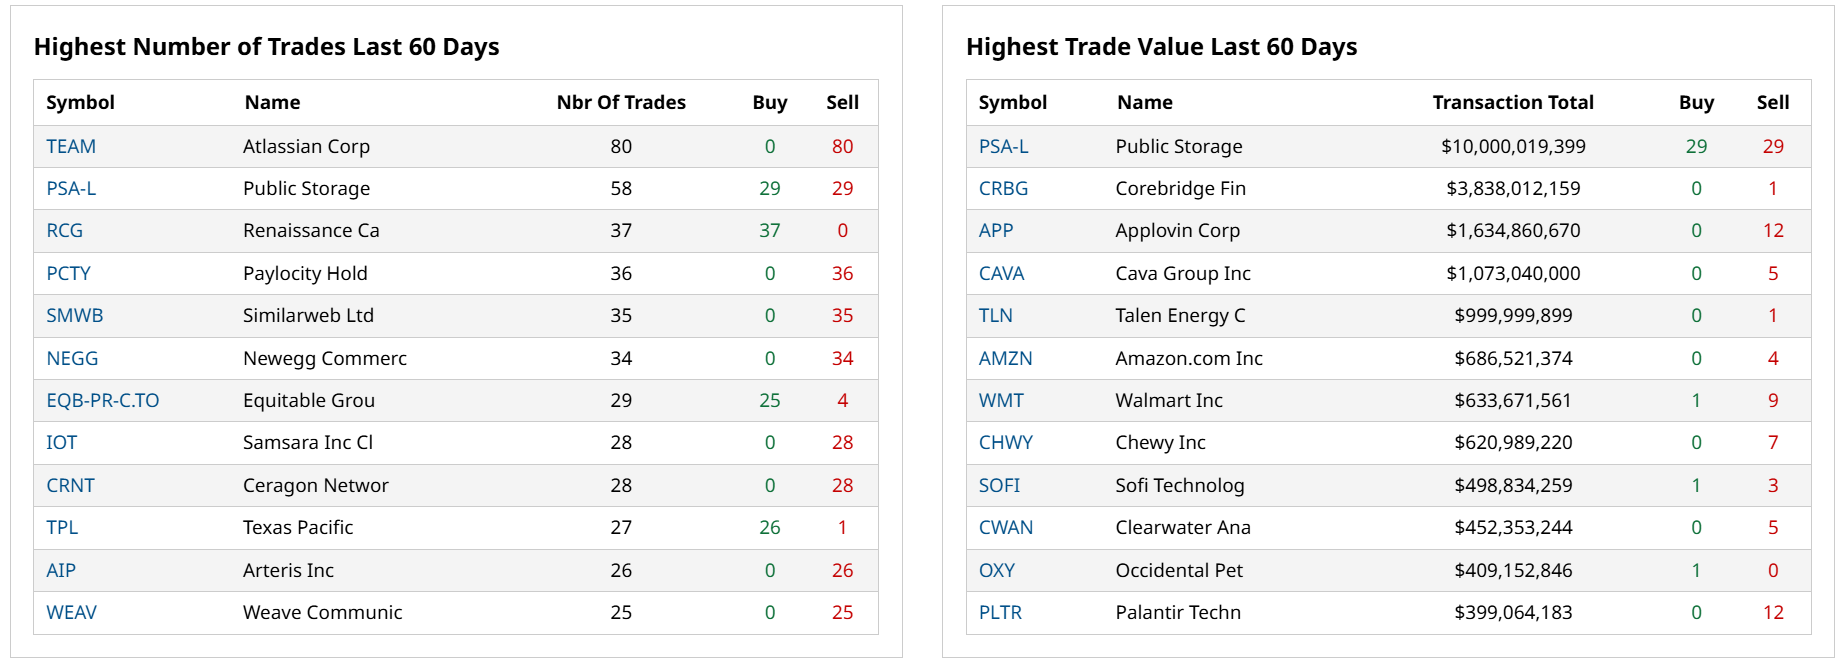
Insider Trading
Insider trading occurs when a company’s leaders or major shareholders trade stock based on non-public information. Tracking these trades can reveal insider expectations about the company’s future. For example, large purchases before an earnings report or drug trial results might indicate confidence in upcoming good news.
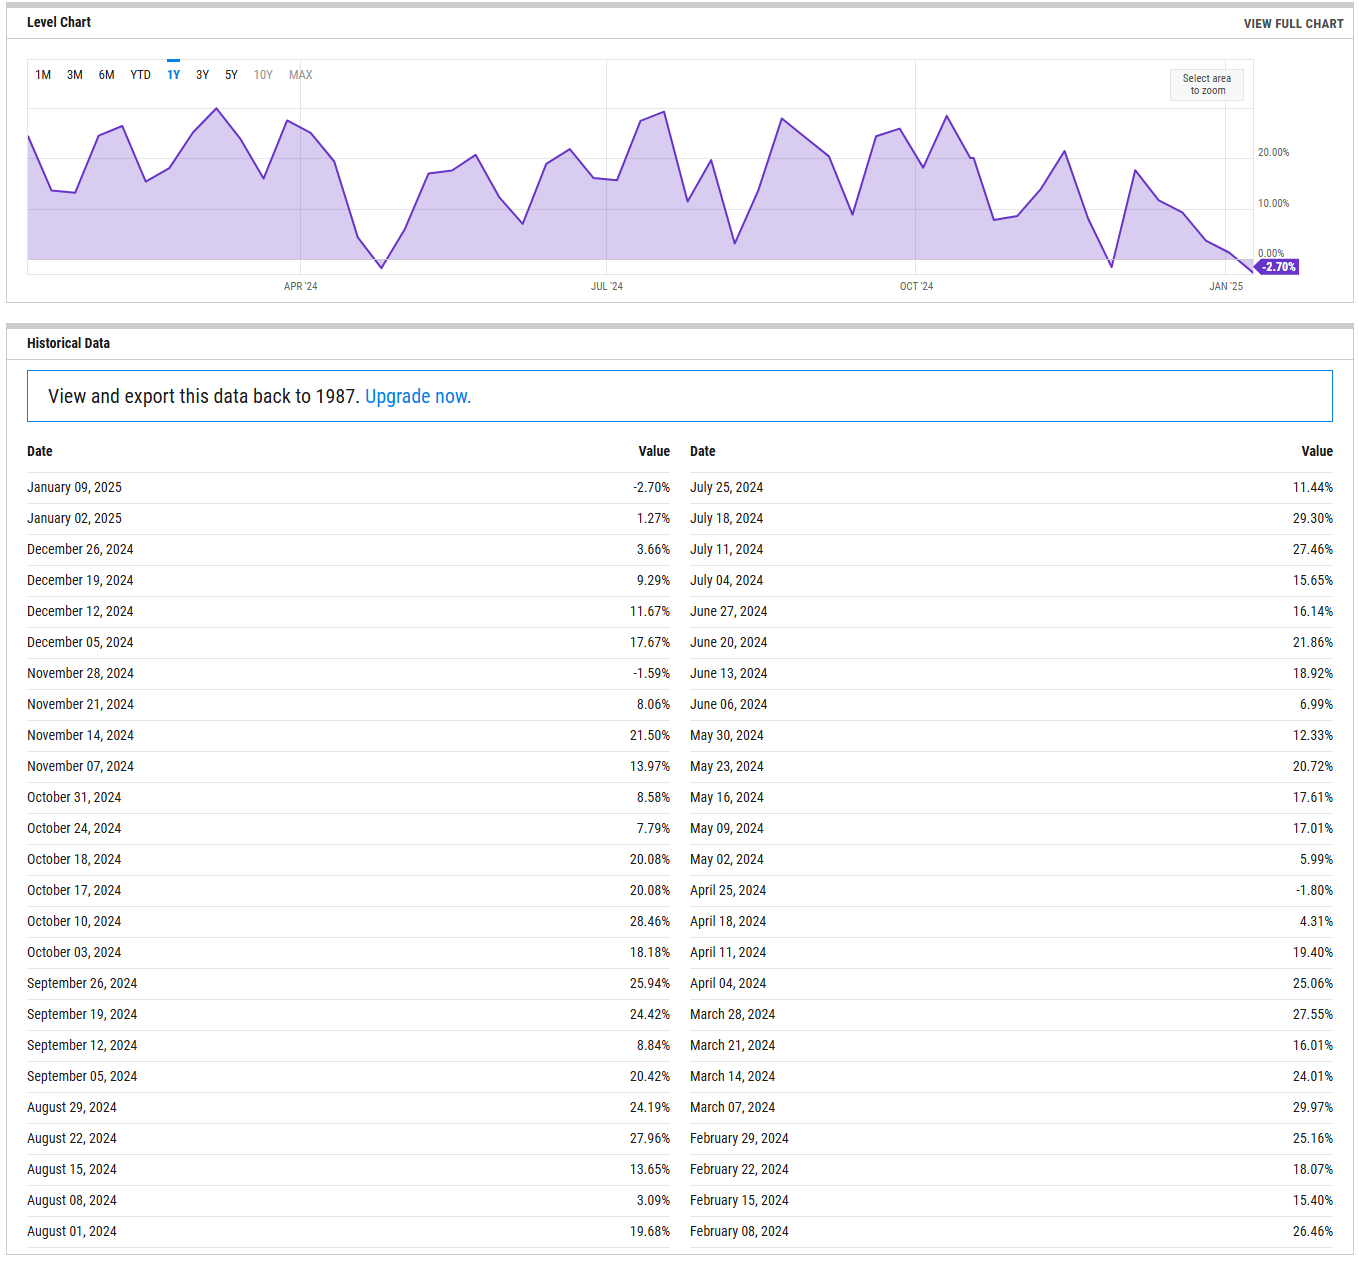
%Bull-Bear Spread
The %Bull-Bear Spread chart is a sentiment indicator that shows the difference between the percentage of bullish and bearish investors, often derived from surveys or sentiment data, such as the AAII (American Association of Individual Investors) sentiment survey. This spread tells investors about the prevailing mood in the market and can provide insights into market extremes and potential turning points.
Bullish or Bearish Sentiment:
When the spread is positive, it means more investors are bullish than bearish, indicating optimism about the market’s direction.
A negative spread indicates more bearish sentiment, meaning more investors expect the market to decline.
Contrarian Indicator:
The %Bull-Bear Spread is often used as a contrarian indicator. For example, extremely high levels of bullish sentiment might suggest that the market is overly optimistic and could be due for a correction.
Similarly, when bearish sentiment is extremely high, it might indicate that the market is overly pessimistic, and a rally could be on the horizon.
Market Extremes and Reversals:
Historically, extreme values of the spread (both positive and negative) can signal turning points in the market. A very high positive spread can signal market exuberance, while a very low or negative spread may indicate fear or capitulation.
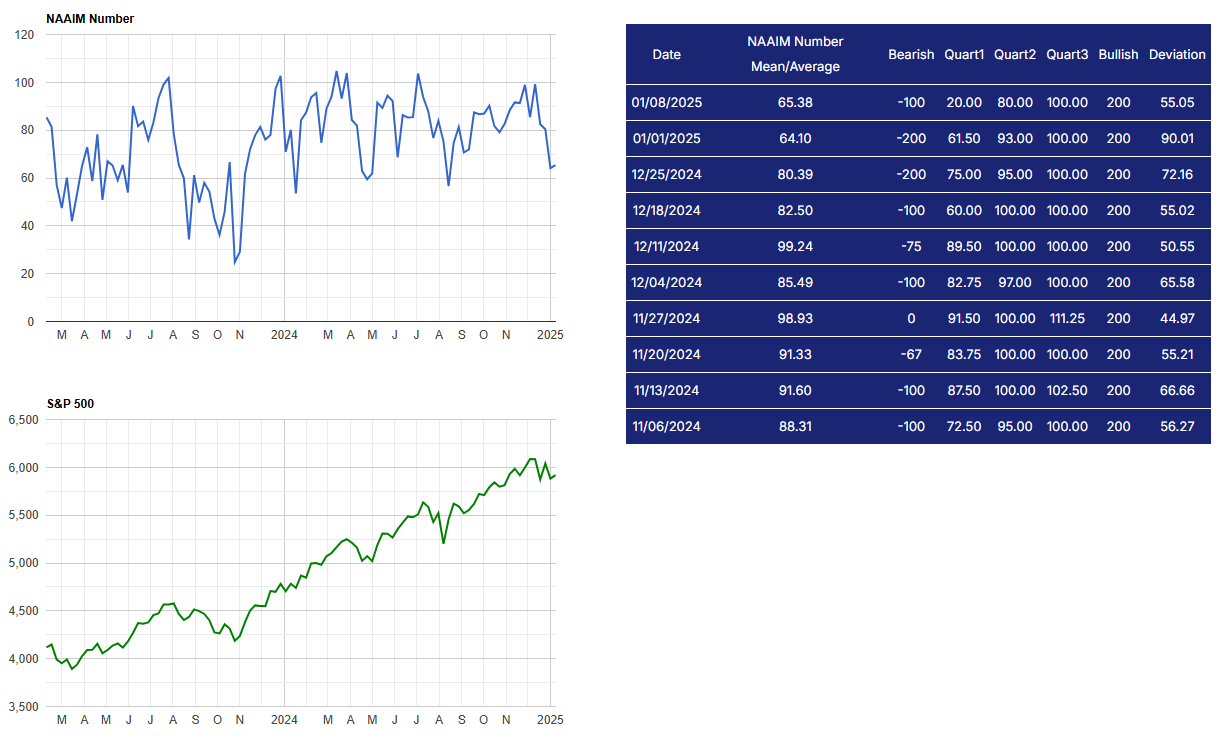
NAAIM Exposure Index
The NAAIM Exposure Index (National Association of Active Investment Managers Exposure Index) measures the average exposure to U.S. equity markets as reported by its member firms. These are typically active money managers who provide their equity exposure levels weekly. The index offers insight into how much these managers are investing in equities at any given time, ranging from being fully short (-100%) to leveraged long (up to +200%).

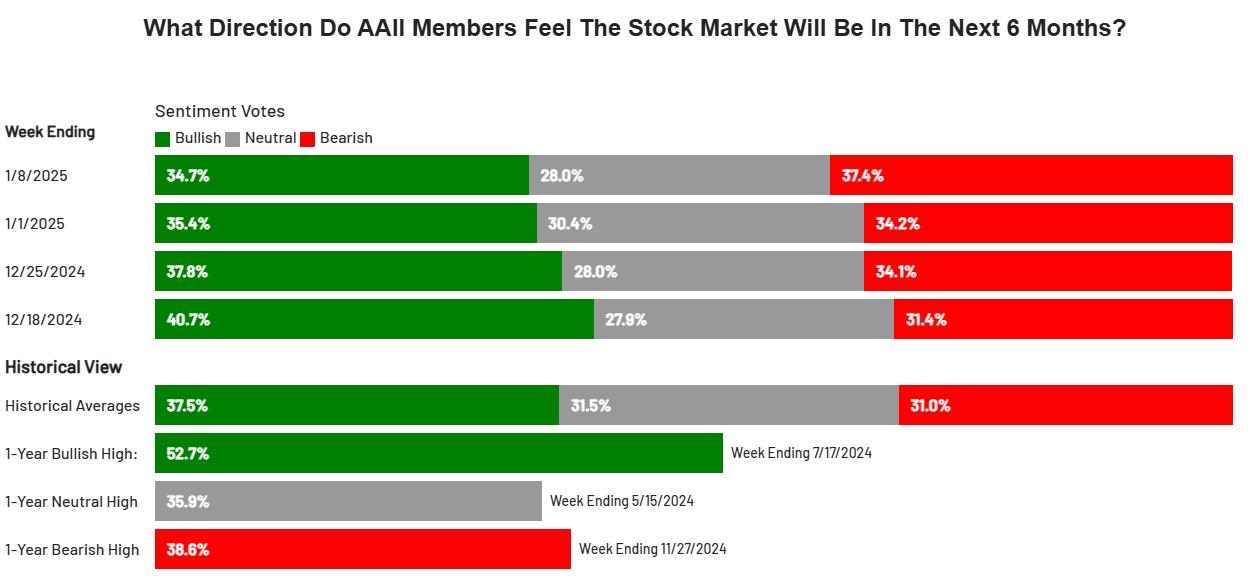
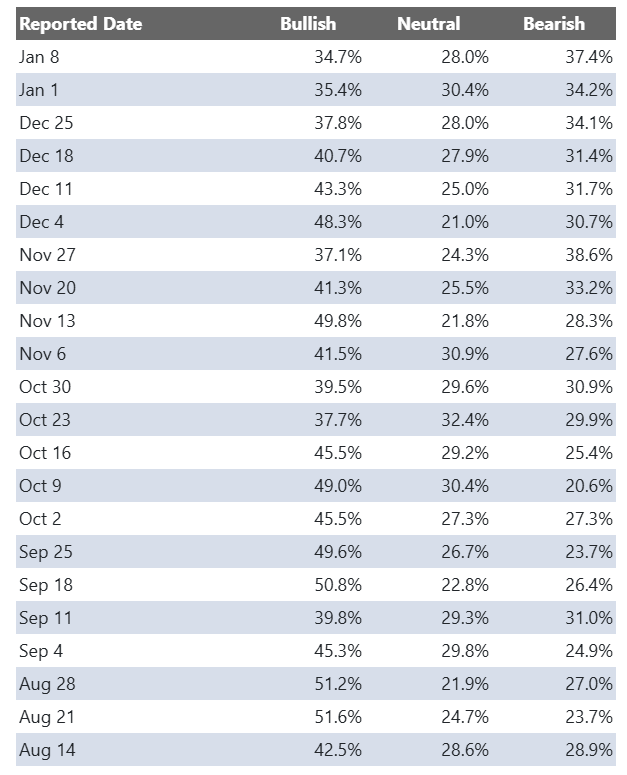
AAII Investor Sentiment Survey
The AAII Investor Sentiment Survey is a weekly survey conducted by the American Association of Individual Investors (AAII) to gauge the mood of individual investors regarding the direction of the stock market over the next six months. It provides insights into whether investors are feeling bullish (expecting the market to rise), bearish (expecting the market to fall), or neutral (expecting the market to stay about the same).
Key Points:
Bullish Sentiment: Reflects the percentage of investors who believe the stock market will rise in the next six months.
Bearish Sentiment: Represents those who expect a decline.
Neutral Sentiment: Reflects investors who anticipate little to no market movement.
The survey is widely followed as a contrarian indicator, meaning that extreme levels of bullishness or bearishness can sometimes signal market turning points. For example, when a large number of investors are overly optimistic (high bullish sentiment), it could suggest a market top, while excessive pessimism (high bearish sentiment) may indicate a market bottom is near.
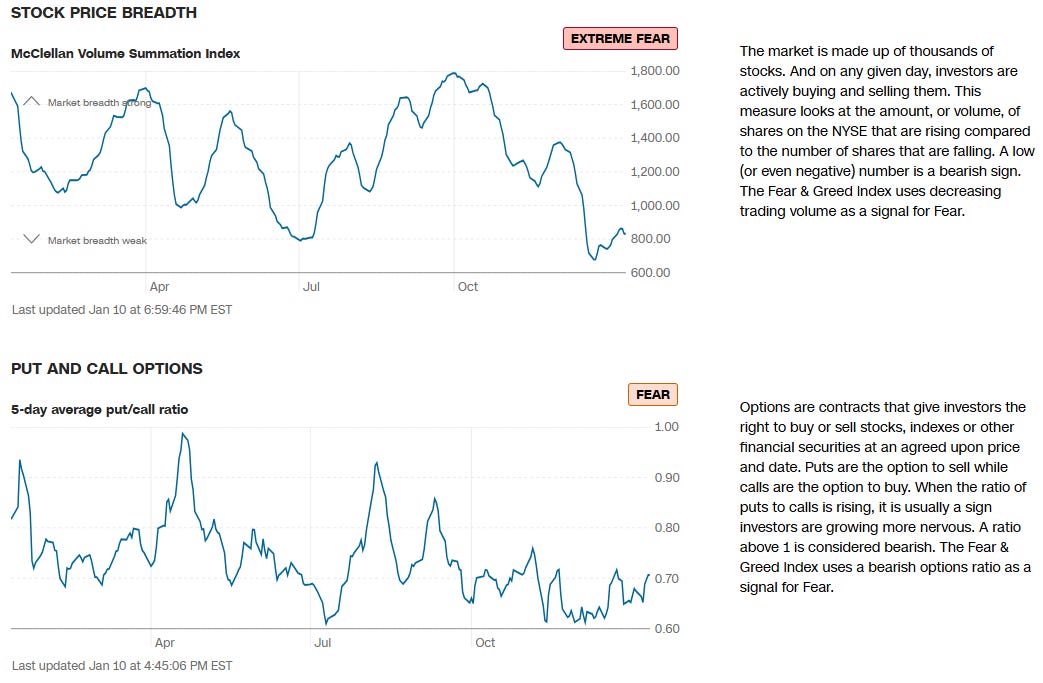
SPX Put/Call Ratio
The SPX Put/Call Ratio is an indicator that is used to gauge market sentiment. This is calculated as the ratio between trading S&P 500 put options and S&P call options. A high put/call ratio can indicate fear in the markets, while a low ratio indicates confidence. For example, in 2015, the Put-Call ratio was as high as 3.77 because of market fears stemming from various global economic issues like a GDP growth slowdown in China and a Greek debt default.
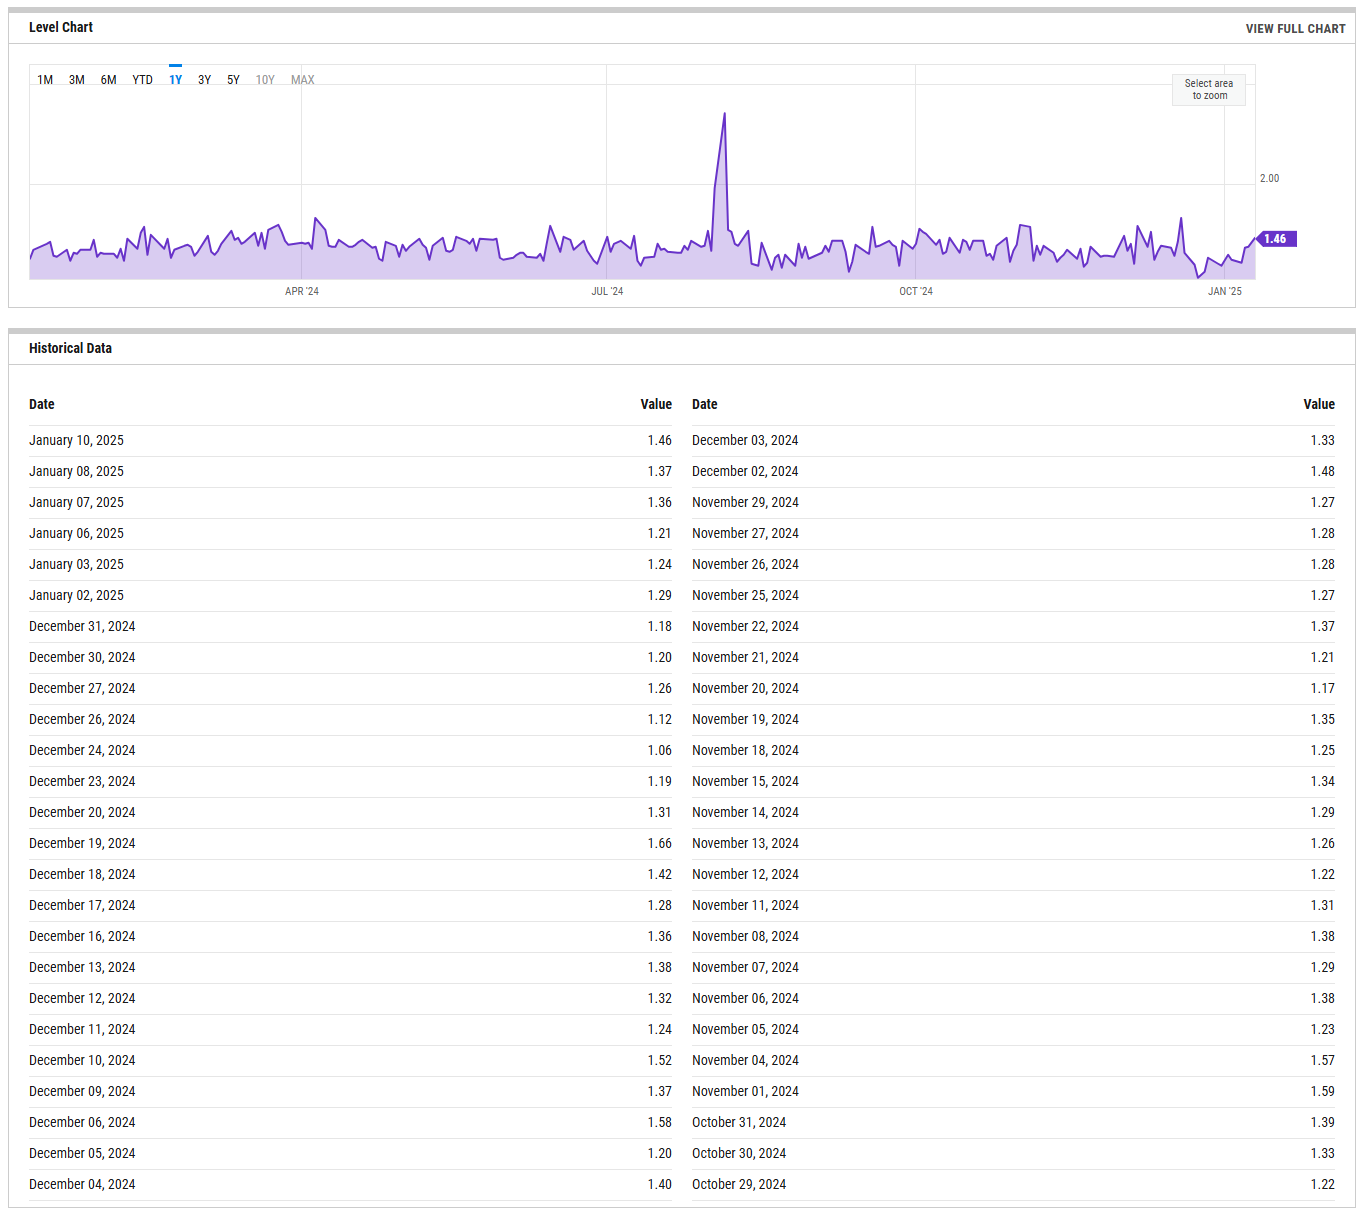
CBOE Equity Put/Call Ratio
The CBOE (Chicago Board Options Exchange) equity put/call ratio is a sentiment indicator used by traders and analysts to gauge market sentiment and potential shifts in investor behavior. It is calculated by dividing the volume of put options by the volume of call options on equities. Here’s what it reveals and how it is generally interpreted:
High Put/Call Ratio: When the put/call ratio is high (above 1.0), it suggests that there is more demand for put options than call options. This typically reflects a more bearish sentiment, as investors may be hedging against potential declines or expecting the market to fall.
Low Put/Call Ratio: Conversely, a low put/call ratio (below 0.7) indicates a higher volume of call options compared to puts, reflecting bullish sentiment. Investors may be expecting upward momentum and are positioning themselves to profit from price gains
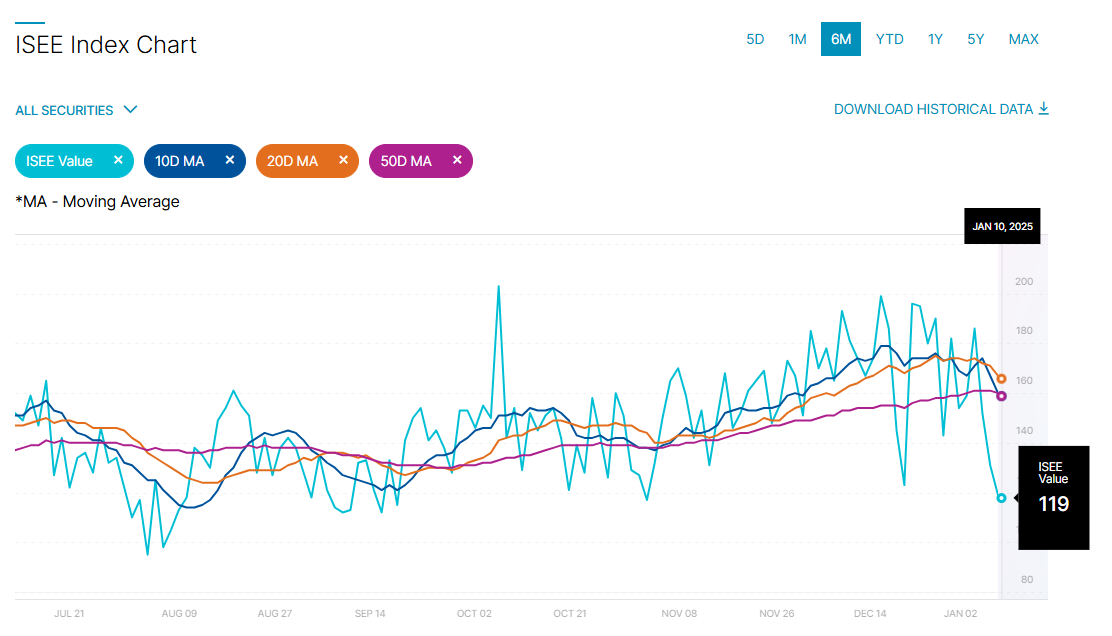
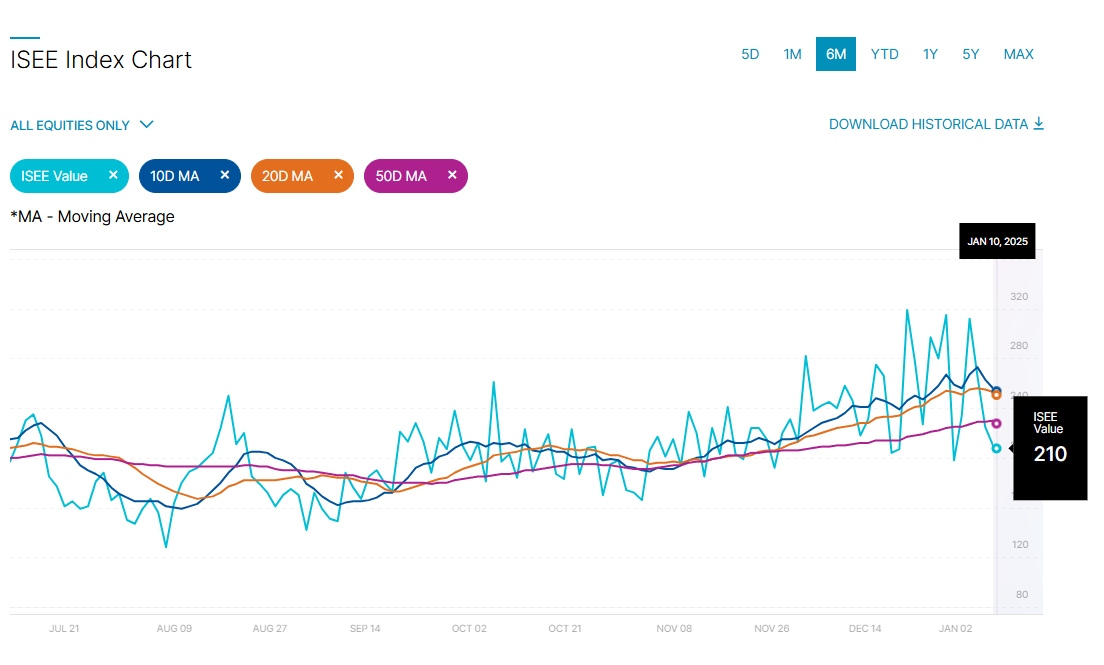
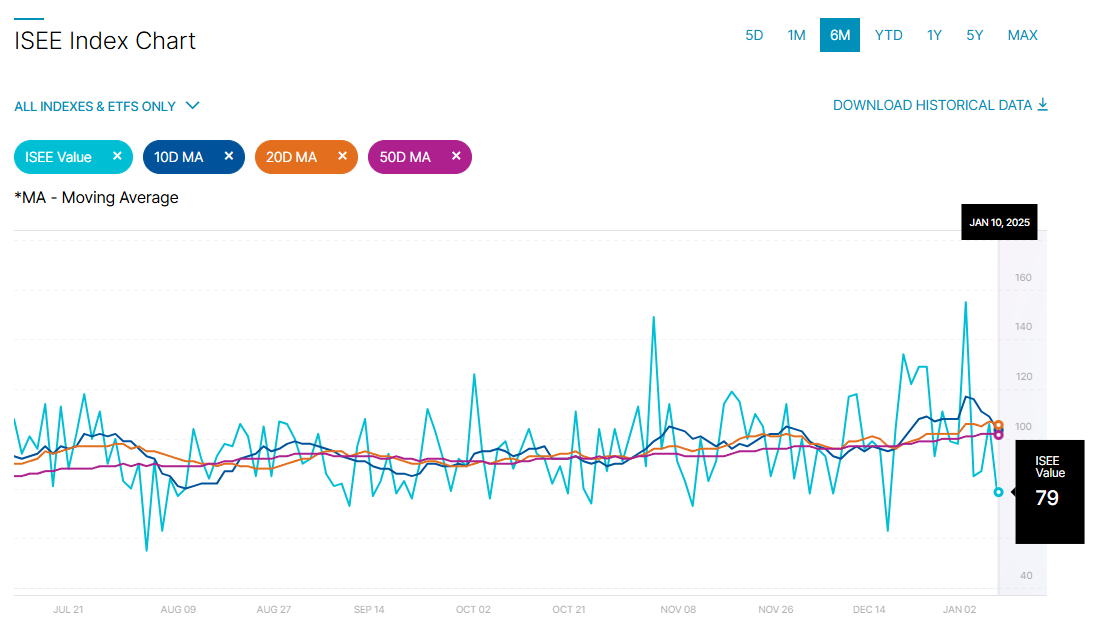
ISEE Sentiment Index
The ISEE (International Securities Exchange Sentiment) Index is a measure of investor sentiment derived from options trading. Unlike traditional put/call ratios, the ISEE Index focuses only on opening long customer transactions and is adjusted to remove market-maker and firm trades, providing a purer sentiment reading.
The ISEE Index typically ranges from 0 to 200, with readings above 100 indicating more call options being bought relative to put options, suggesting bullish sentiment. Conversely, readings below 100 suggest bearish sentiment, with more puts being purchased relative to calls.
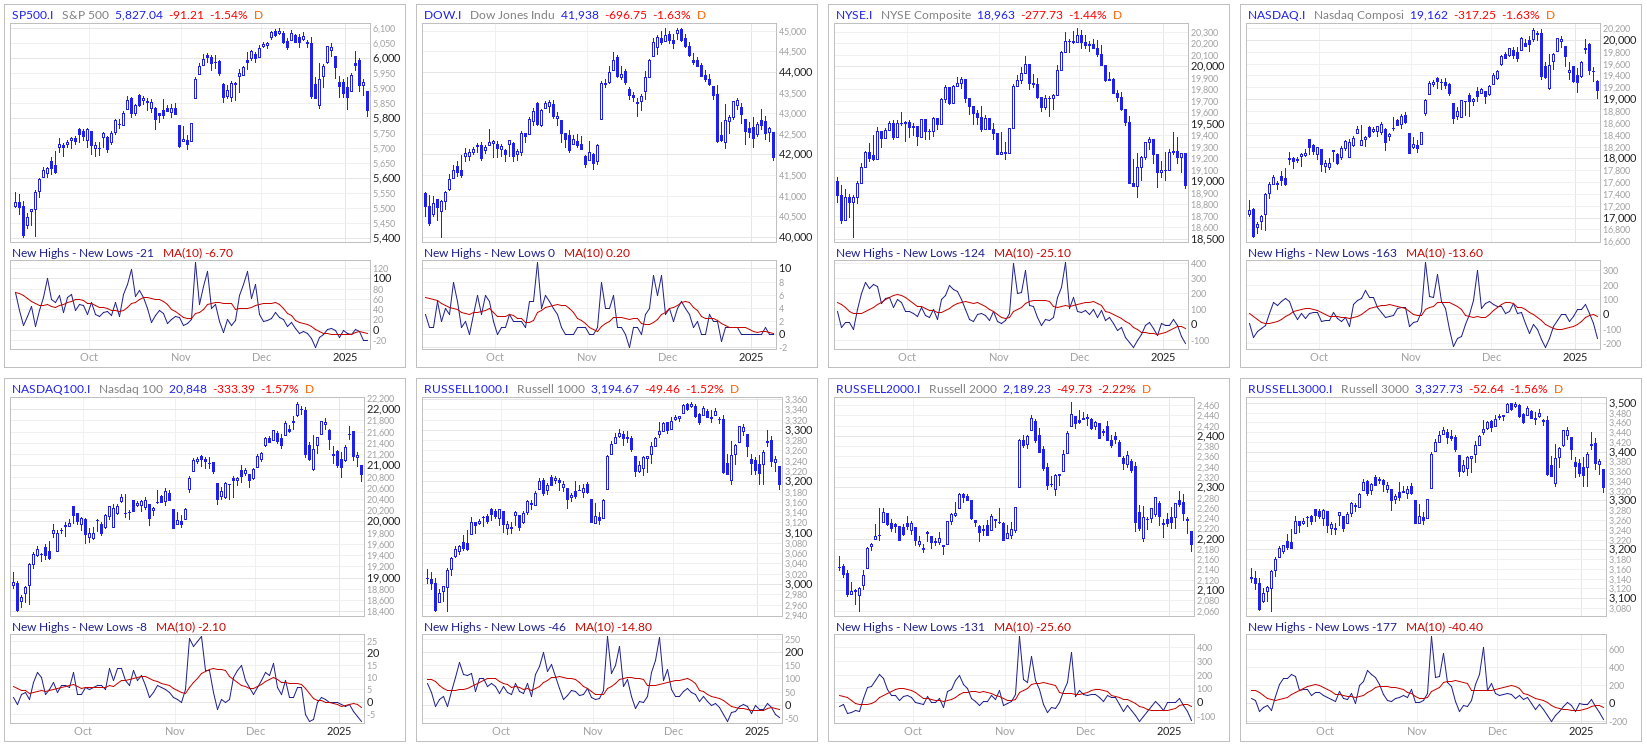
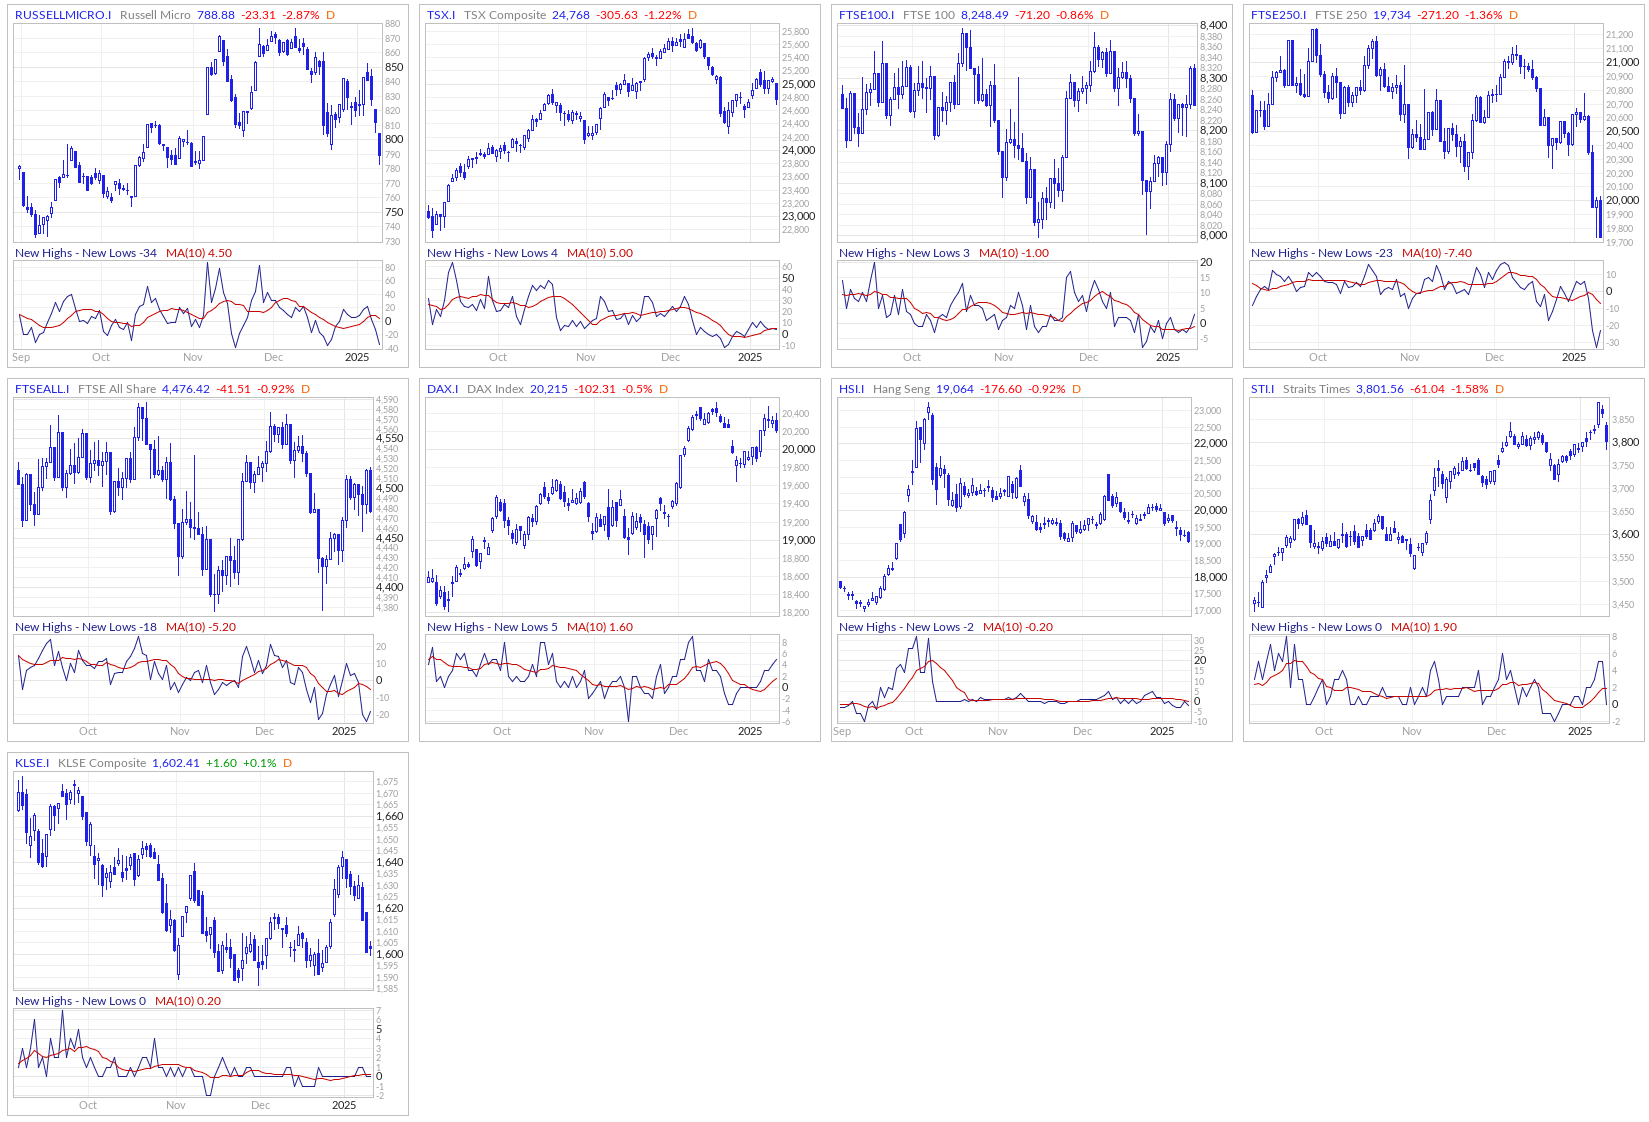
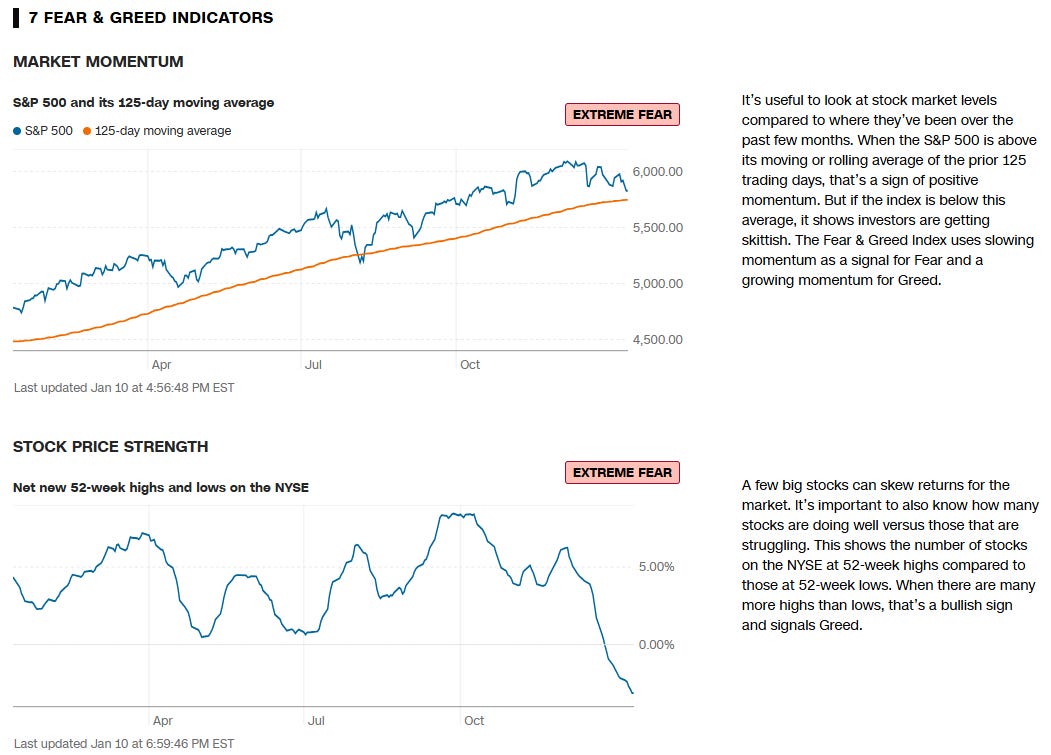
New Highs - New Lows
The New Highs - New Lows indicator (NH-NL) displays the daily difference between the number of stocks reaching new 52-week highs and the number of stocks reaching new 52-week lows. The NH-NL indicator generally reaches its extreme lows slightly before a major market bottom. As the market then turns up from the major bottom, the indicator jumps up rapidly. During this period, many new stocks are making new highs because it's easy to make a new high when prices have been depressed for a long time. The NH-NL indicator oscillates around zero. If the indicator is positive, the bulls are in control. If it is negative, the bears are in control. As the cycle matures, a divergence often occurs as fewer and fewer stocks are making new highs (the indicator falls), yet the market indices continue to reach new highs. This is a classic bearish divergence that indicates that the current upward trend is weak and may reverse.
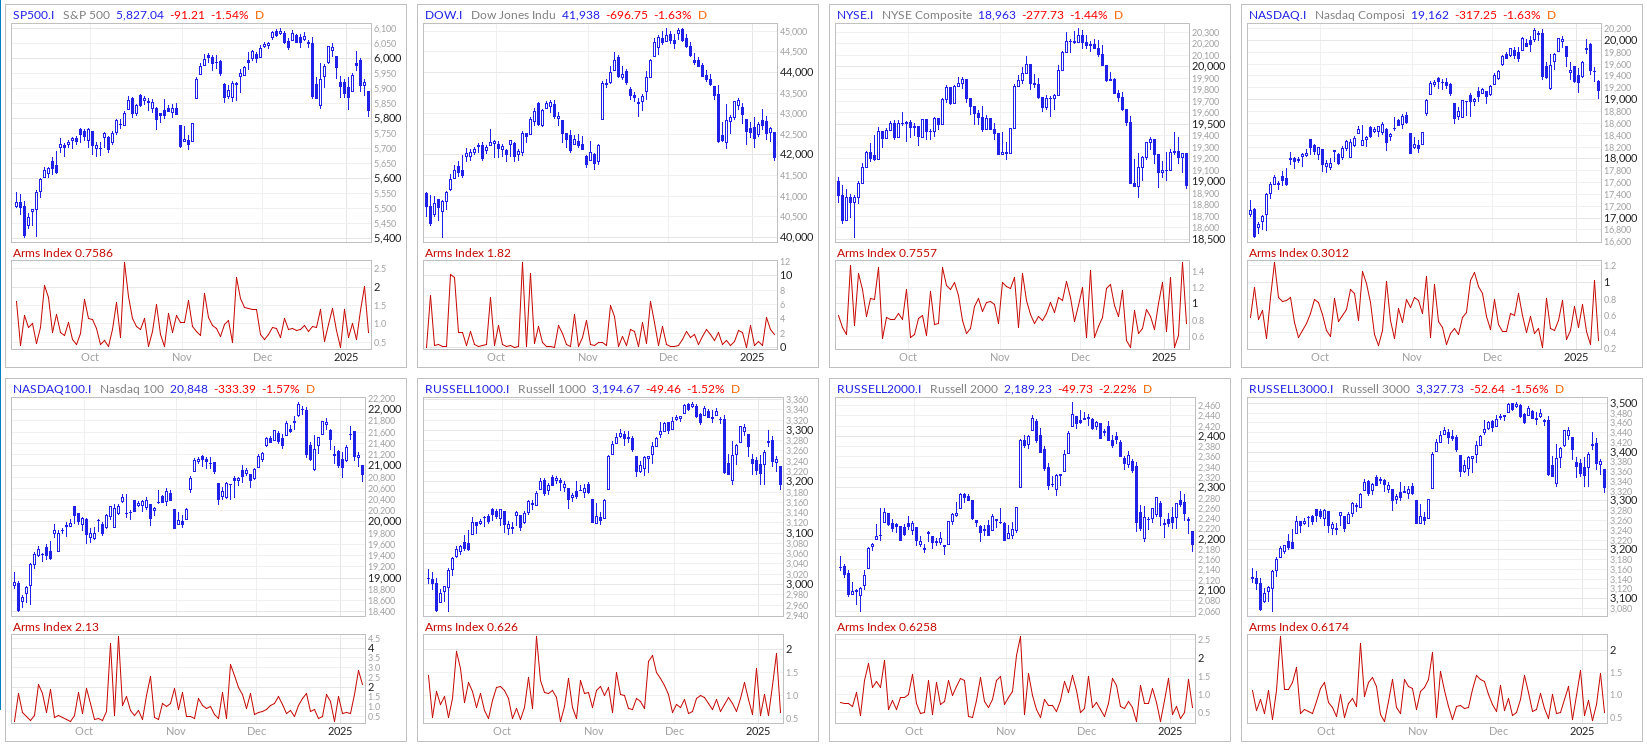
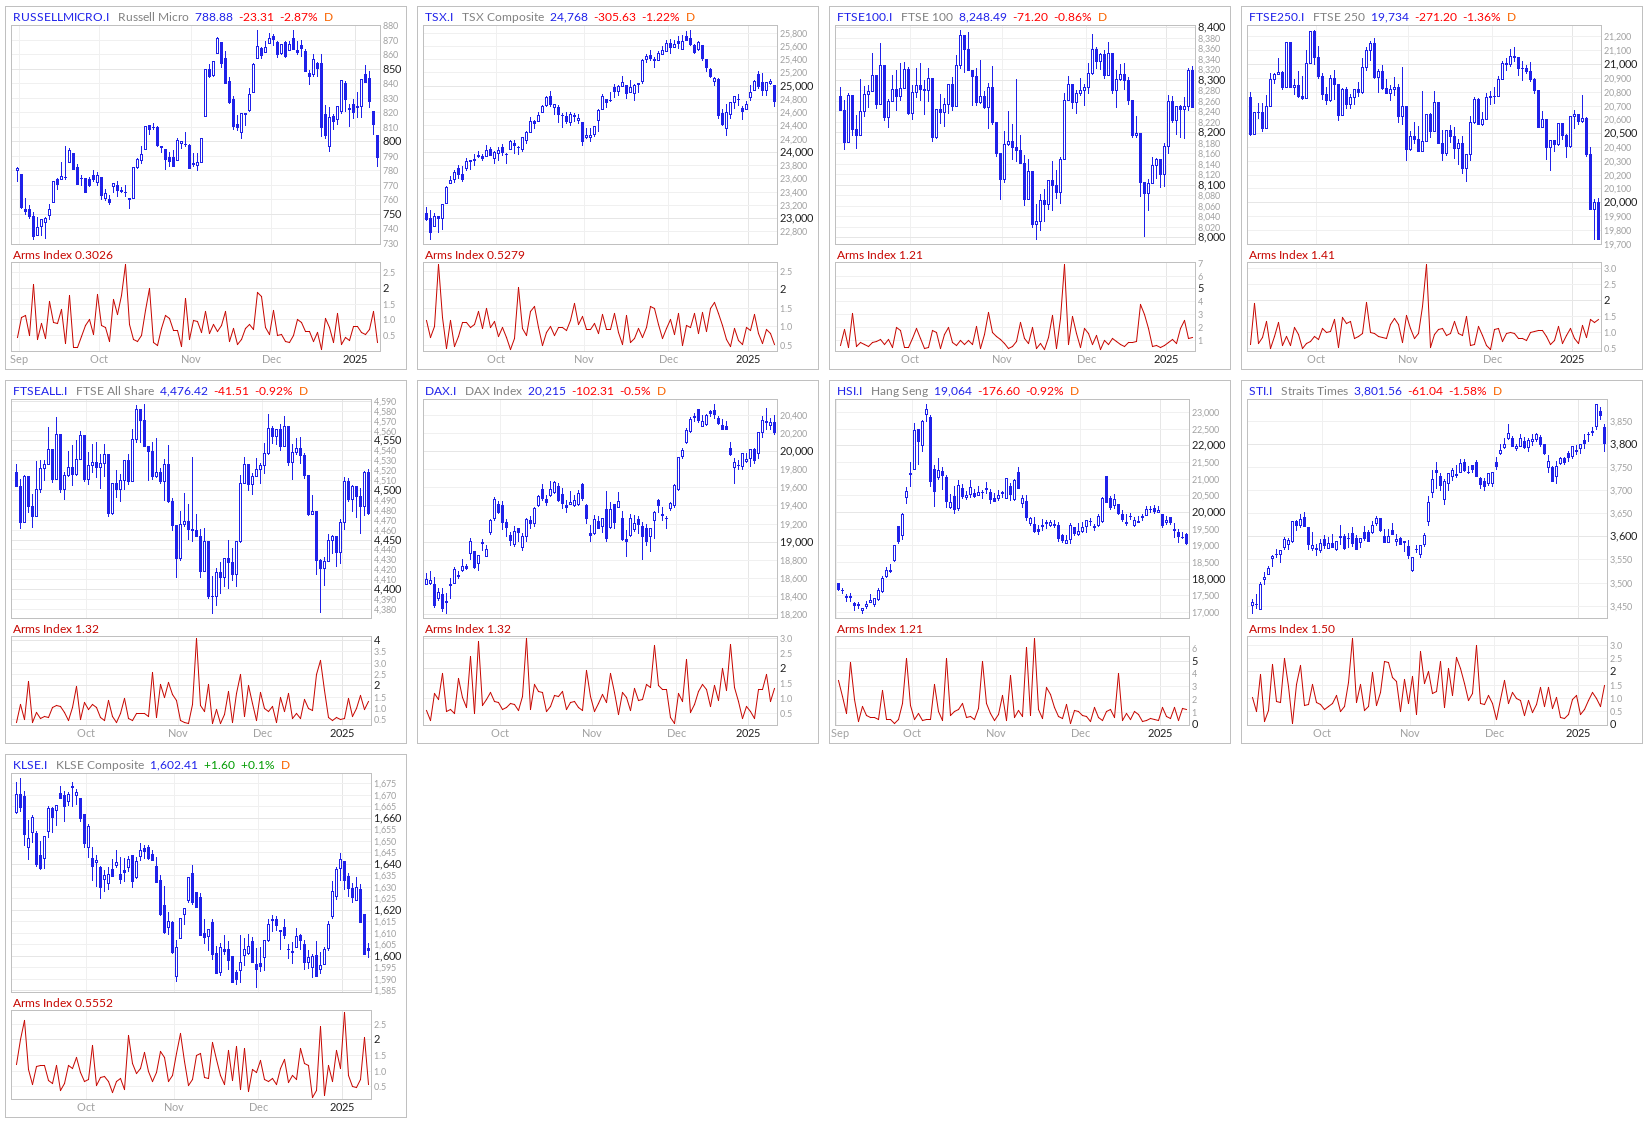
ARMS Index
The Arms Index, also known as the TRIN (Short-Term TRading INdex), was developed by Richard Arms in the 1960s. It is calculated by dividing the ratio of advancing stocks to declining stocks by the ratio of advancing volume to declining volume. Interpreting the Arms Index involves looking at its value in relation to certain thresholds. A value below "1" is considered bullish, indicating that advancing stocks and volume dominate the market. Conversely, a value above "1" is considered bearish, suggesting that declining stocks and volume are more prevalent. Extremely low values (below 0.5) or high values (above 2) are often seen as potential reversal signals.
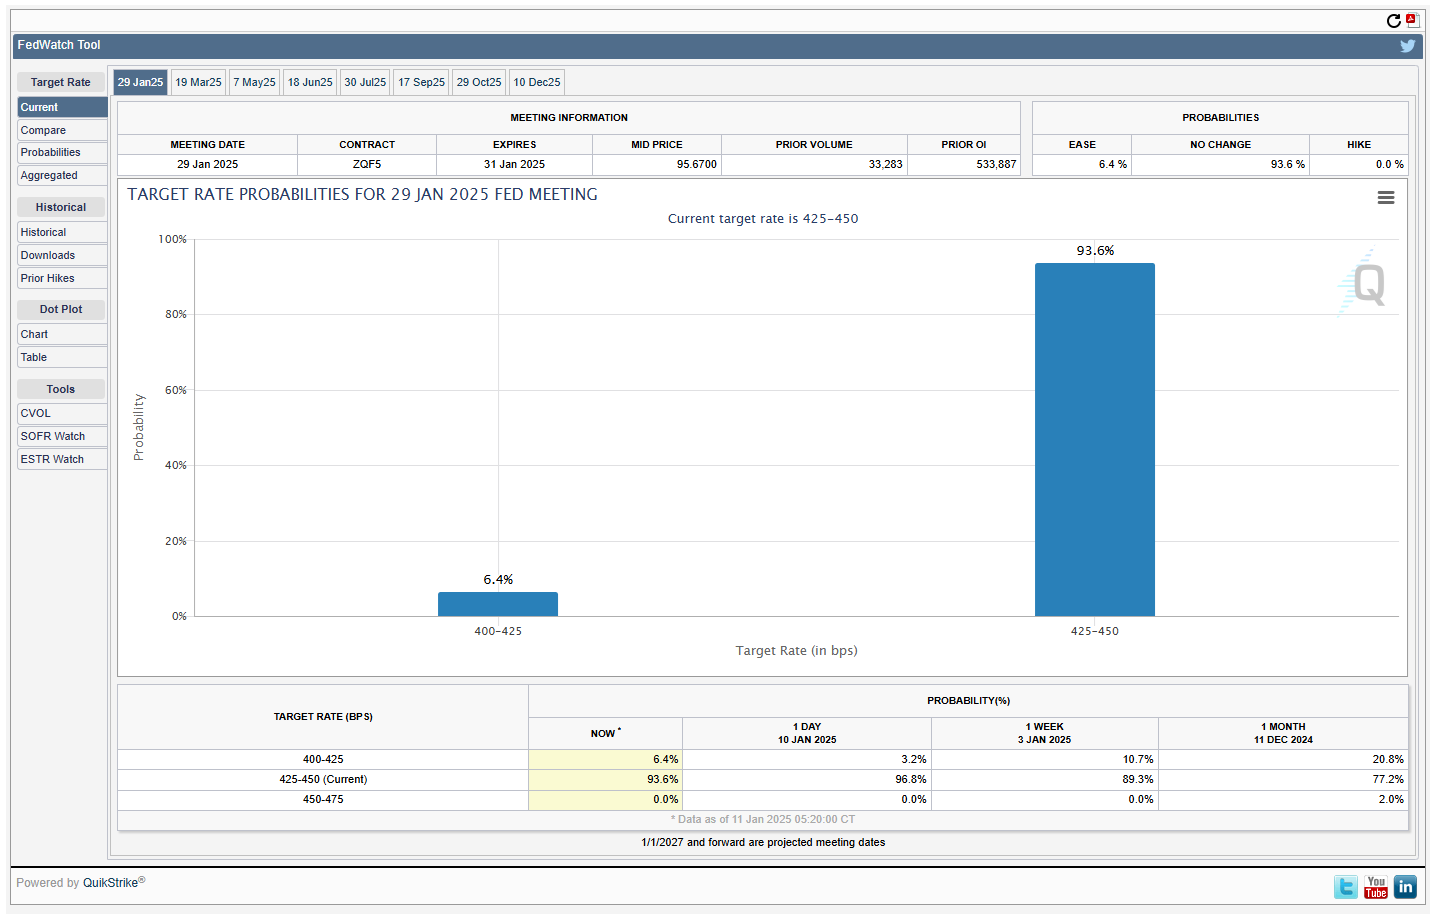
CME Fedwatch
What is the likelihood that the Fed will change the Federal target rate at upcoming FOMC meetings, according to interest rate traders? Use CME FedWatch to track the probabilities of changes to the Fed rate, as implied by 30-Day Fed Funds futures prices.
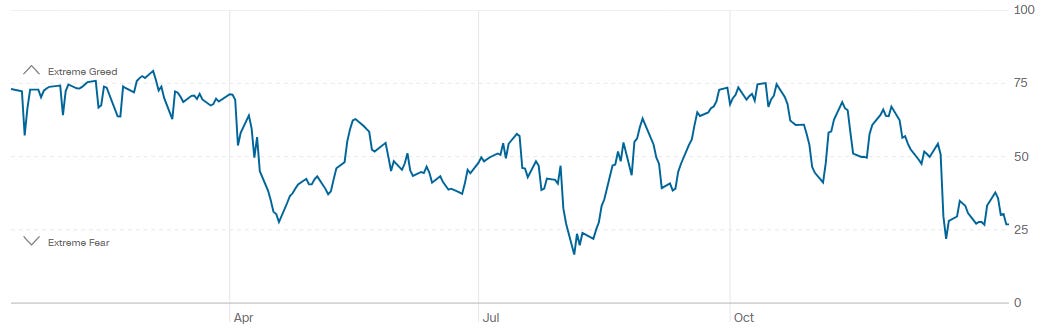
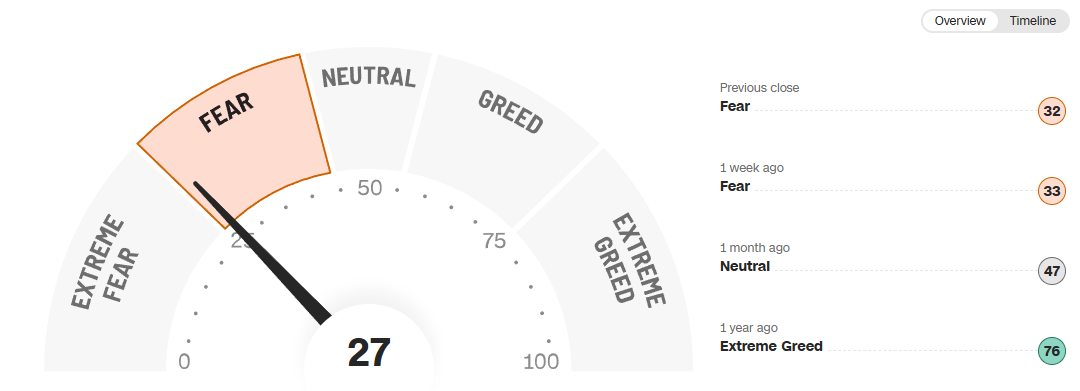
CNN Fear & Greed Constituent Data Points & Composite Index
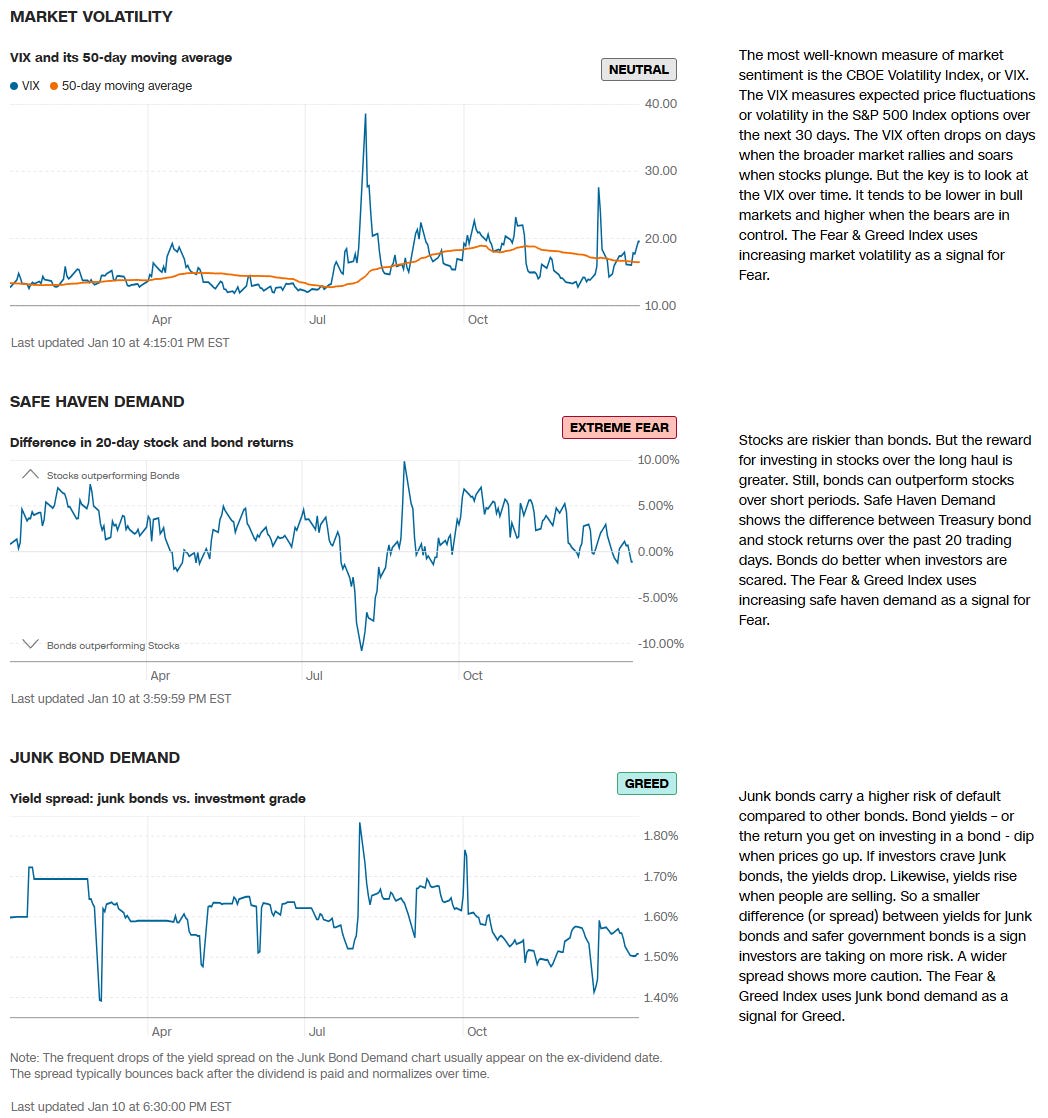
Final Composite Fear & Greed Index Reading
Institutional S/R Levels for Major Indices
When you’re a large institutional player, your primary goal is to find liquidity - places to do a ton of business with the least amount of slippage possible. VolumeLeaders.com automatically identifies and visually plots the exact spots where institutions are doing business and where they are likely to return for more. It’s one of the primary reasons “support” and “resistance” concepts work and truly one of the reasons “price has memory”.
Levels from the VolumeLeaders.com platform can help you formulate trades theses about:
Where to add or take profit
Where to de-risk or hedge
What strikes to target for options
Where to expect support or resistance
And this is just a small sample; there are countless ways to leverage this information into trades that express your views on the market. The platform covers thousands of tickers on multiple timeframes to accommodate all types of traders. Observe for yourself how accurate the levels are by marking-up your charts with the information in the “Trade Levels” boxes and play-along in real-time this week.
SPY -0.01%↓
SPY’s December rebound stalled near the $590–$595 region, which had previously acted as support but is now serving as overhead supply. The ETF recently broke below the mid‐$580s—another short‐term pivot—and is hovering near $580, where institutional participation has been notable in the past.
If buyers can defend this $580–$581 zone and drive price back above $585–$590, it would suggest a potential bullish turnaround. However, failure to hold above these support levels raises the likelihood of retesting December’s lows in the mid‐$570s. Essentially, SPY sits at a critical juncture: reclaiming $585–$590 could initiate recovery, while further weakness under $580 points to continued downside risk.
QQQ 0.01%↑
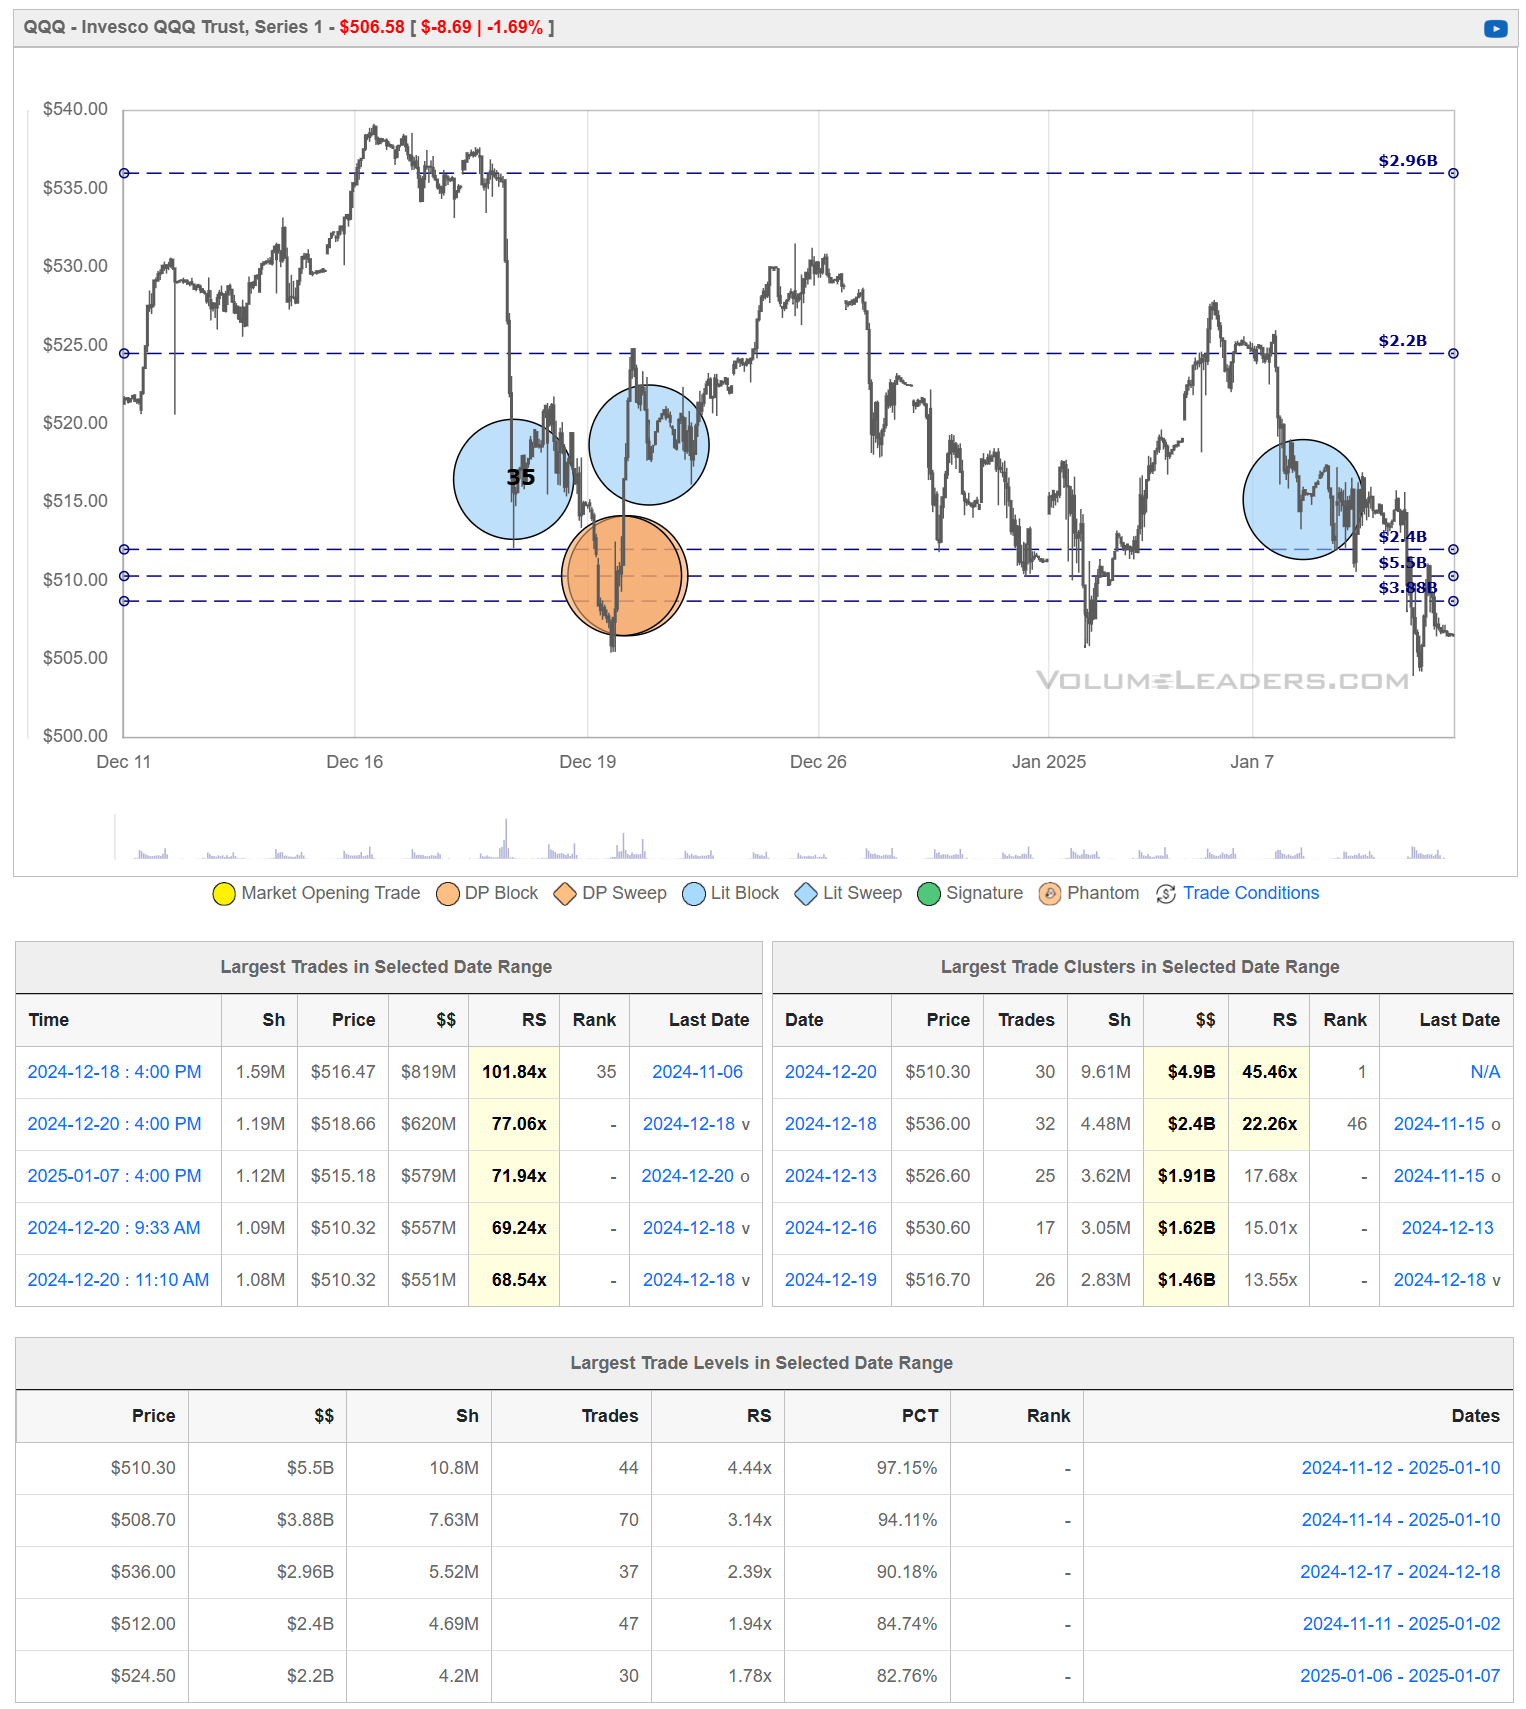
QQQ’s late‐December bounce stalled below the $520–$525 area, where prior heavy trading continues to act as overhead supply. The ETF is now drifting toward the $505–$510 zone, a region highlighted by notable institutional transactions that could serve as near‐term support.
Should buyers successfully defend this band and push price back above $515–$520, QQQ could stage a more meaningful recovery attempt. However, a failure to hold the $505 level opens the door to retesting the December lows near $500, underscoring the still‐fragile market sentiment.
IWM 0.07%↑
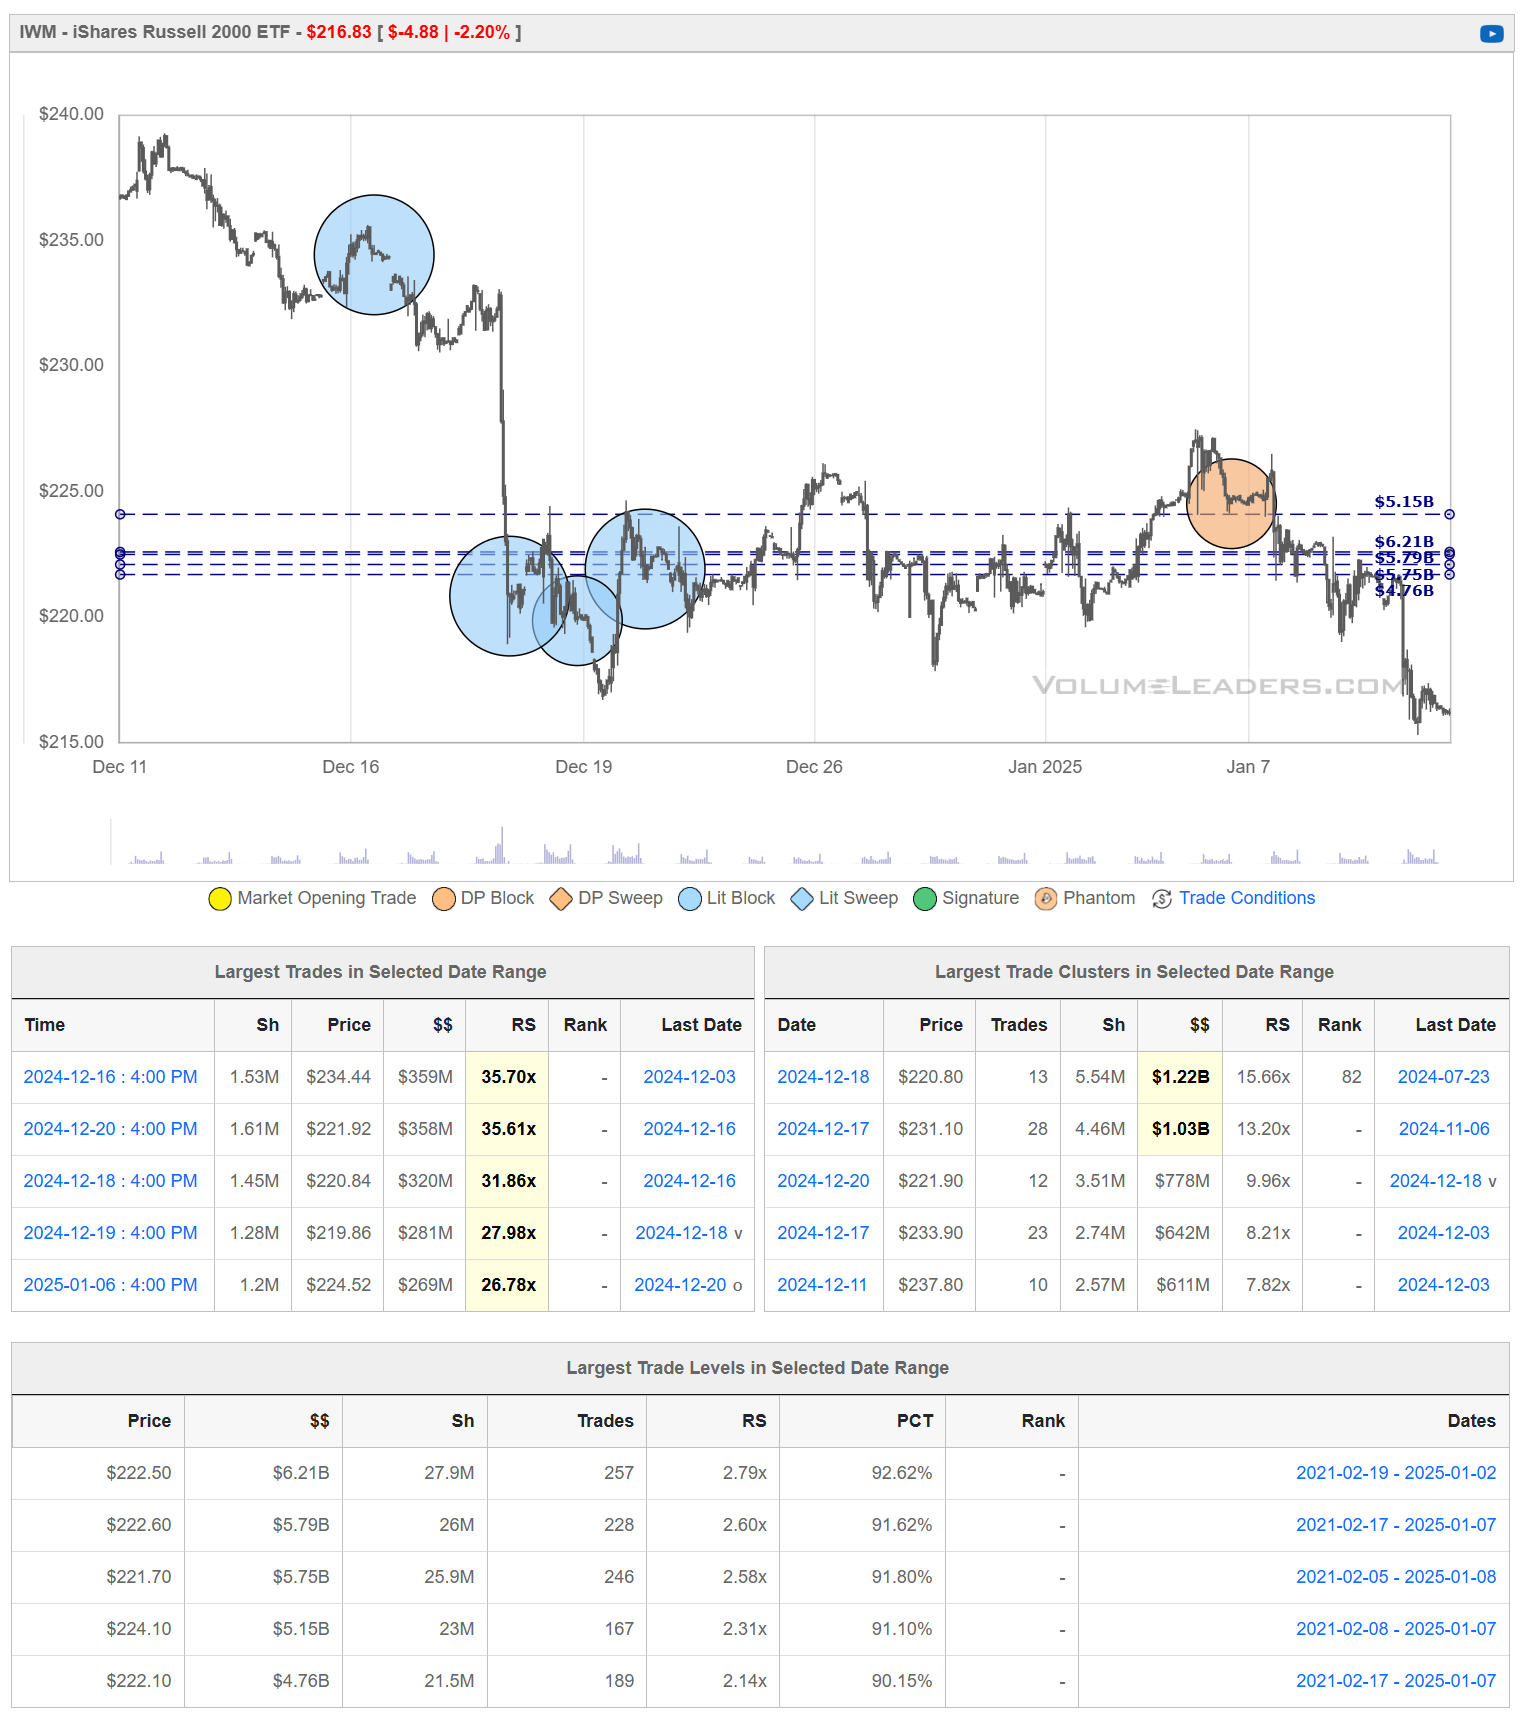
IWM’s mid‐December plunge from the mid‐$230s down toward $220 briefly stabilized thanks to notable institutional trades around the $220–$222 zone. However, the ETF failed to sustain a move back above the heavier supply in the $225–$228 region and is now rolling over once again, with price dipping below $220.
If IWM can recapture and hold the $220–$222 band, it would signal buyers are willing to step in and absorb remaining selling pressure, possibly setting the stage for a more durable rebound. Conversely, continued weakness below $215–$216 increases the odds of further downside exploration, as sellers maintain the upper hand in the near term.
DIA 0.00%↑
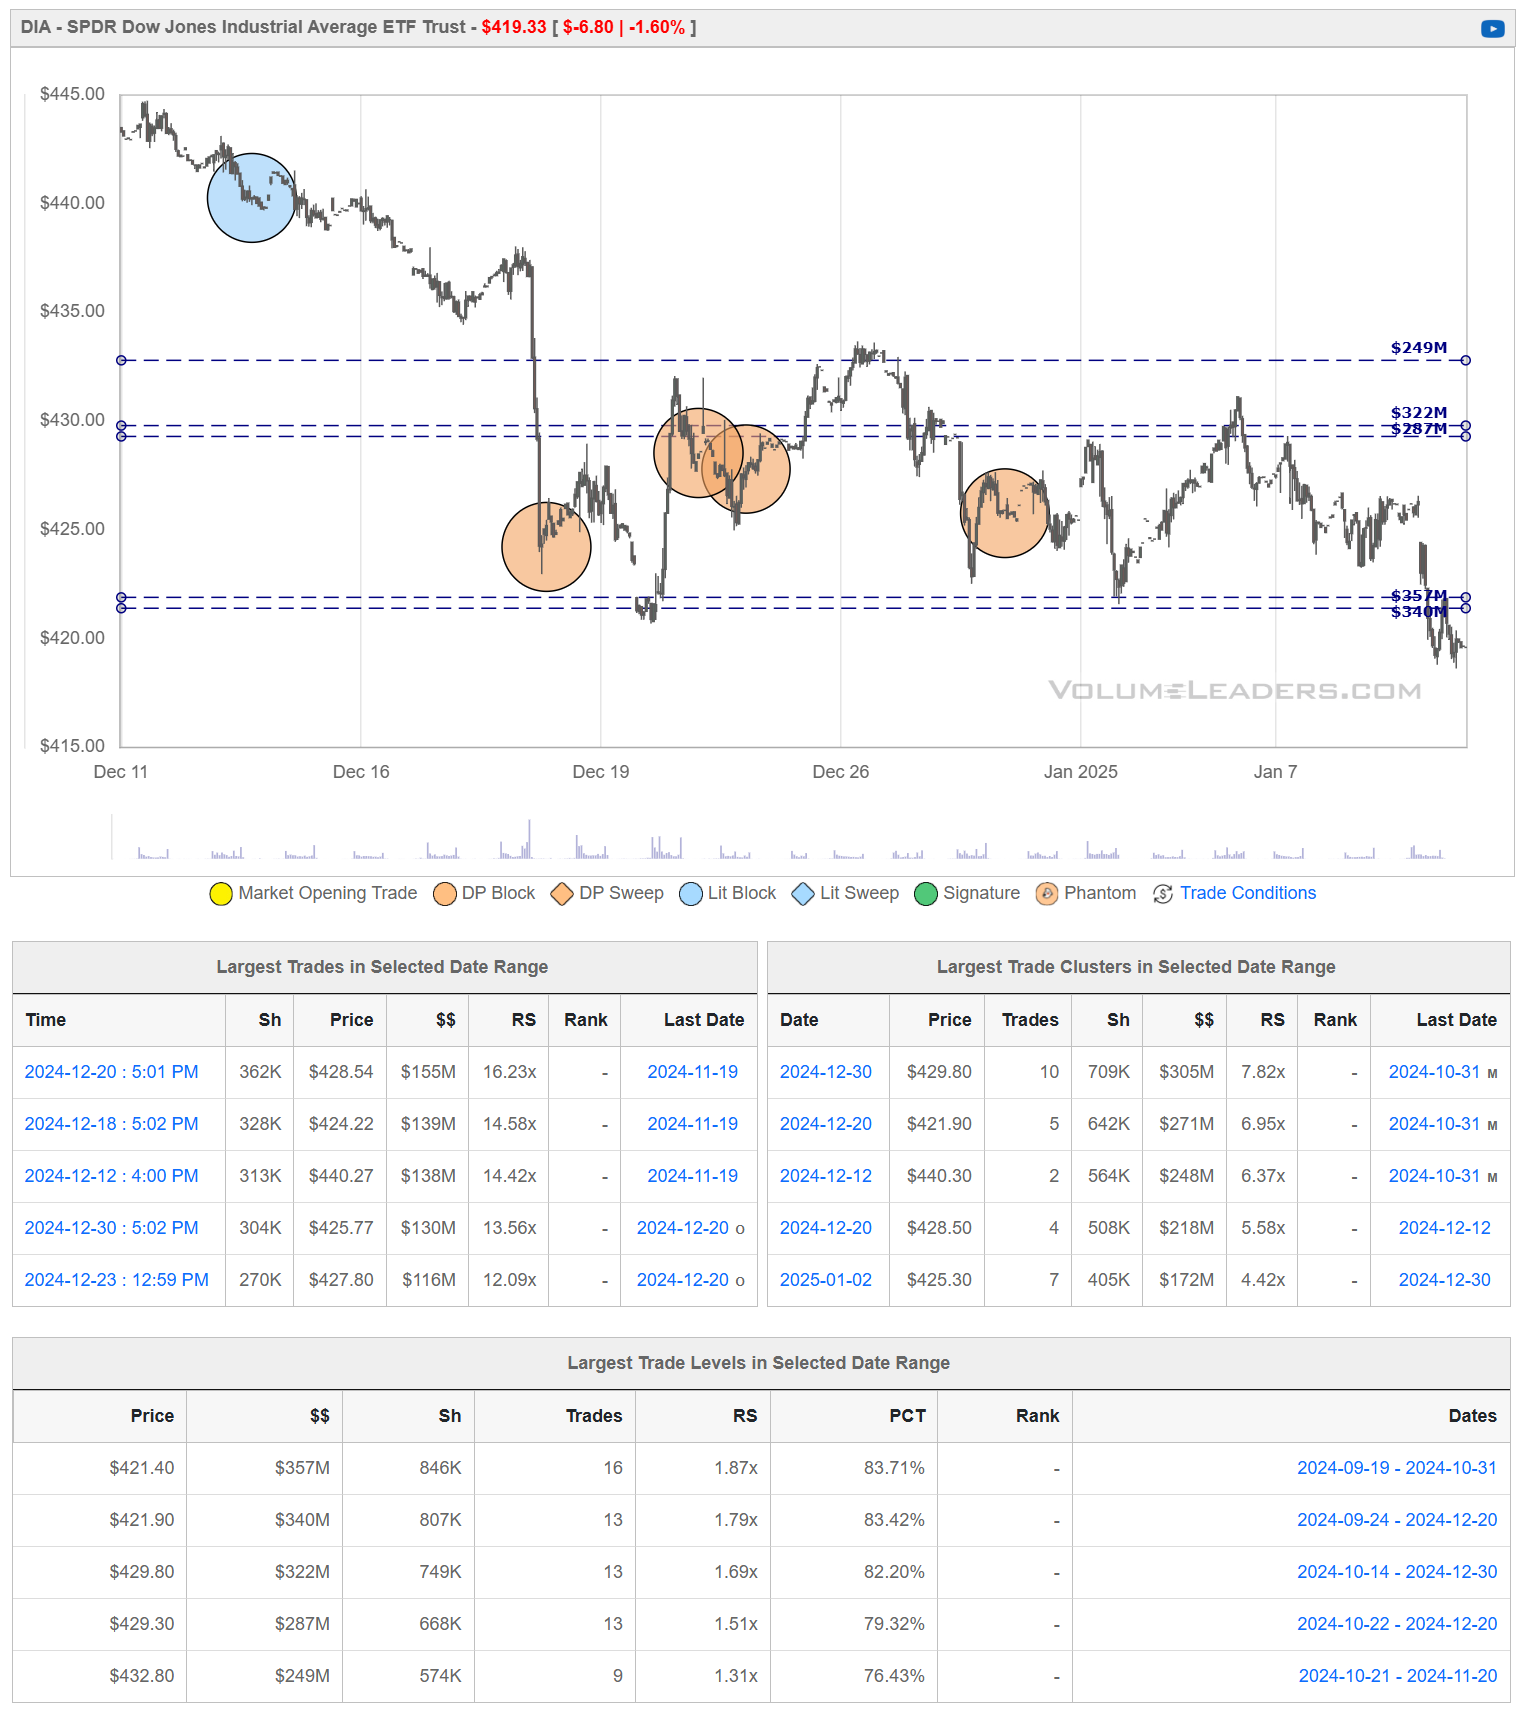
DIA has continued its downtrend from the mid‐$430s, recently slipping below the $420 area where earlier institutional trades had offered a tentative floor. Price is now hovering in the high‐$410s to low‐$420s, struggling to regain the $425–$430 zone, which has repeatedly served as strong overhead resistance.
If buyers can step in and push DIA back above $425, it would signal that the market is finally absorbing lingering sell orders and could trigger a more meaningful rebound. On the other hand, a failure to clear this resistance band—or a drop below the December/January lows near $415–$420—would reaffirm the broader downtrend and raise the likelihood of an extended move lower.
Institutional Order Flow
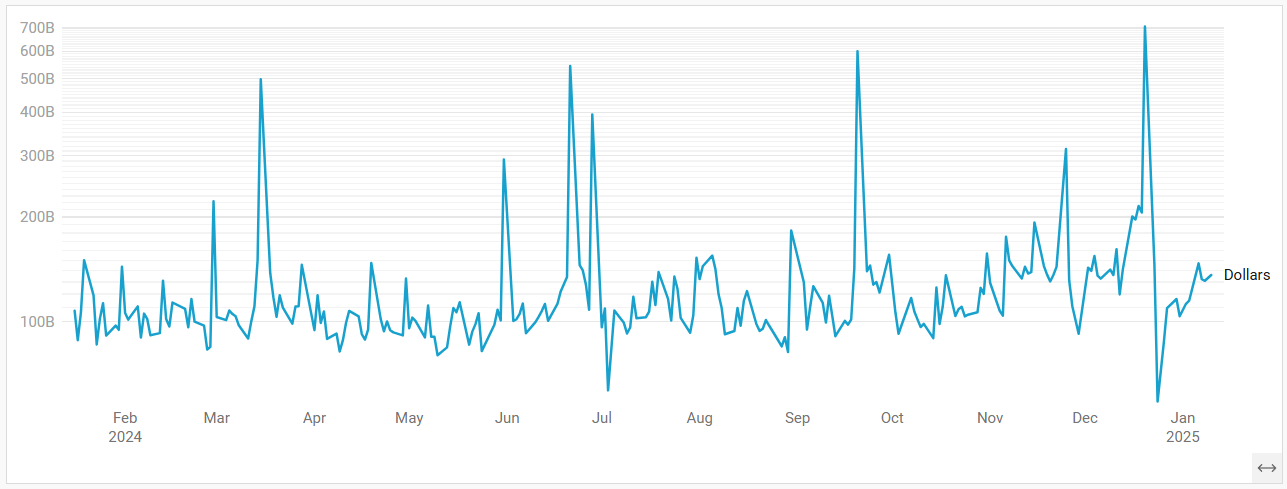
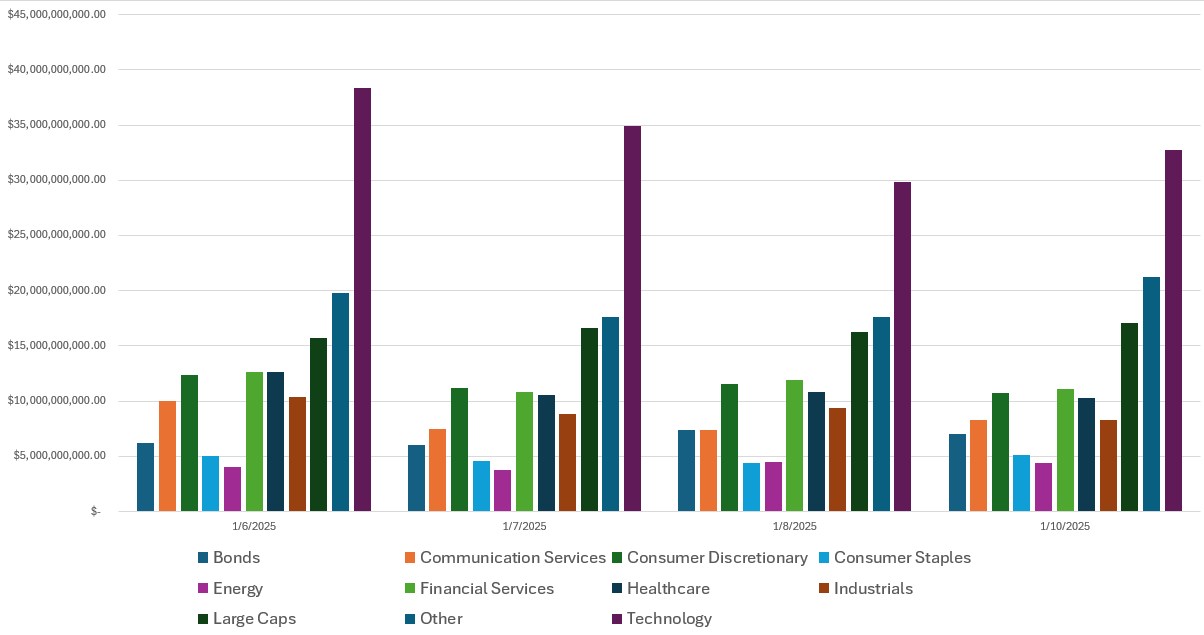
Rolling 1-Yr Dollars By Day
This chart shows institutional activity by dollars by day on a rolling 1-year basis. From a theoretical standpoint, examining a chart of daily institutional dollar activity over the course of a year can offer several insights and possible inferences, though all should be approached with caution since the data alone may not prove causality or confirm underlying reasons. Some potential takeaways include:
Event-Driven Behavior:
Sharp, singular spikes on certain days might correlate with major market-moving events. These could include central bank policy announcements, significant geopolitical news, sudden macroeconomic data releases (like employment reports or GDP data), earnings seasons for large-cap companies, or unexpected shocks (e.g., mergers, acquisitions, regulatory changes).Liquidity Dynamics:
Institutions often concentrate large trades on days with higher expected liquidity. For instance, heightened activity might coincide with index reconstitutions, option expiration dates, or the days leading up to or following a major index rebalance, when large amounts of capital shift hands simultaneously.Risk Management and Hedging Activity:
Institutions may significantly adjust their exposures on days that are critical from a risk management perspective. Large spikes can occur if hedge funds, pension funds, or asset managers are rolling over futures contracts, initiating or closing out large hedges, or reacting to volatility triggers.Market Sentiment Indicators:
While the data is purely transactional, the sheer volume of institutional involvement on certain days might indirectly hint at changing sentiment or strategic shifts.
In essence, a chart like this can lead you to hypothesize that institutional trading volumes are not constant or random but rather influenced by a mix of predictable calendar effects, major market events, liquidity considerations, risk management decisions, and strategic allocation shifts.
Last Week’s Institutional Activity By Sector
This is an incredibly important chart to watch as it contains lots of nuanced suggestions at a thematic level. Watch this chart closely week-to-week to stay informed about where institutional money is flowing, adjust your strategies based on momentum, align your portfolio with macroeconomic and market trends, and manage risks more effectively by avoiding sectors losing institutional favor. The Top 10 active sectors are identified and the rest grouped as “Other”.
Sector Rotation Insights: The chart highlights which sectors are attracting institutional activity and which are losing favor. Institutions often lead market trends, so tracking shifts in their focus can indicate sector rotations.
Sentiment Analysis: The level of institutional activity reflects confidence in specific sectors. Rising activity in traditionally defensive sectors (e.g., healthcare, utilities) may indicate caution, while a surge in growth sectors (e.g., technology, consumer discretionary) could suggest optimism.
Emerging Trends: Sudden spikes in a previously overlooked sector, like industrials or consumer staples, might hint at emerging opportunities or structural shifts.
Macro Themes: Changes in sector activity often align with broader macroeconomic themes like inflation, interest rates, or geopolitical events. For instance:
Increased activity in energy might indicate concerns about oil supply or rising prices.
Growth in technology could align with innovations or favorable policies.
Risk Management: Declining institutional activity in a sector might signal weakening fundamentals or heightened risks.
Spotting Overcrowding: Excessive activity in a single sector over multiple weeks may suggest overcrowding, which could lead to heightened volatility if institutions begin to exit.
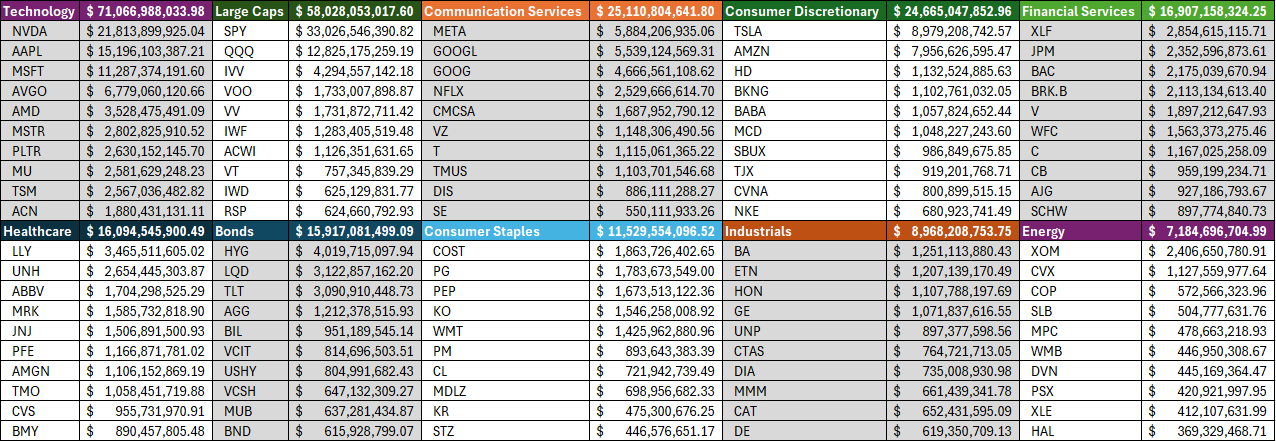
This Week’s Institutional Order Flow Insights
1. Technology Dominates Institutional Attention
Order Flow: Technology sector tops the chart with over $71 billion in institutional inflows, led by names like NVIDIA (NVDA) and Apple (AAPL).
Implication: The heavy focus on technology indicates strong confidence in growth and innovation-oriented sectors. This could reflect expectations for continued advancements in AI, semiconductors, and tech infrastructure.
2. Healthcare Shows Resilience
Order Flow: Healthcare follows technology with over $16 billion, led by Eli Lilly (LLY) and UnitedHealth Group (UNH).
Implication: Healthcare’s stability suggests a defensive posture among institutions, potentially hedging against macroeconomic uncertainty.
3. Large Caps See Significant Flows
Order Flow: Large caps received $58 billion in total, with ETFs like SPY and QQQ leading.
Implication: A broad allocation to large caps indicates institutional preference for high-quality, liquid assets. This could reflect a cautious yet optimistic view on broader market indices.
4. Energy Gains Momentum
Order Flow: Energy inflows were over $7 billion, led by ExxonMobil (XOM) and Chevron (CVX).
Implication: Rising energy sector flows could reflect expectations of stronger oil prices or geopolitical factors influencing supply chains.
5. Consumer Discretionary Signals Growth Bets
Order Flow: The sector saw $24.6 billion, with Tesla (TSLA) and Amazon (AMZN) receiving the largest inflows.
Implication: Institutions are betting on consumer spending resilience, likely driven by optimism about wage growth or lower inflation expectations.
6. Bonds Attract Modest Inflows
Order Flow: Bonds recorded $15.9 billion, led by HYG and LQD.
Implication: A moderate allocation to bonds reflects a balanced risk appetite. Institutions might still seek safety amid lingering recession fears.
7. Sector Rankings and Short-Term Sentiment
Sector Flow Rankings: Technology > Healthcare > Consumer Discretionary > Financial Services > Industrials > Energy > Consumer Staples > Bonds.
Implication: The dominance of growth-oriented sectors (Technology and Consumer Discretionary) suggests bullish sentiment for risk assets. However, defensive inflows into Healthcare and Financial Services indicate a degree of caution.
General Market Implications for the Short Term
Bullish Tone with Caution:
Heavy inflows into technology and large caps suggest optimism for a rally in growth names.
Defensive sectors like Healthcare receiving significant allocations point to a hedging strategy against potential market shocks.
The combination casts some doubts on whether any bullish pops next week are going to be long-lasting.
Sector Rotation in Progress:
Strong energy inflows could hint at sector rotation toward value names amid geopolitical or macro shifts.
Consumer Discretionary inflows suggest renewed faith in consumer resilience.
Key Risks to Watch:
If bond inflows rise further, it could signal increasing risk aversion.
Technology flows may face a pullback if earnings or guidance disappoint expectations.
Several names from the Financial sector report earnings this week. The sector tends to be a bit of a bell-weather for the economy and due to its interconnectedness with other industries, could have significant implications for the market as a whole if weakness is seen during their earnings this week:
Sentiment Impact on Broader Markets
Market Perception: Financials are often seen as a barometer of economic health. Weak earnings could indicate underlying issues in credit markets, loan growth, or consumer/business spending. This may weigh on overall market sentiment, especially in sectors reliant on strong financial systems (e.g., Industrials, Real Estate).
Risk Appetite: Poor performance in financials could lead to a shift toward risk-off sentiment, driving capital into defensive sectors (e.g., Healthcare, Utilities) and safe-haven assets like bonds or gold.
Concerns About Interest Rate Sensitivity
Interest Margins: Weak earnings may signal that higher interest rates are hurting net interest margins (NIMs) or reducing loan demand.
Policy Implications: If earnings reveal severe pressure from interest rates, markets might expect a more dovish stance from the Federal Reserve, potentially driving short-term rallies in growth sectors (e.g., Technology) but pressuring financial stocks further.
Credit Risk and Recession Fears
Credit Quality: Weak results might reflect deteriorating credit quality, rising delinquencies, or increased provisioning for loan losses. This could raise fears of economic slowdown or strain on consumers and businesses.
Implications for Consumers: Higher defaults or reduced loan availability may signal that consumers and businesses are under pressure, which could ripple into lower consumer spending or reduced capital investment.
Earnings Drivers to Watch
Investment Banking: A decline in investment banking revenue could point to reduced corporate activity (e.g., fewer IPOs, M&A deals), signaling hesitation among businesses to expand or take risks.
Trading Revenue: Weak trading results may indicate lower market volatility or reduced investor activity, which can dampen expectations for broader market performance.
Loan Growth and Deposits: Declining loan growth or deposits would suggest reduced confidence in economic conditions, potentially leading to a more cautious outlook.
Sector Rotation Out of Financials
Sector Weakness: Weak earnings could trigger a selloff in financial stocks, encouraging sector rotation into other areas like Technology, Consumer Discretionary, or Utilities.
ETF Impact: Financial ETFs like XLF may see outflows, dragging on overall index performance given financials' weighting in major benchmarks.
Implications for Related Sectors
Real Estate: Weak financial earnings, especially from banks, could signal tighter lending standards, negatively impacting the real estate sector.
Industrials and Consumer Staples: Companies dependent on credit availability may face additional challenges if financial conditions tighten further.
Short-Term Market Opportunities
Potential Volatility: Weak earnings from key players like JPMorgan, Bank of America, or Goldman Sachs could increase market volatility, creating opportunities for tactical trading.
Stock-Specific Plays: Some financials may outperform despite broader weakness (e.g., firms with strong wealth management divisions or exposure to alternative revenue streams).
Broader Market Implications
If the weakness is widespread, it could exacerbate concerns about a "hard landing" scenario for the economy.
A negative earnings surprise from financials could lead to downward revisions in overall earnings expectations for the S&P 500, increasing the likelihood of market corrections.
Conversely, a dovish Fed response to weak earnings (e.g., signaling slower rate hikes or cuts) could provide some support to growth-oriented stocks.
Top Institutional Order Flow In Individual Names
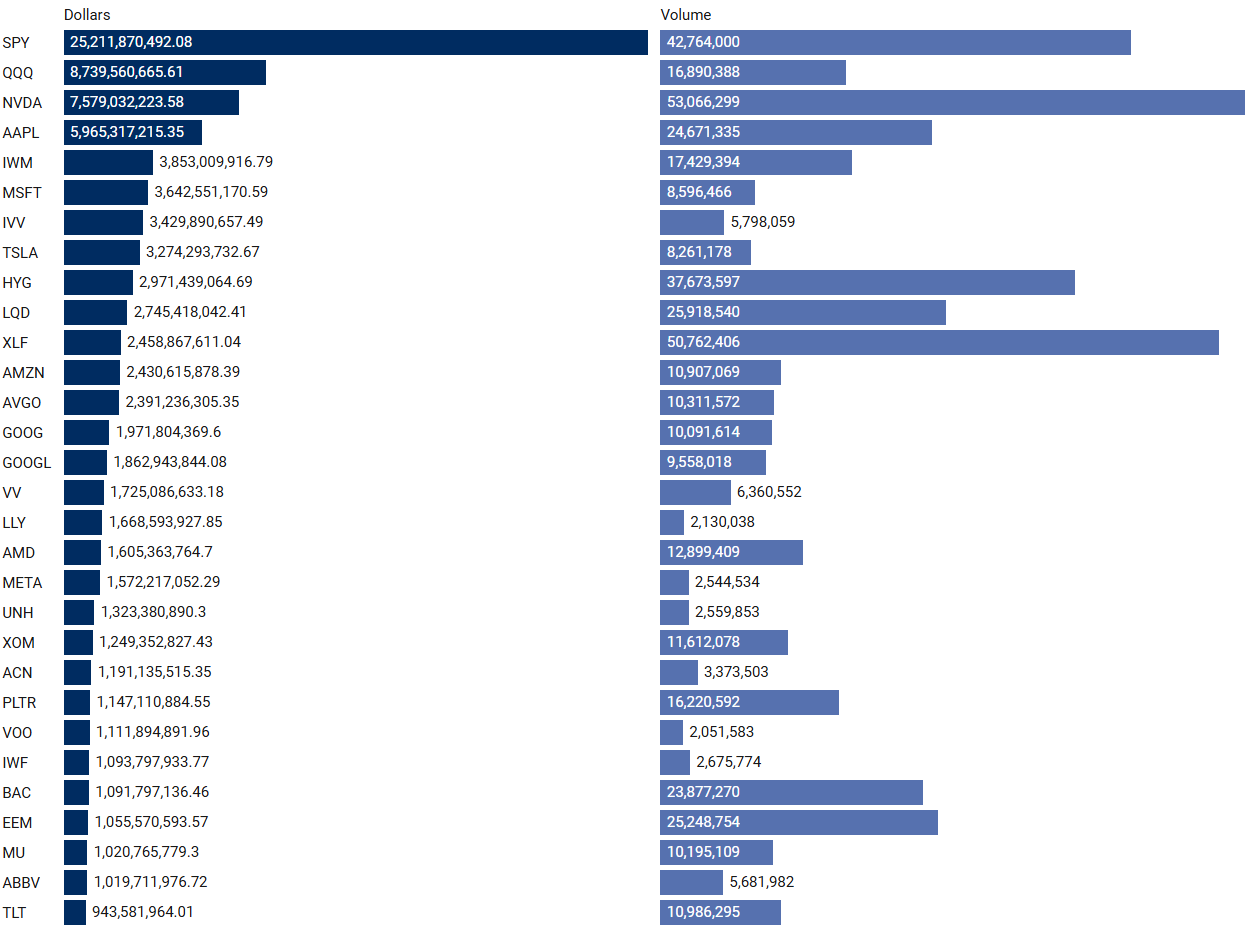
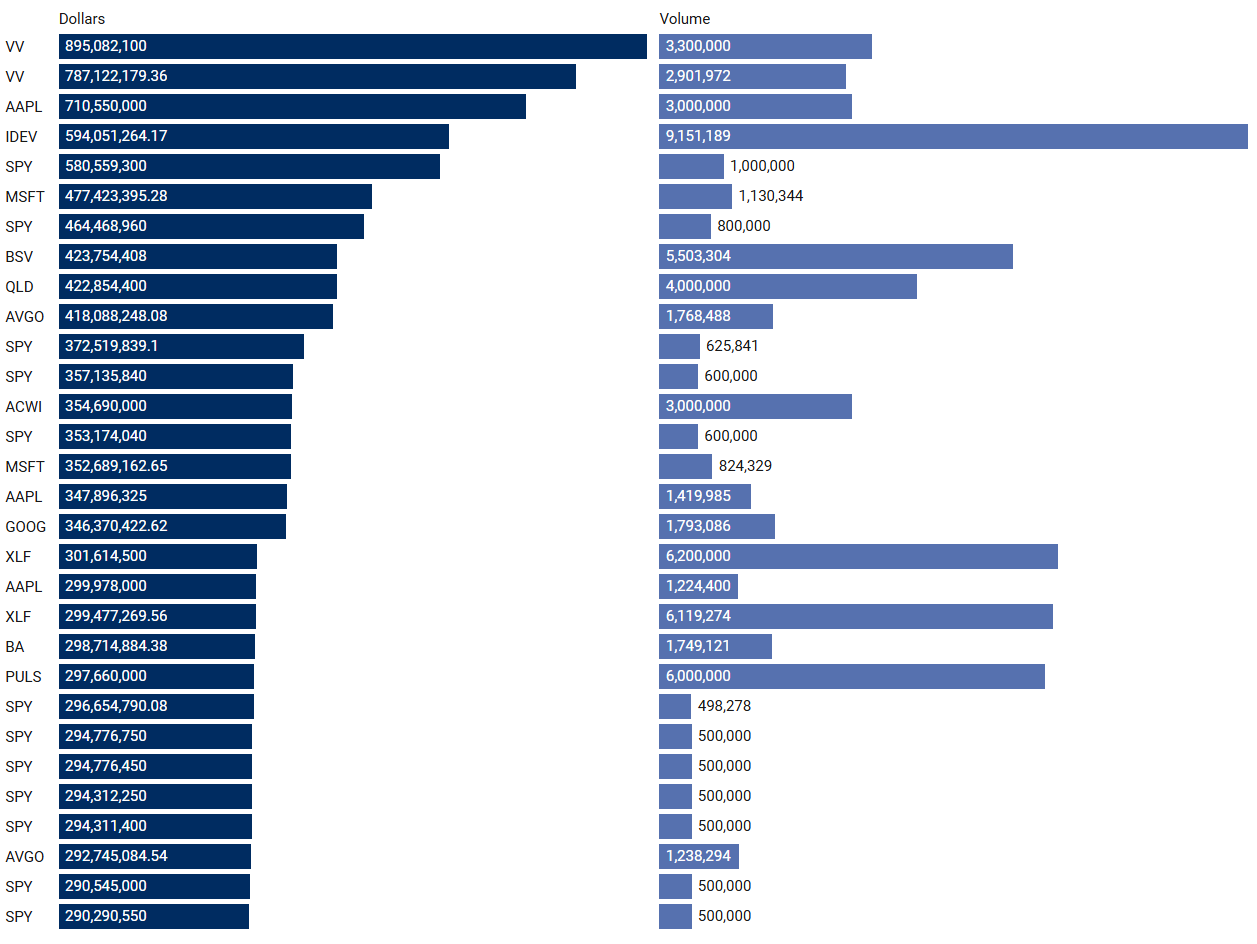
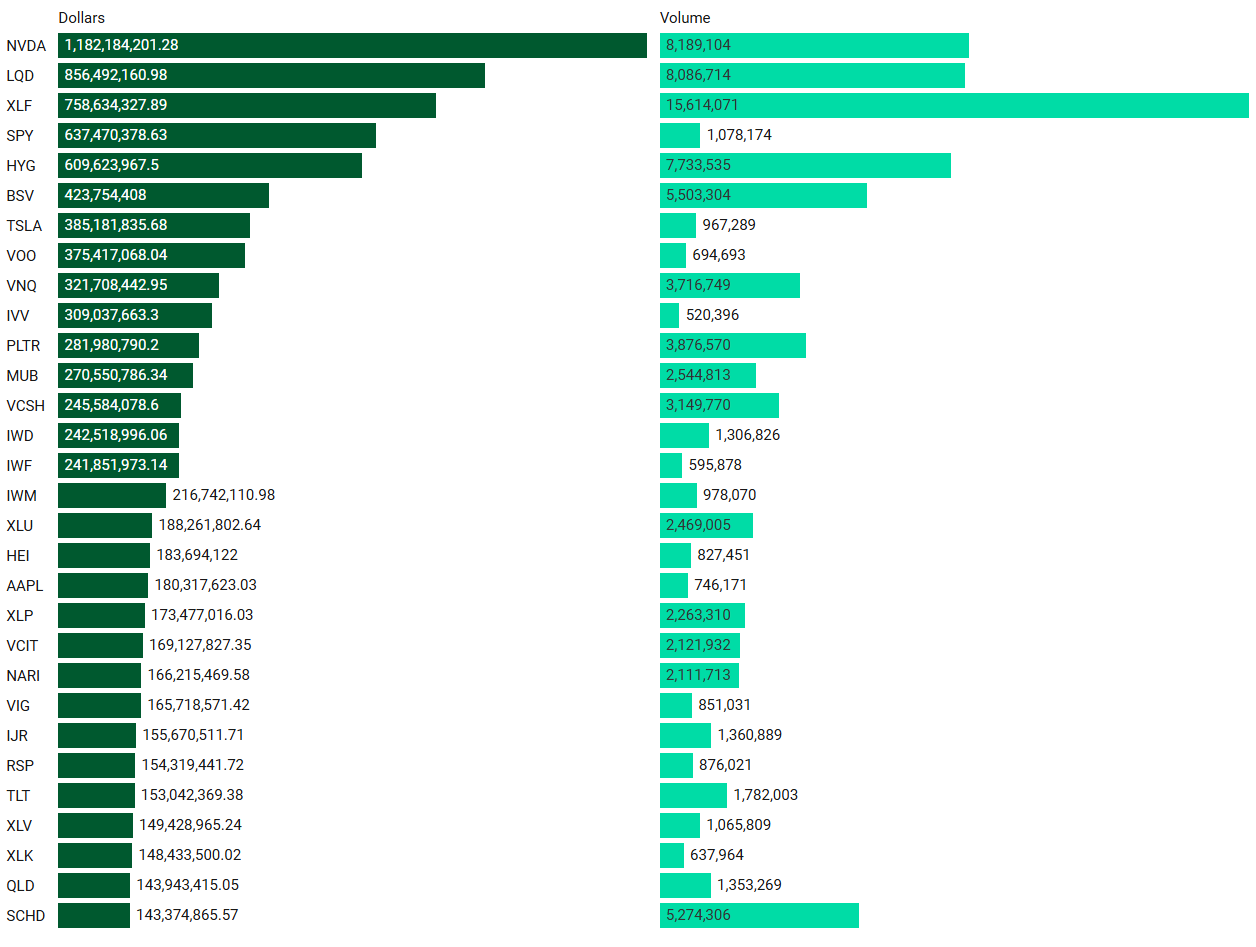
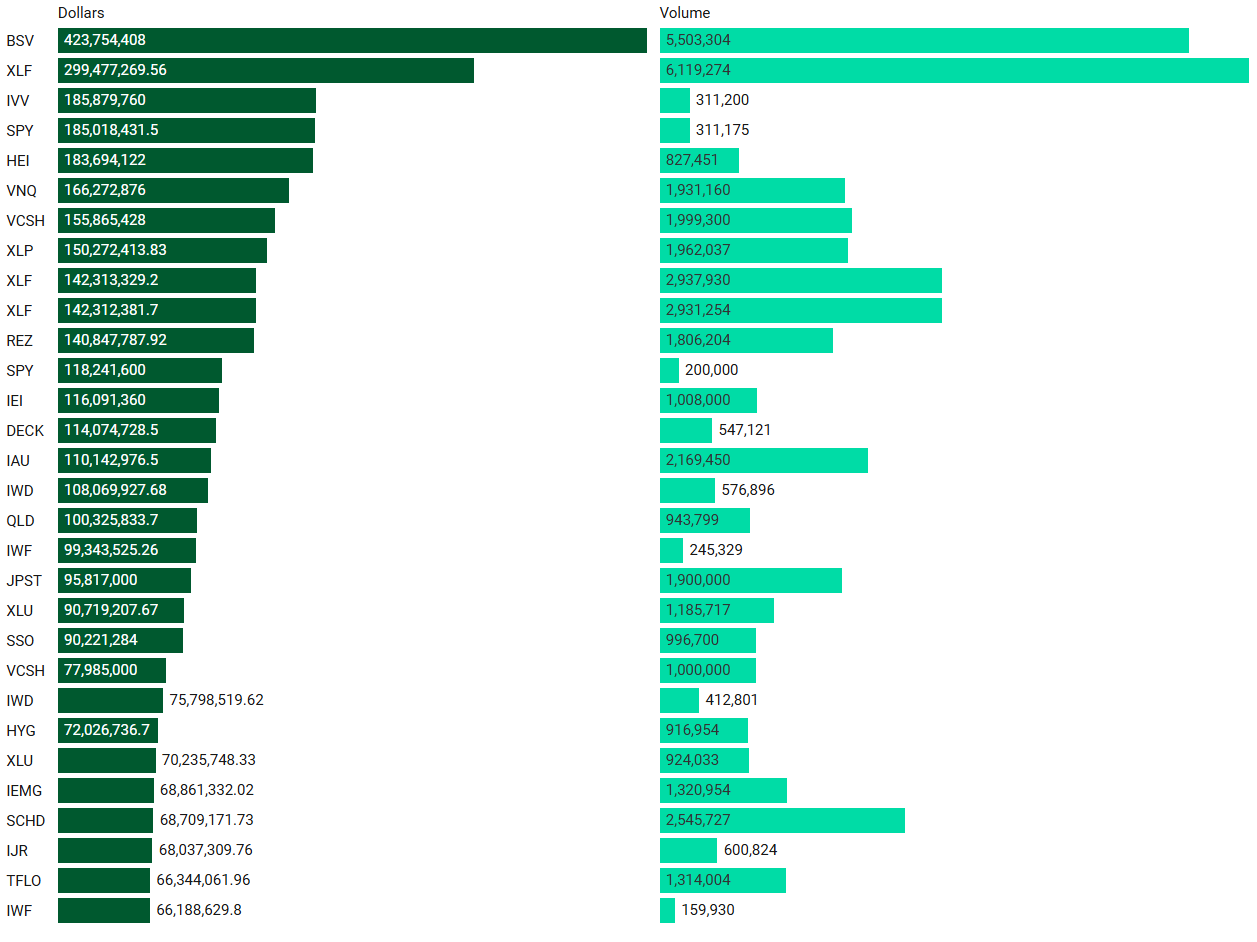
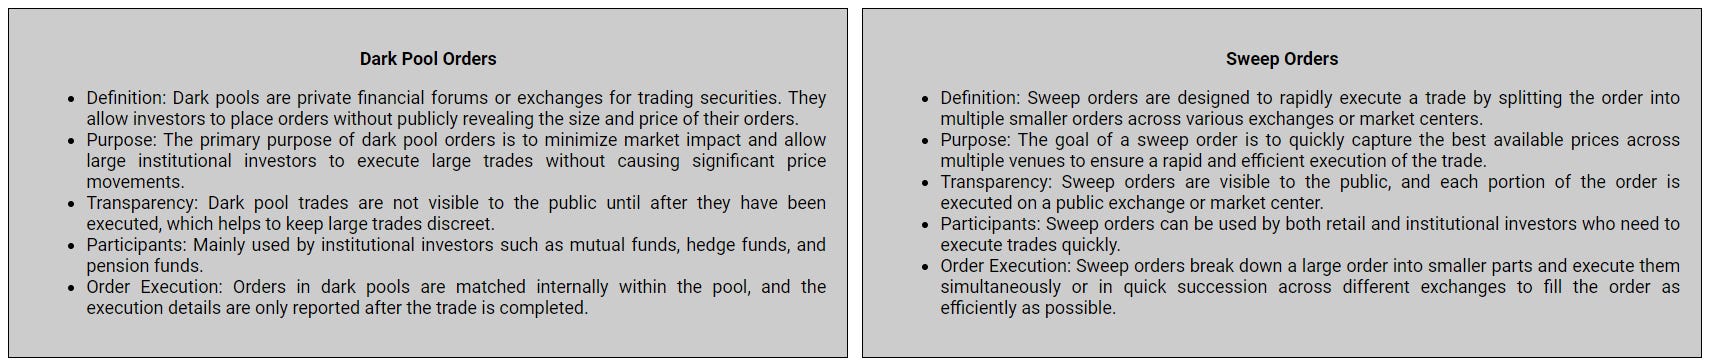
Many excellent trade ideas and sources of inspiration can be found in these prints. While only the top 30 from each group are displayed, the complete results are accessible in VolumeLeaders.com for you to explore at your convenience any time. Remember to configure trade alerts within the platform to ensure you never overlook institutional order flows that capture your interest or are significant to you. The blue charts encompass all types of trades, including blocks on lit exchanges; the purple charts exclusively depict dark pool trades; and the green charts represent sweeps only.
Largest By Aggregated Dollars Transacted
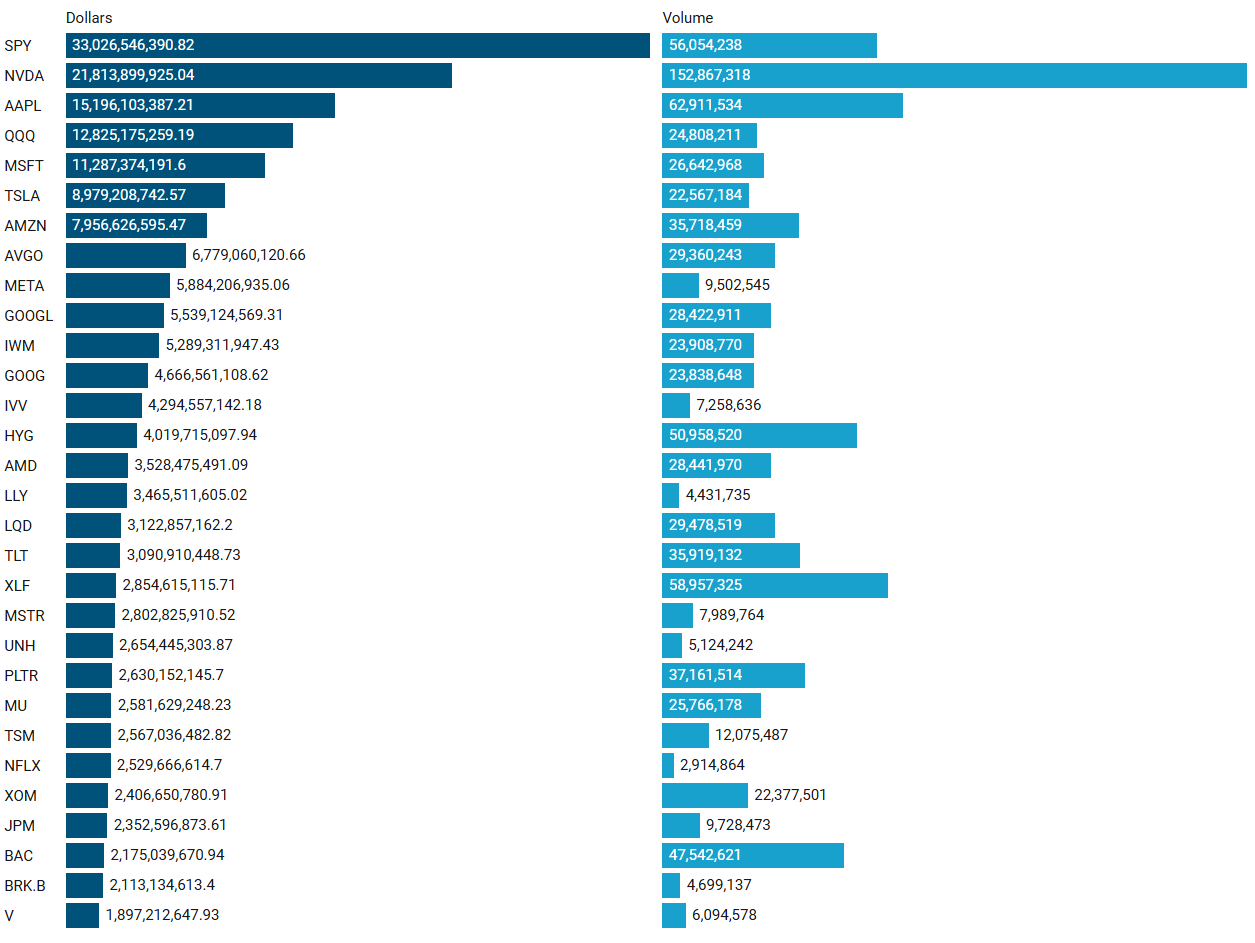
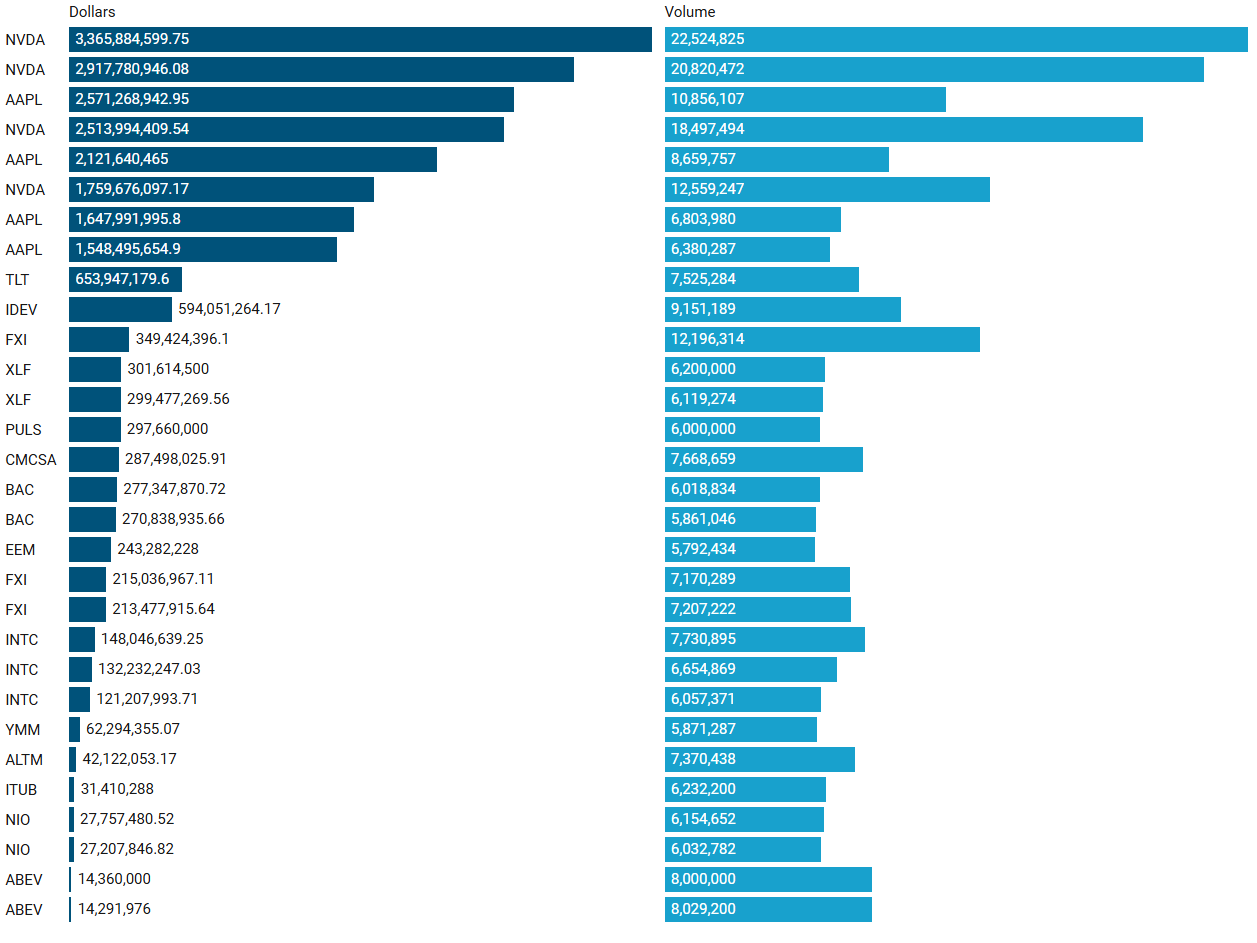
Largest Individual Trades by Dollars
Top Aggregate Dark Pool Activity by Ticker
Largest Individual Dark Pool Trades by Dollars
Top Aggregate Sweeps by Ticker
Top Individual Sweeps by Dollars Transacted
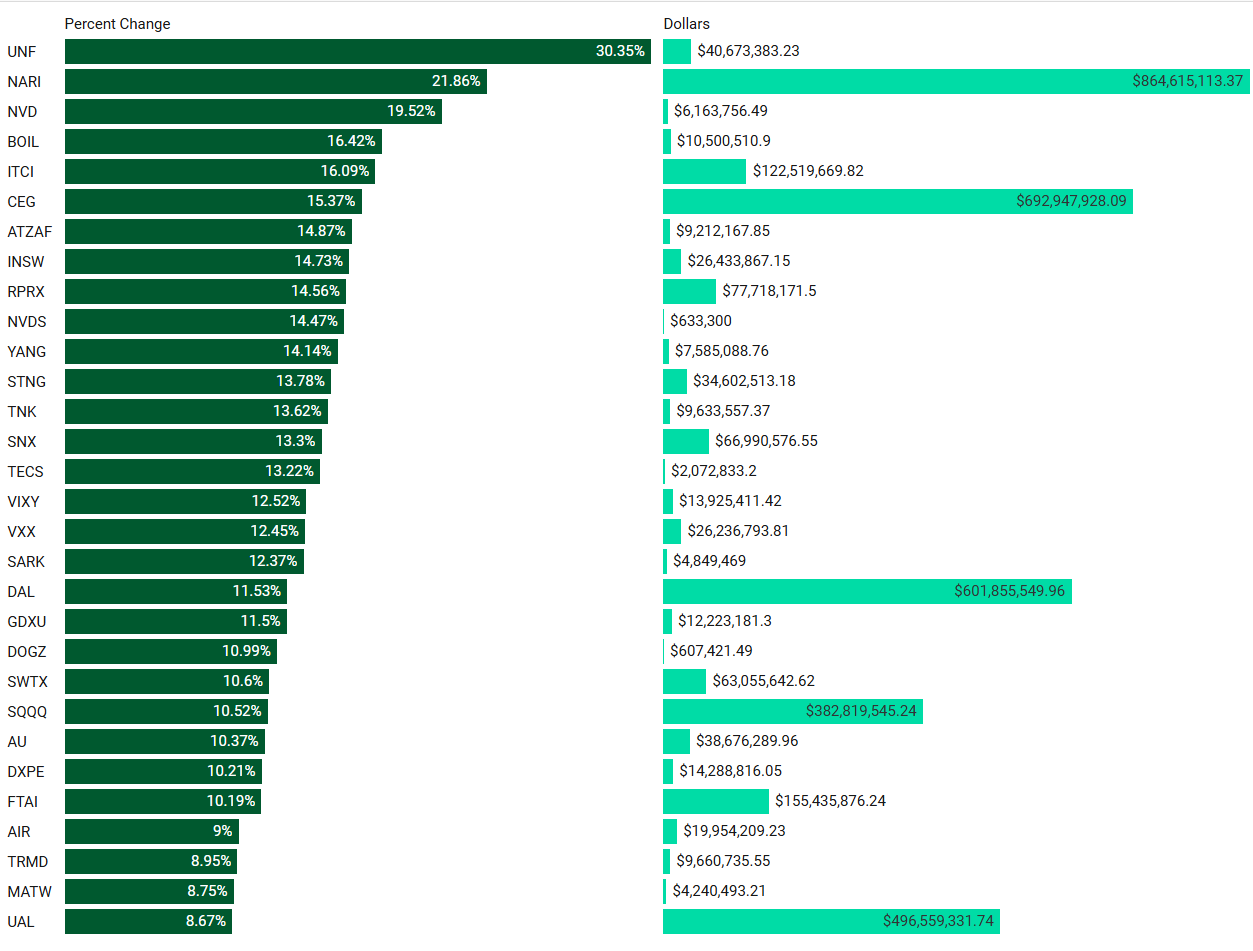
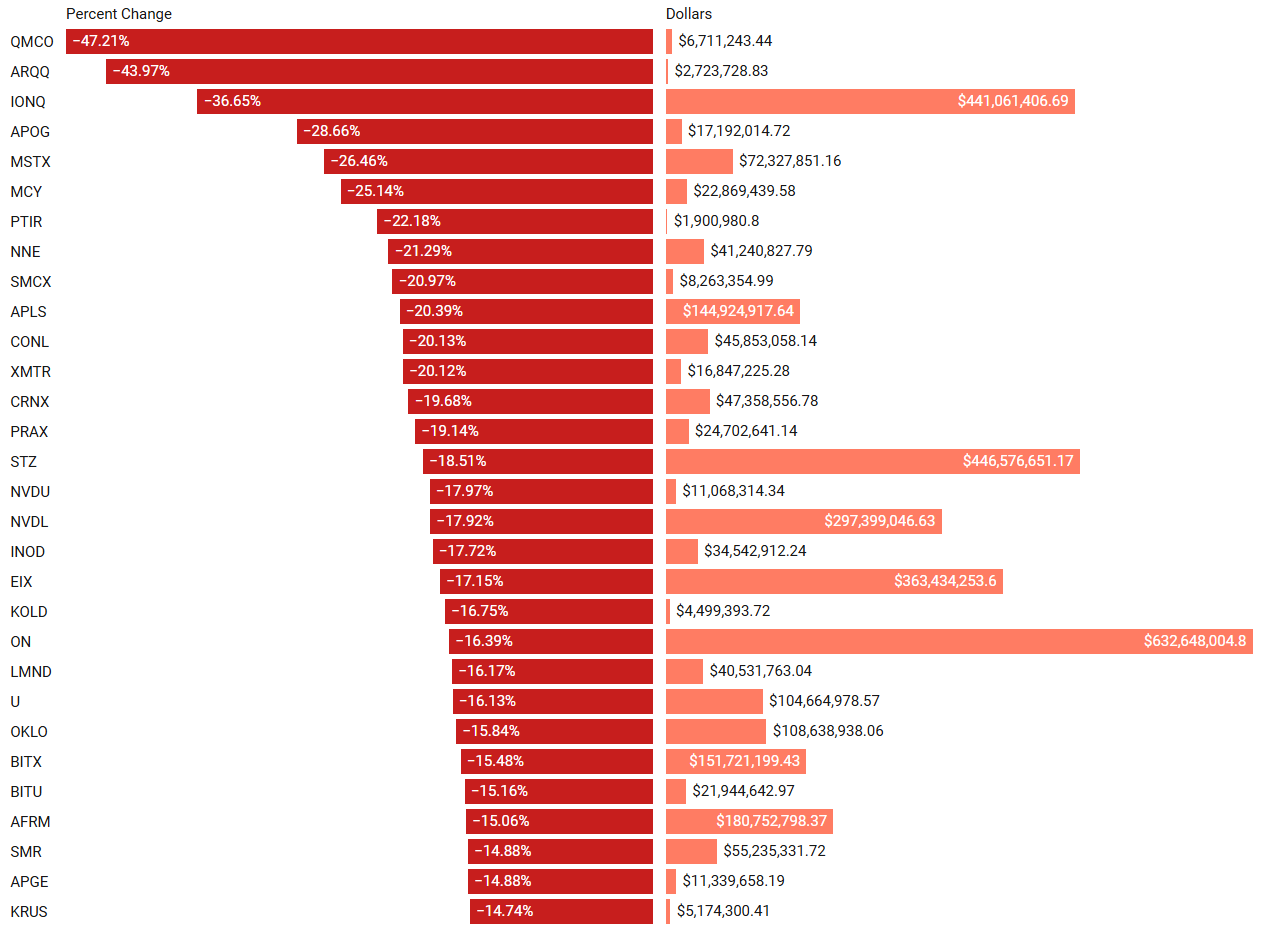
Last Week’s Institutionally-Backed Gainers & Losers
If you’re going to bet on a name, consider one that is officially endorsed by an institution! These are the top percent gainers (green) and percent losers (red) from this week’s open-to-close that had a trade price greater than $20 and institutional involvement. Continue watching tickers from this and prior stacks as these names frequently turn into multi-leg trades with a lot of movement!
Top Institutionally Backed Gainers
Top Institutionally Backed Losers
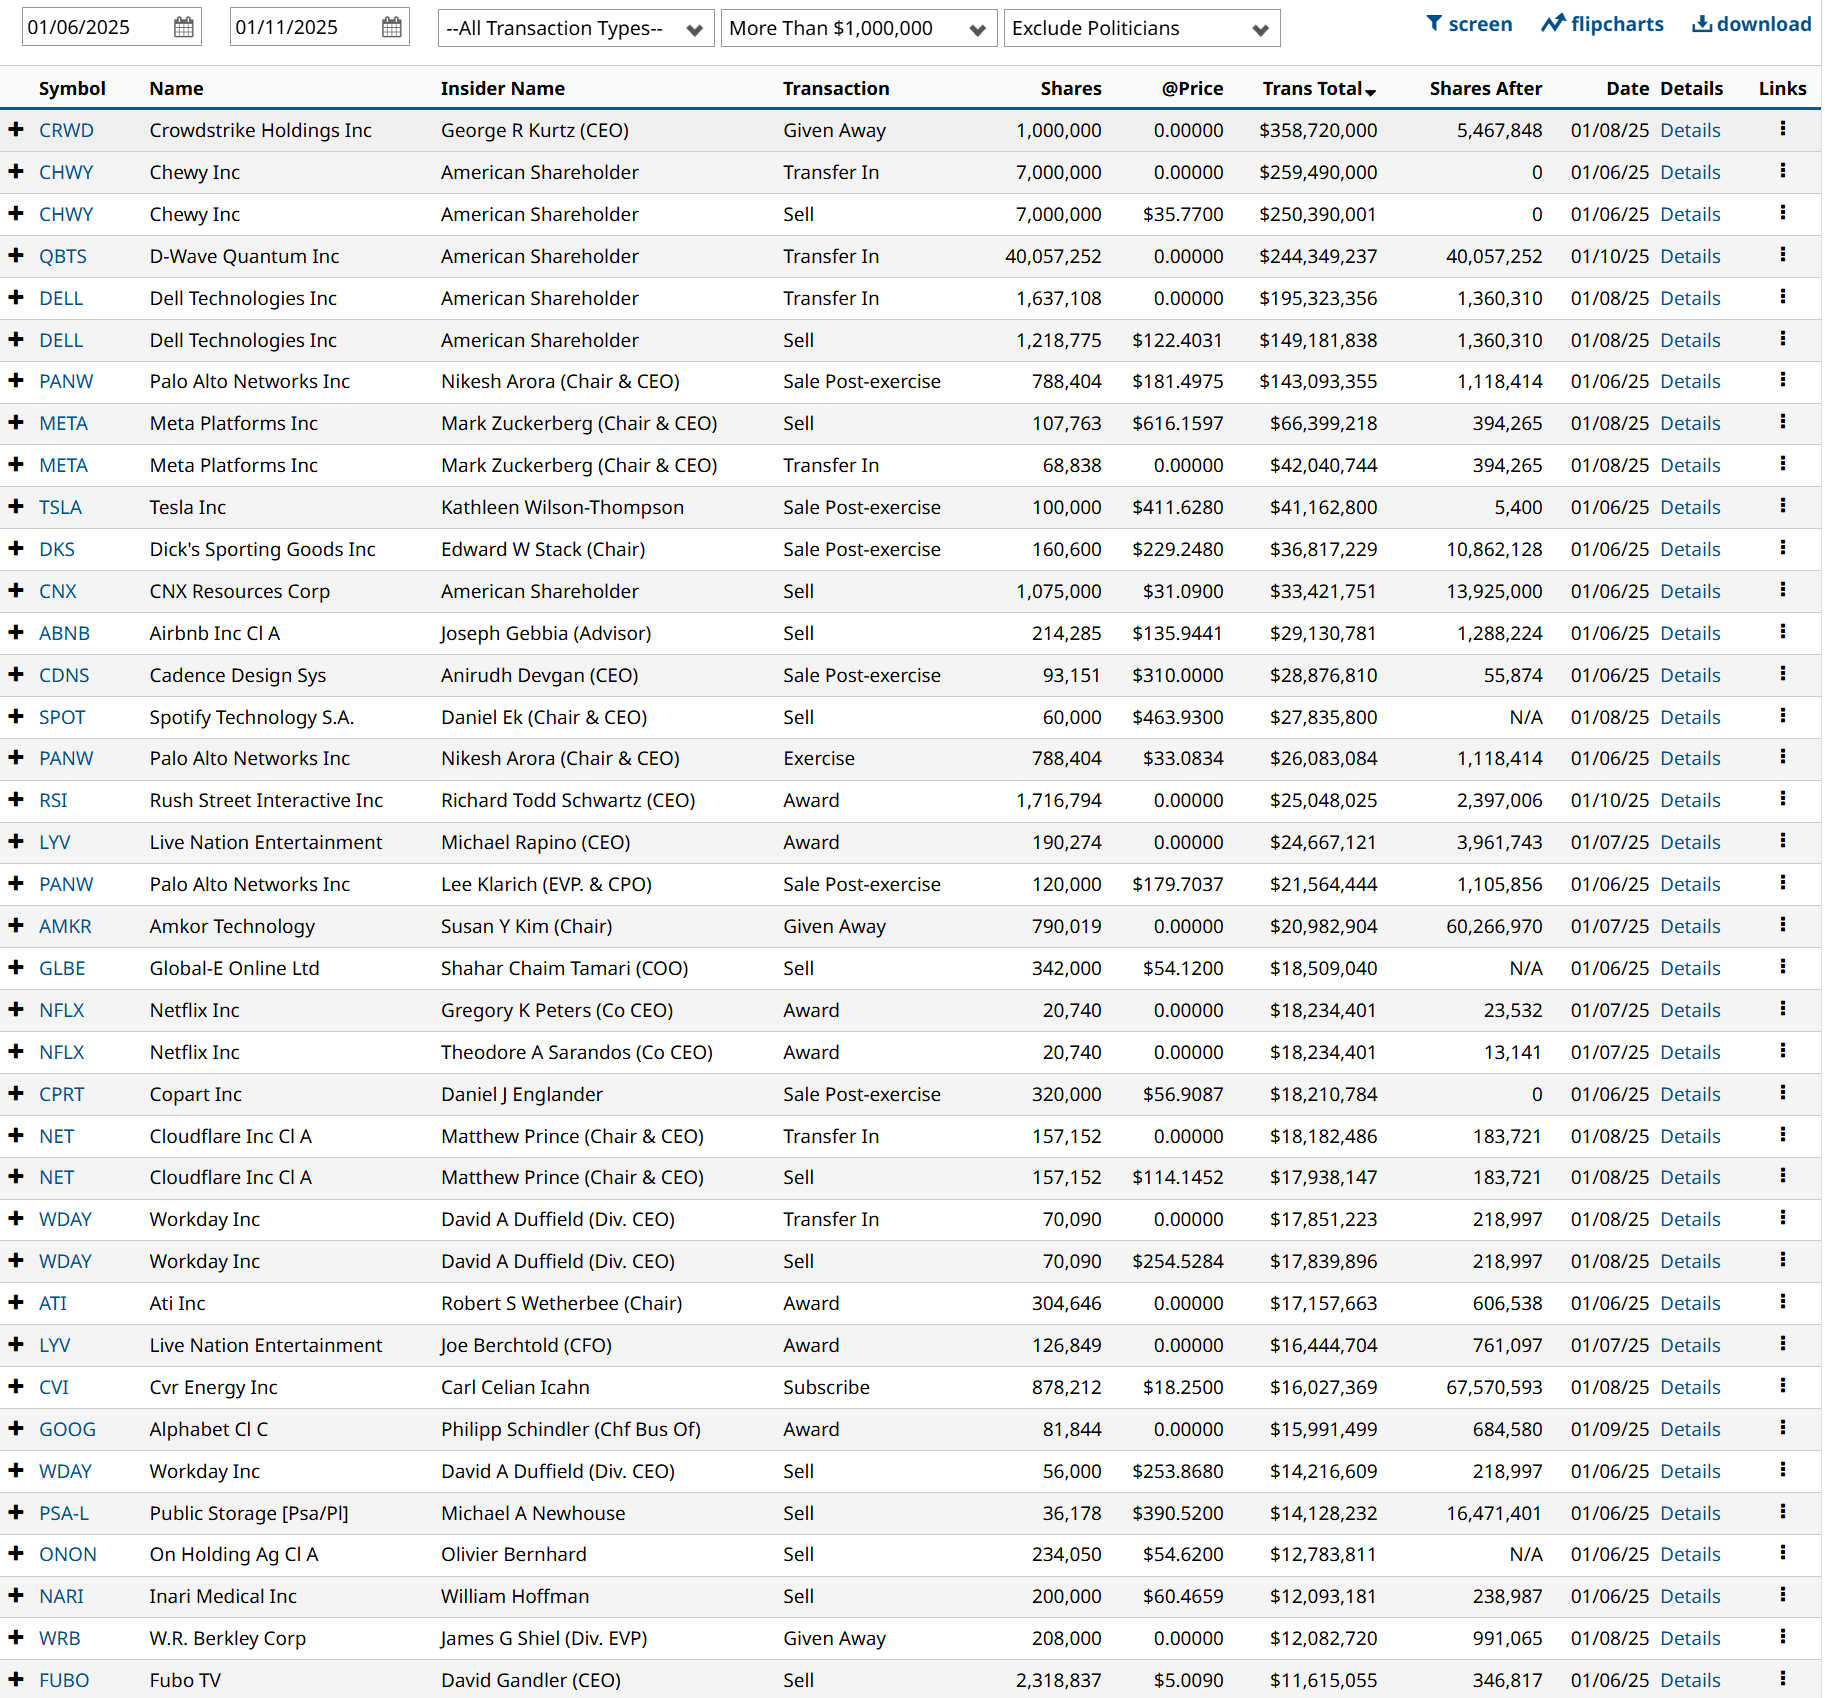
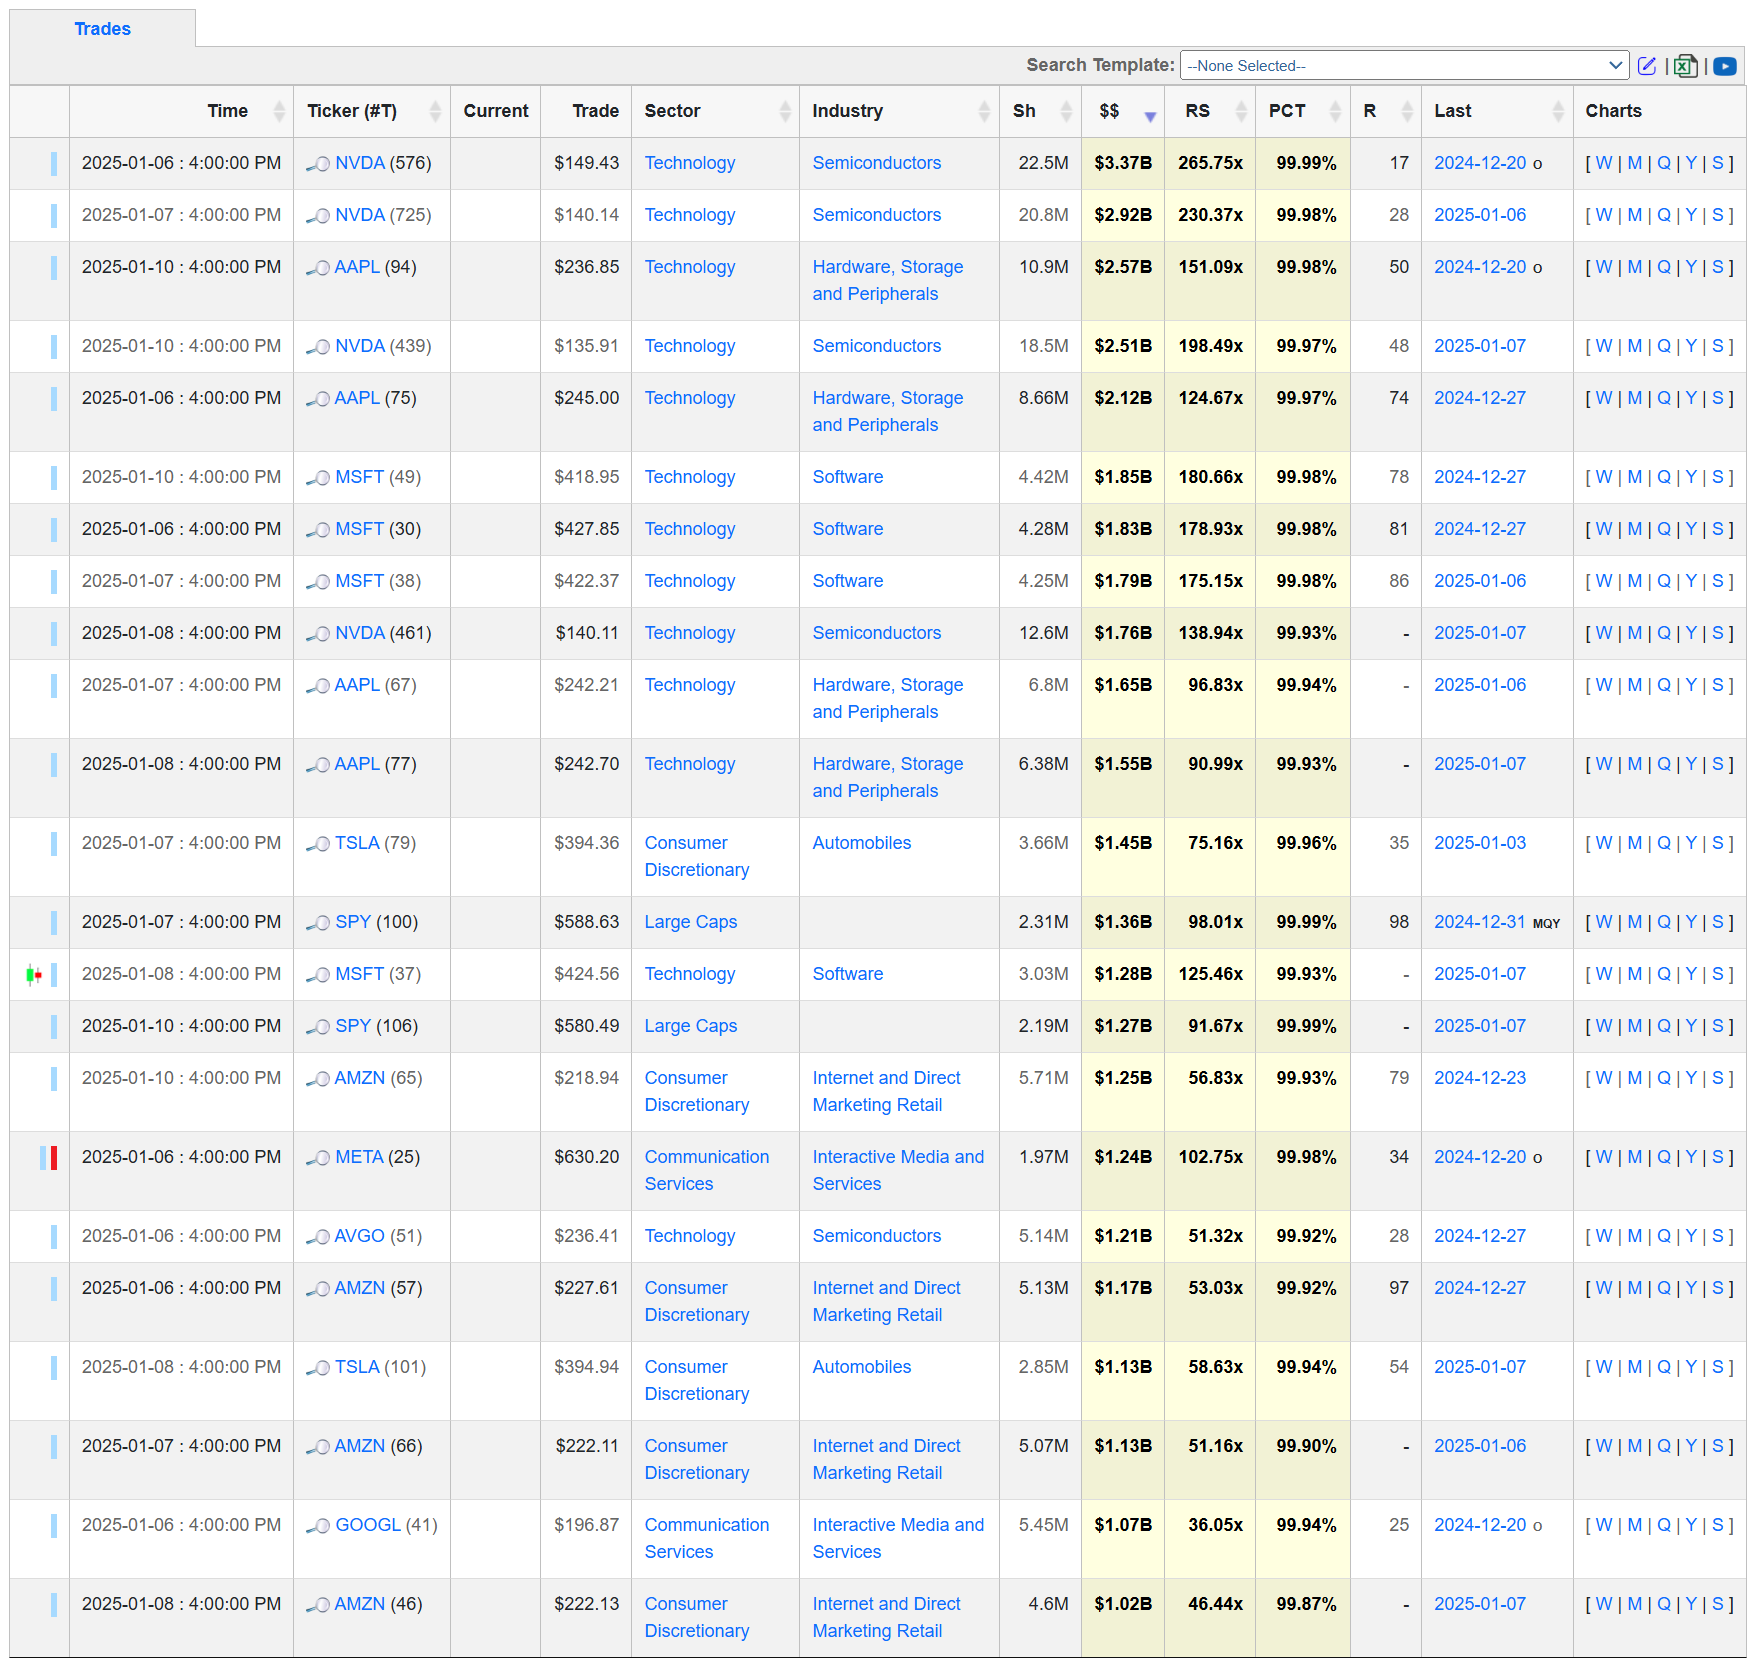
Last Week’s Billion-Dollar Prints
Tickers that printed a trade worth at least $1B last week get a special shout-out… Welcome to the club. Subs can use this convenience link to pull-up the same screen shown below. These are massive commitments by institutions that should not be ignored.
Investments In Focus: Bull vs Bear Arguments
Please read “Institutional S/R Levels For Major Indices” at the top of this stack to understand the nature and importance of what we’re looking at here visually. Institutions leave footprints that VolumeLeaders.com can illustrate for you while providing context to assess things like institutional conviction and urgency. Theses and data given below are not financial advice, just personal observations that may be wrong; consult a certified financial advisor before making any investment decisions.
FVRR 0.00%↑
Fiverr International Ltd. (NYSE: FVRR) operates a global online marketplace connecting freelancers with businesses seeking various services, including graphic design, digital marketing, writing, and more.
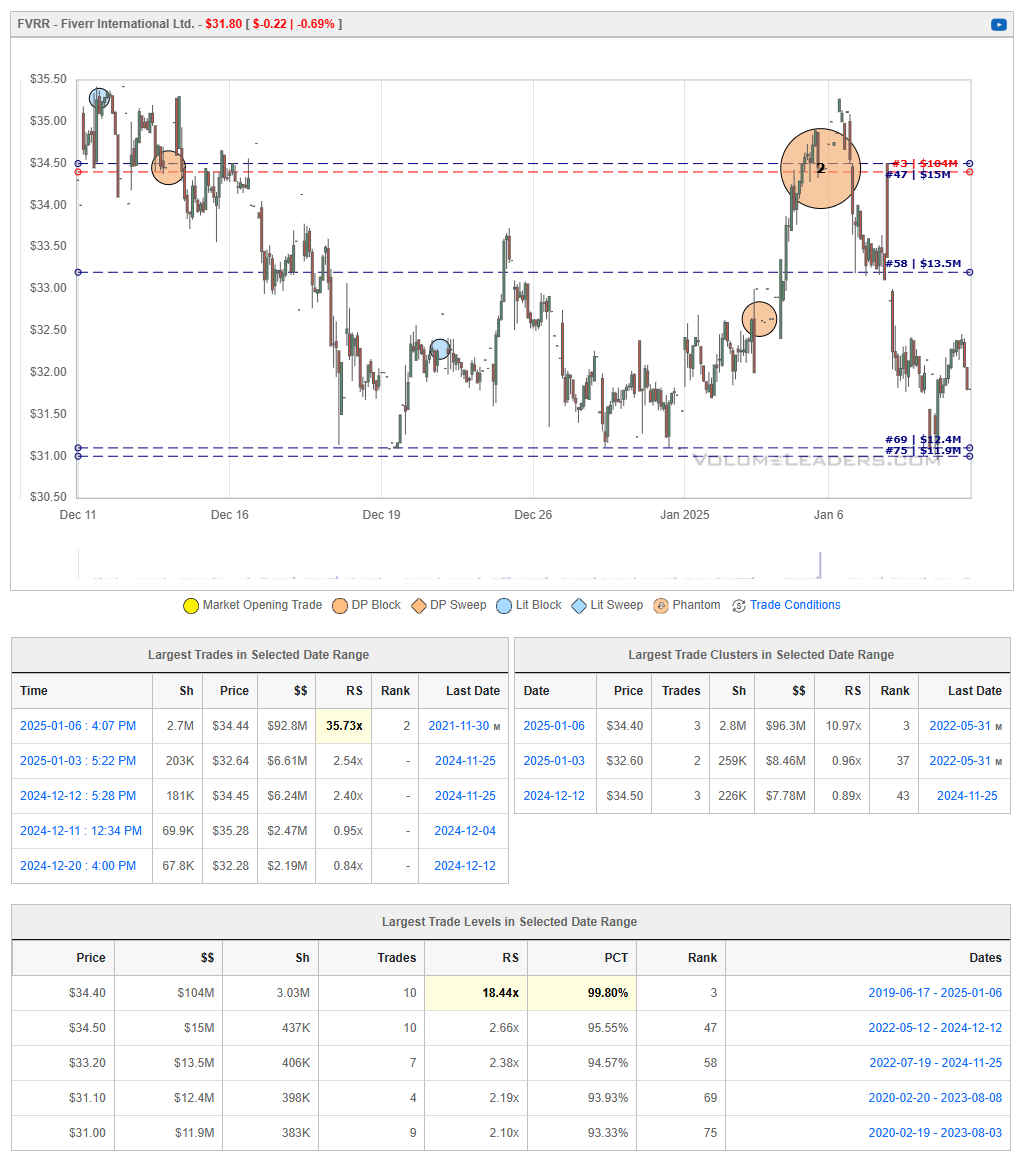
Bullish Perspective:
Positive Financial Momentum: In Q3 2024, Fiverr reported an 8% increase in sales, indicating resilience and growth in the gig economy sector.
AI Integration and Innovation: Fiverr's focus on AI-driven tools and services positions the company to capitalize on emerging technologies, enhancing its platform's competitiveness and user experience.
Market Expansion: The company's efforts to expand its service offerings and enter new markets may attract a broader customer base, driving revenue growth.
Analyst Optimism: Some analysts maintain a "Buy" rating on FVRR, reflecting confidence in the company's strategic direction and potential for future growth.
Strategic Acquisitions: Fiverr's acquisition of AutoDS, a dropshipping automation tool, demonstrates its commitment to enhancing e-commerce solutions and diversifying revenue streams.
Bearish Perspective:
AI Competition Concerns: The rise of AI technologies poses a threat to Fiverr's business model, as automated solutions may replace certain freelance services offered on the platform.
Analyst Downgrades: BTIG Research recently downgraded Fiverr to a "Neutral" rating, indicating potential concerns about the company's future performance.
Stock Volatility: Fiverr's stock has experienced significant fluctuations, which may deter risk-averse investors.
Market Saturation: The increasing number of freelance platforms intensifies competition, potentially impacting Fiverr's market share and pricing power.
Economic Sensitivity: Economic downturns could reduce demand for freelance services, adversely affecting Fiverr's revenue and profitability.
HDB 0.00%↑
HDFC Bank Limited (NYSE: HDB) is India's largest private sector bank by assets, offering a comprehensive range of financial products and services to individuals and businesses.
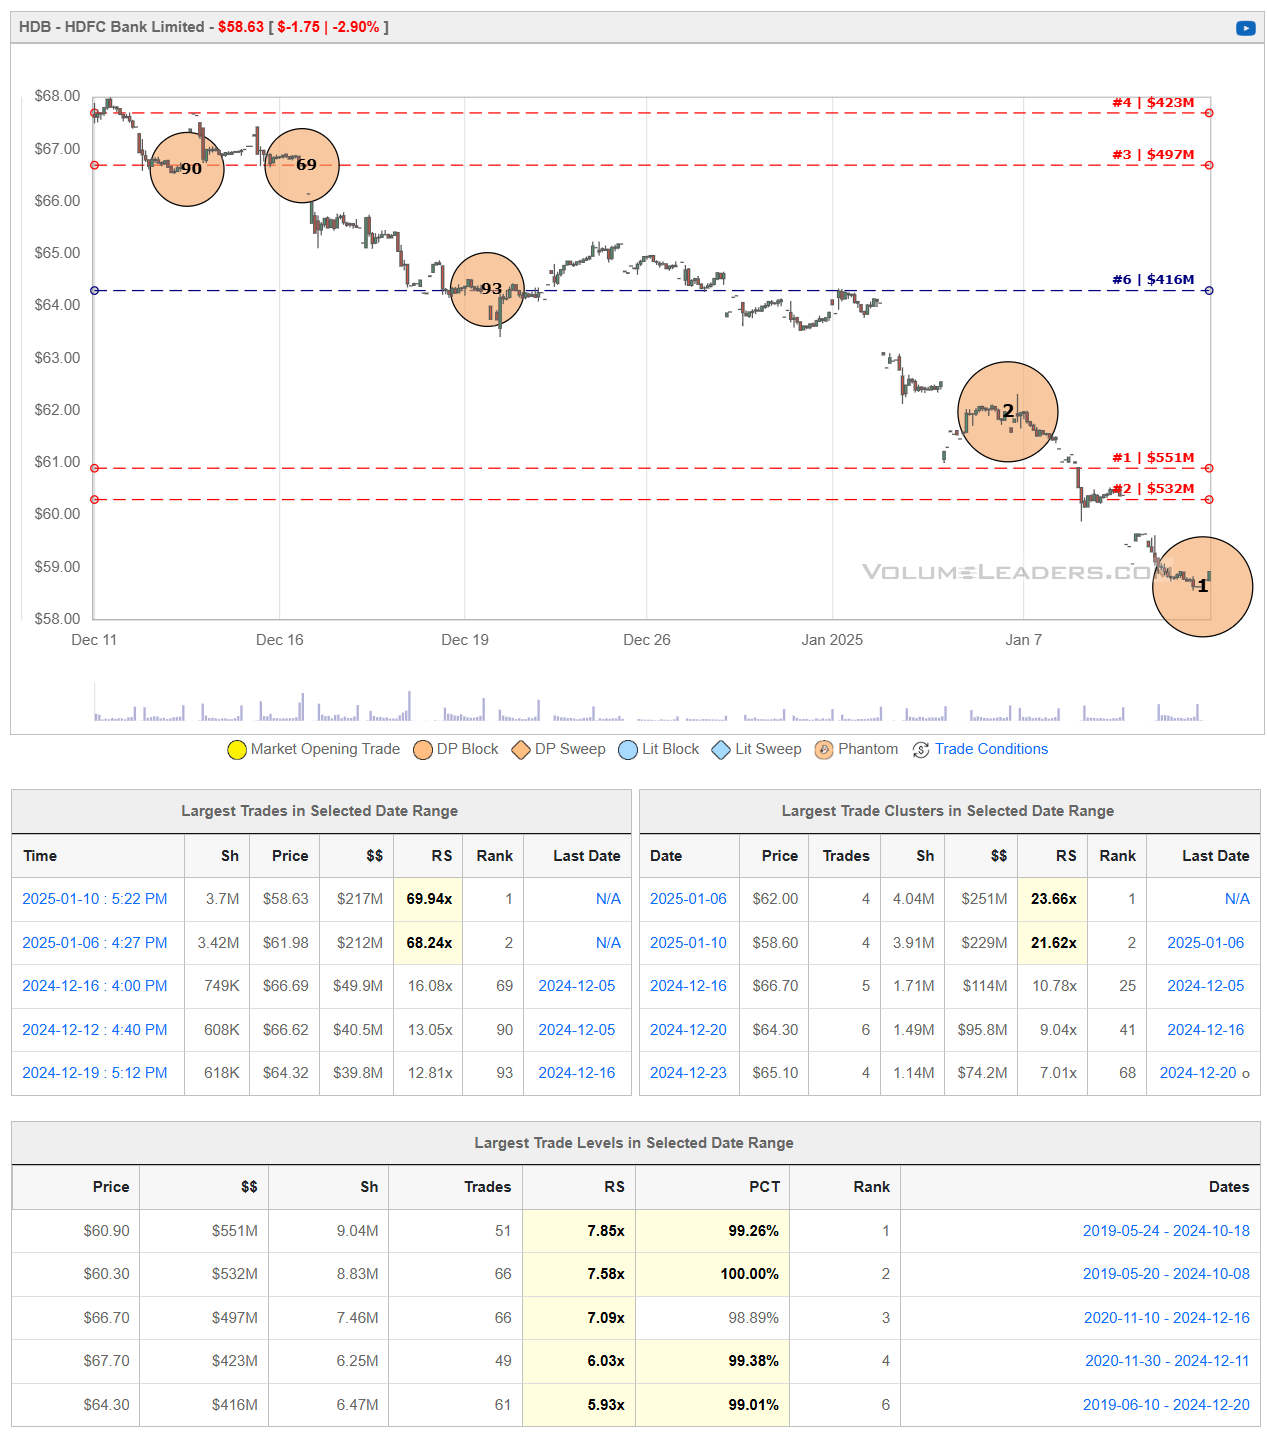
Bullish Perspective:
Strong Financial Performance: In Q3, HDFC Bank reported a 4% rise in standalone net profit, surpassing analysts' expectations, with net interest income rising nearly 1%.
Strategic Investments: The Reserve Bank of India has approved HDFC Bank's plan to acquire up to 9.5% of Kotak Mahindra Bank, indicating strategic expansion and confidence in the bank's growth prospects.
Market Leadership: As a leading private sector bank in India, HDFC Bank benefits from a strong brand reputation and a wide customer base, contributing to its competitive advantage.
Positive Analyst Outlook: Analysts have set an average share price target of ₹1,932 for HDFC Bank, suggesting potential upside from current levels.
Resilient Stock Performance: Despite market volatility, HDFC Bank's stock has shown resilience, with a 52-week range between ₹1,363.55 and ₹1,880.00, indicating investor confidence.
Bearish Perspective:
Regulatory Challenges: Operating in a highly regulated environment, HDFC Bank may face challenges related to compliance and changes in banking regulations, which could impact its operations.
Market Competition: The Indian banking sector is highly competitive, with both private and public sector banks vying for market share, potentially affecting HDFC Bank's growth and profitability.
Economic Sensitivity: As a financial institution, HDFC Bank's performance is closely tied to the Indian economy. Economic downturns or slowdowns could adversely impact the bank's asset quality and earnings.
Integration Risks Post-Merger: Following its merger with Housing Development Finance Corporation (HDFC) in July 2023, the bank's loan-to-deposit ratio spiked to 110% but has since dropped to approximately 100% by September. The bank aims to reduce this ratio back to pre-merger levels within the next two to three years, indicating potential integration challenges.
Stock Volatility: HDFC Bank's stock has experienced fluctuations, with recent declines observed over several trading sessions, which may concern risk-averse investors.
VV 0.00%↑
The Vanguard Large-Cap ETF (VV) seeks to track the performance of the CRSP US Large Cap Index, providing investors with exposure to the largest U.S. companies.
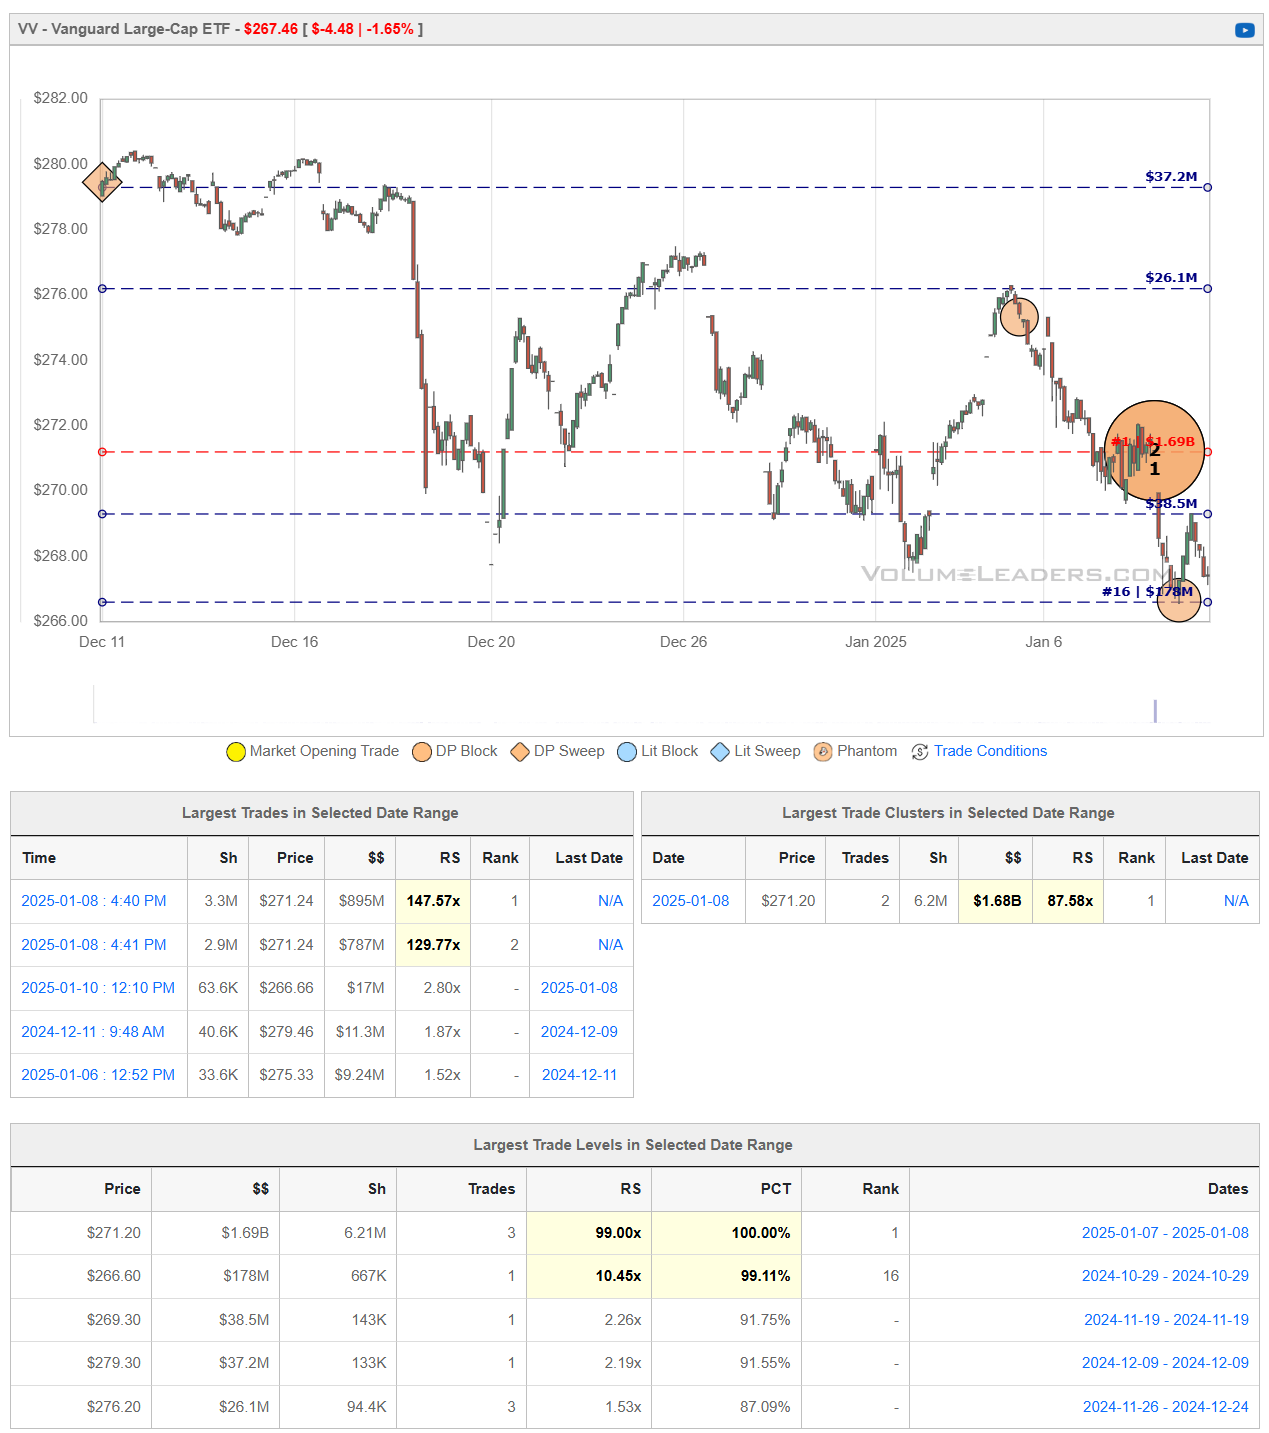
Bullish Perspective:
Broad Market Exposure: VV offers investors access to a diversified portfolio of large-cap U.S. companies, representing approximately the top 85% of the U.S. market capitalization.
Low Expense Ratio: With an expense ratio of 0.04%, VV is a cost-effective option for investors seeking large-cap exposure, allowing for greater net returns over time.
Strong Historical Performance: As of January 9, 2025, VV has demonstrated solid returns, with a 1-year return of 26.59%, outperforming its category average of 21.45%.
High Liquidity: VV boasts significant assets under management (AUM), providing investors with high liquidity and tight bid-ask spreads, facilitating efficient trading.
Market Leadership: Vanguard's prominence in the ETF market, recently surpassing BlackRock as the provider of the world's second-largest ETF, underscores its strong market position and investor confidence.
Bearish Perspective:
Market Concentration Risk: VV's focus on large-cap companies may lead to overexposure to certain sectors or industries, potentially increasing vulnerability to sector-specific downturns.
Limited Exposure to Small-Cap Growth: Investors seeking exposure to high-growth potential in small-cap companies may find VV's large-cap focus limiting, as it does not include smaller, potentially higher-growth firms.
Potential Underperformance in Value Cycles: In market cycles where value stocks outperform growth stocks, VV's blend of both may result in underperformance compared to pure value-focused funds.
Economic Sensitivity: As VV tracks large-cap companies, its performance is closely tied to the overall health of the U.S. economy. Economic downturns or recessions could negatively impact the fund's returns.
Technical Indicators Suggest Caution: Recent technical analysis indicates a 'Strong Sell' signal for VV, suggesting potential short-term bearish trends.
RGTI -0.74%↓
Rigetti Computing, Inc. (NASDAQ: RGTI) is a pioneer in full-stack quantum computing, aiming to deliver integrated quantum-classical computing systems.
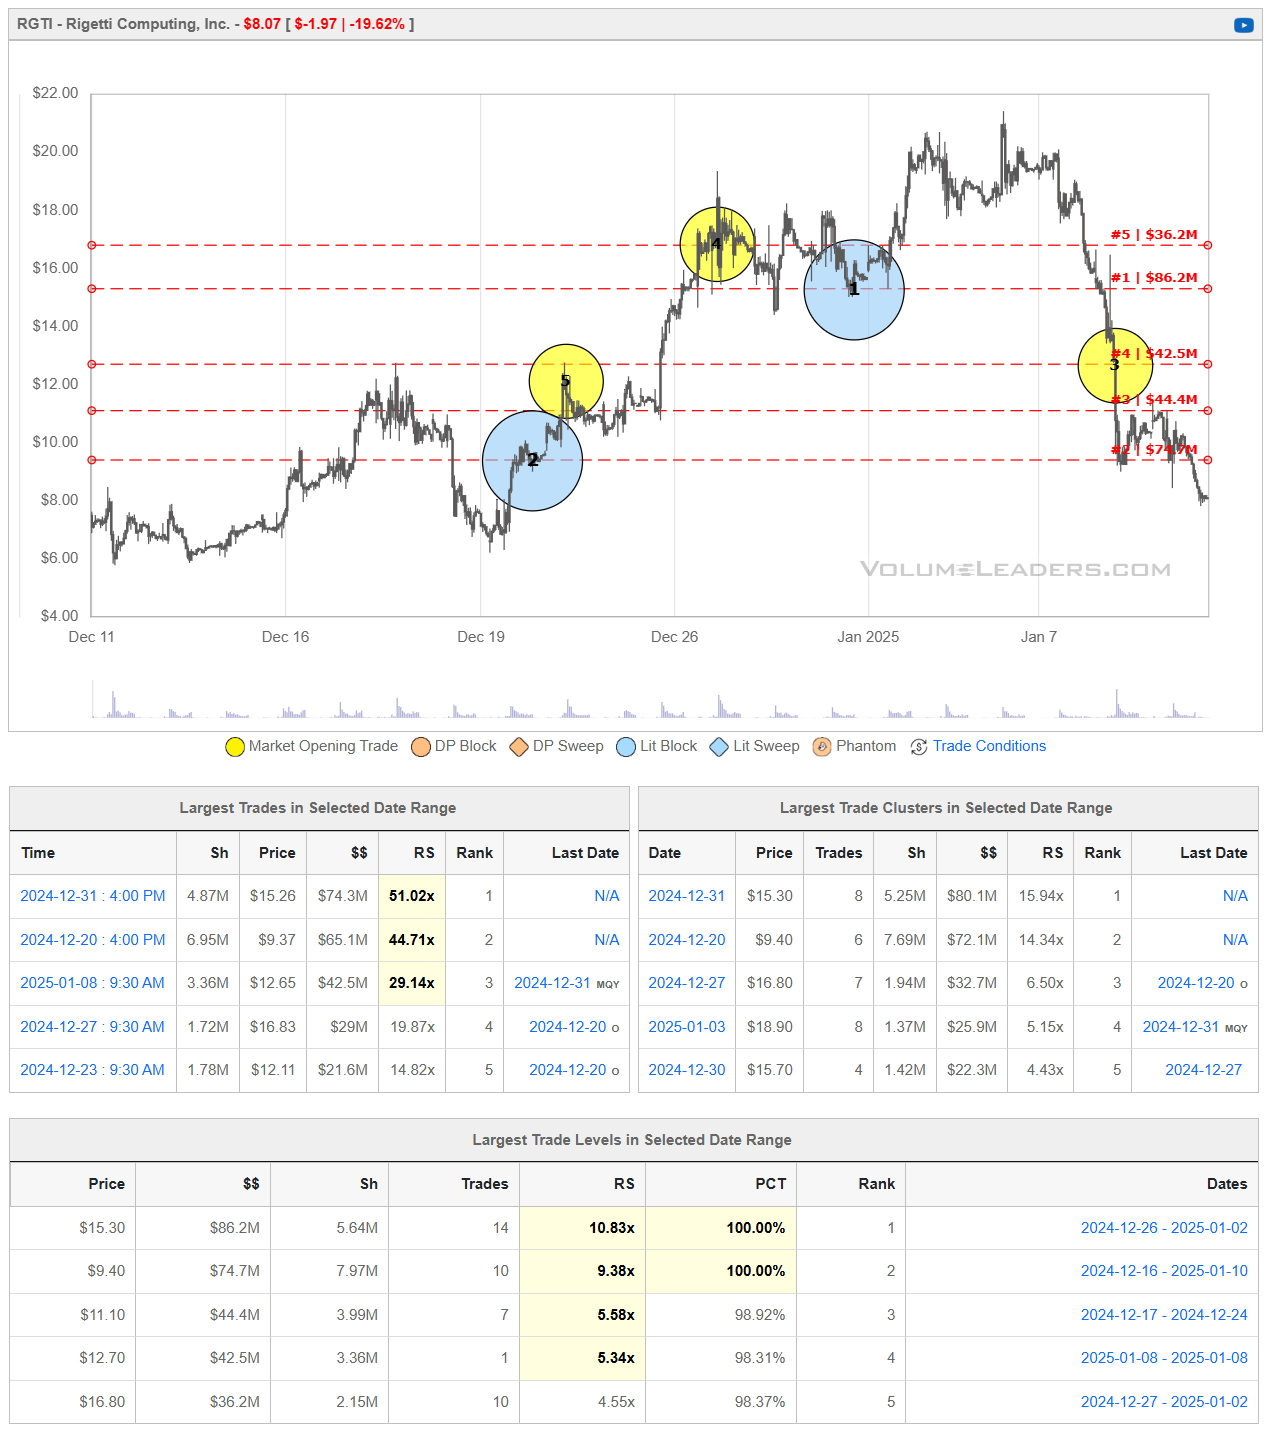
Bullish Perspective:
Technological Advancements: Rigetti recently launched its 84-qubit Ankaa™-3 system, achieving a 99.5% median two-qubit gate fidelity, indicating significant progress in quantum computing capabilities.
Strategic Partnerships: The company collaborates with industry leaders and research institutions, enhancing its technological development and market reach.
Growing Market Potential: The quantum computing market is projected to expand substantially, offering Rigetti opportunities for growth as it develops scalable quantum solutions.
Analyst Ratings: Rigetti has received a consensus "Strong Buy" rating from analysts, reflecting confidence in its future prospects.
Recent Stock Performance: Prior to recent declines, Rigetti's stock experienced significant appreciation, indicating strong investor interest in quantum computing technologies.
Bearish Perspective:
Industry Skepticism: Nvidia CEO Jensen Huang recently stated that practical quantum computers are 15 to 30 years away, casting doubt on the near-term viability of companies like Rigetti.
Stock Volatility: Following Huang's comments, Rigetti's stock plummeted approximately 45%, highlighting its susceptibility to market sentiment and industry perceptions.
Financial Challenges: The company reported a net loss of $60.6 million over the trailing twelve months, raising concerns about its path to profitability.
High Valuation Concerns: Analysts have labeled Rigetti as "egregiously overvalued," suggesting that its market capitalization may not be justified by current financial performance.
Competitive Landscape: The quantum computing sector is highly competitive, with numerous well-funded entities striving for technological breakthroughs, potentially impacting Rigetti's market position.
RDY 0.00%↑
Dr. Reddy's Laboratories Ltd. (NYSE: RDY) is a global pharmaceutical company headquartered in Hyderabad, India, specializing in generic medications, active pharmaceutical ingredients (APIs), and proprietary products.
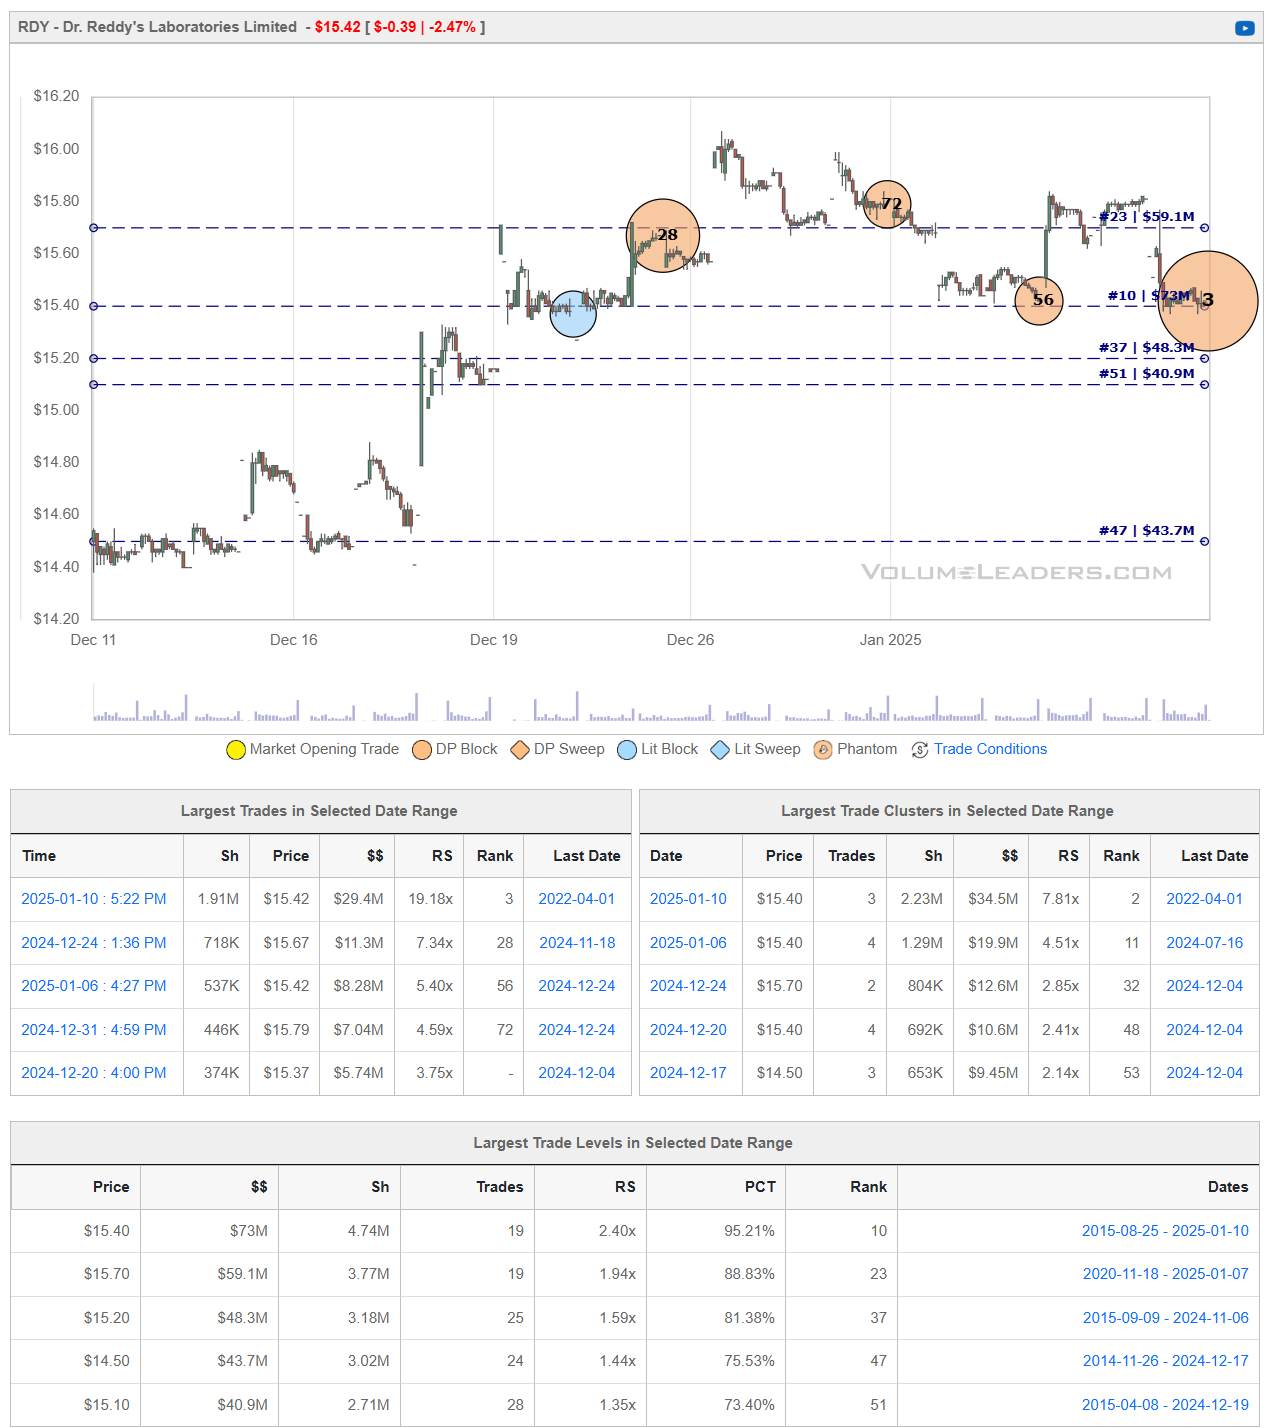
Bullish Perspective:
Strong Financial Performance: In Q2 FY25, Dr. Reddy's reported a 16.5% increase in revenue, reaching a record ₹8,016.1 crore, indicating robust growth and operational efficiency.
Strategic Divestments: The company recently sold a non-strategic subsidiary in Louisiana, streamlining operations and focusing on core business areas, which may enhance profitability.
Positive Analyst Outlook: Nomura upgraded Dr. Reddy's to a 'Buy' rating with a target price of ₹1,500, reflecting confidence in the company's growth prospects.
Product Portfolio Expansion: Dr. Reddy's launched Toripalimab in India, the first immuno-oncology drug approved for treating nasopharyngeal carcinoma, demonstrating its commitment to innovation and addressing unmet medical needs.
Institutional Investment Growth: GAMMA Investing LLC increased its stake in Dr. Reddy's by 369.9% in Q4, indicating growing institutional confidence in the company's future performance.
Bearish Perspective:
Regulatory Challenges: The company faces a GST tax demand and is evaluating an appeal, which could lead to financial liabilities and impact profitability.
Market Volatility: Dr. Reddy's stock has experienced fluctuations, with recent declines observed over several trading sessions, which may concern risk-averse investors.
Competitive Industry Landscape: The pharmaceutical sector is highly competitive, with pressure on pricing and market share, potentially affecting Dr. Reddy's revenue growth.
Currency Exchange Risks: As a company with significant international operations, Dr. Reddy's is exposed to currency exchange fluctuations, which can impact financial performance.
Regulatory Compliance Risks: Operating across multiple countries subjects Dr. Reddy's to various regulatory environments, and any compliance issues could lead to legal challenges and financial penalties.
SAP 0.00%↑
SAP SE (NYSE: SAP) is a leading global provider of enterprise application software, offering solutions that enable businesses to manage operations and customer relations effectively.
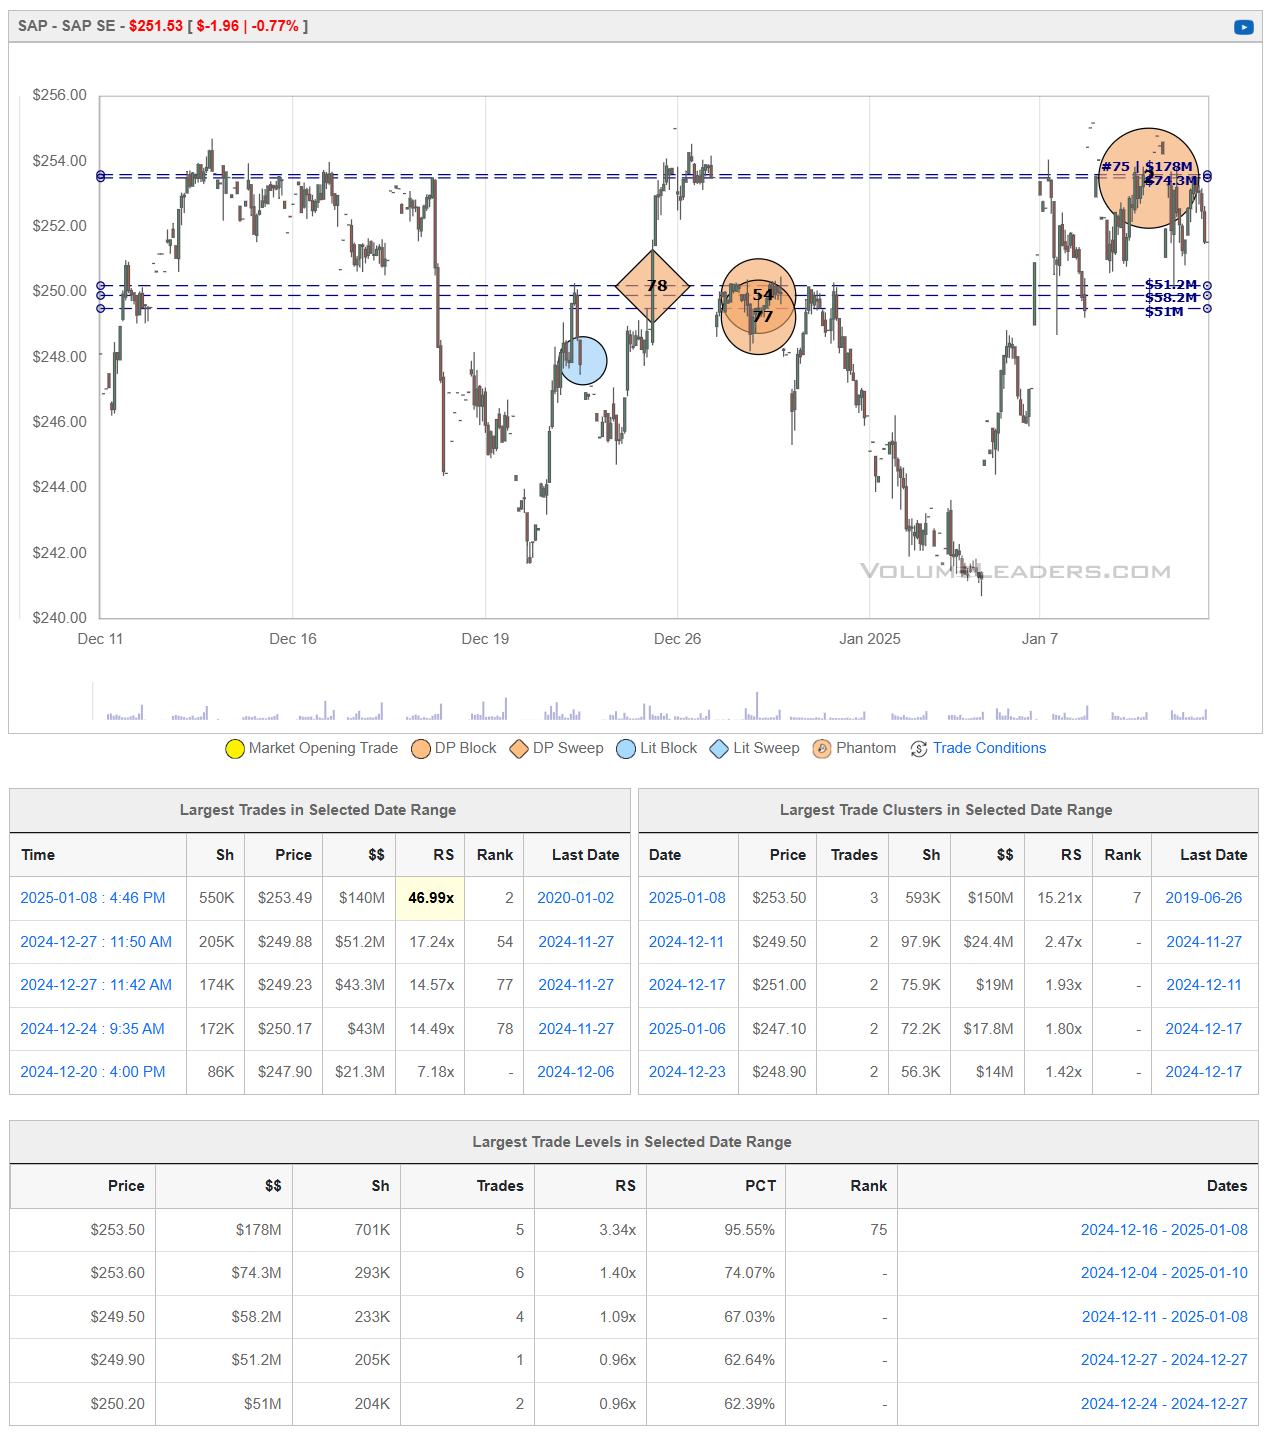
Bullish Perspective:
Strong Financial Performance: In Q3 2024, SAP reported a 9% increase in revenue to €8.47 billion, surpassing analyst expectations. This growth was driven by a 25% surge in cloud computing sales, reflecting the company's successful transition to cloud-based solutions.
Leadership in European Tech Market: SAP has become Europe's most valuable technology company, overtaking ASML, with a market valuation of €269 billion. This achievement underscores SAP's robust market position and investor confidence.
Advancements in AI Integration: The company has made significant progress in integrating artificial intelligence into its offerings, enhancing its cloud computing success and providing advanced solutions to clients.
Positive Analyst Outlook: Analysts have raised their price targets for SAP, highlighting the company's resilience and growth potential in a challenging macroeconomic environment. For instance, BMO Capital increased its target from $237 to $248, maintaining a 'Buy' rating.
Operational Efficiency and Cost Management: SAP's restructuring efforts, including planned job cuts, aim to reduce operating costs by approximately €700 million, potentially improving profitability in the coming years.
Bearish Perspective:
High Valuation Metrics: SAP's current price-to-earnings (P/E) ratio stands at 95.90, which may indicate that the stock is overvalued compared to its earnings, posing a risk for investors.
Competitive Market Landscape: The enterprise software market is highly competitive, with major players like Oracle and Microsoft posing challenges to SAP's market share and pricing power.
Economic Sensitivity: As a global company, SAP's performance is closely tied to the health of the global economy. Economic downturns or slowdowns could adversely impact the company's revenue and profitability.
Execution Risks in Cloud Transition: While SAP's shift to cloud-based solutions has driven growth, the transition involves execution risks, including potential disruptions in service delivery and customer satisfaction.
Currency Exchange Risks: Operating across multiple countries exposes SAP to currency exchange fluctuations, which can impact financial performance, especially with the recent volatility in foreign exchange markets.
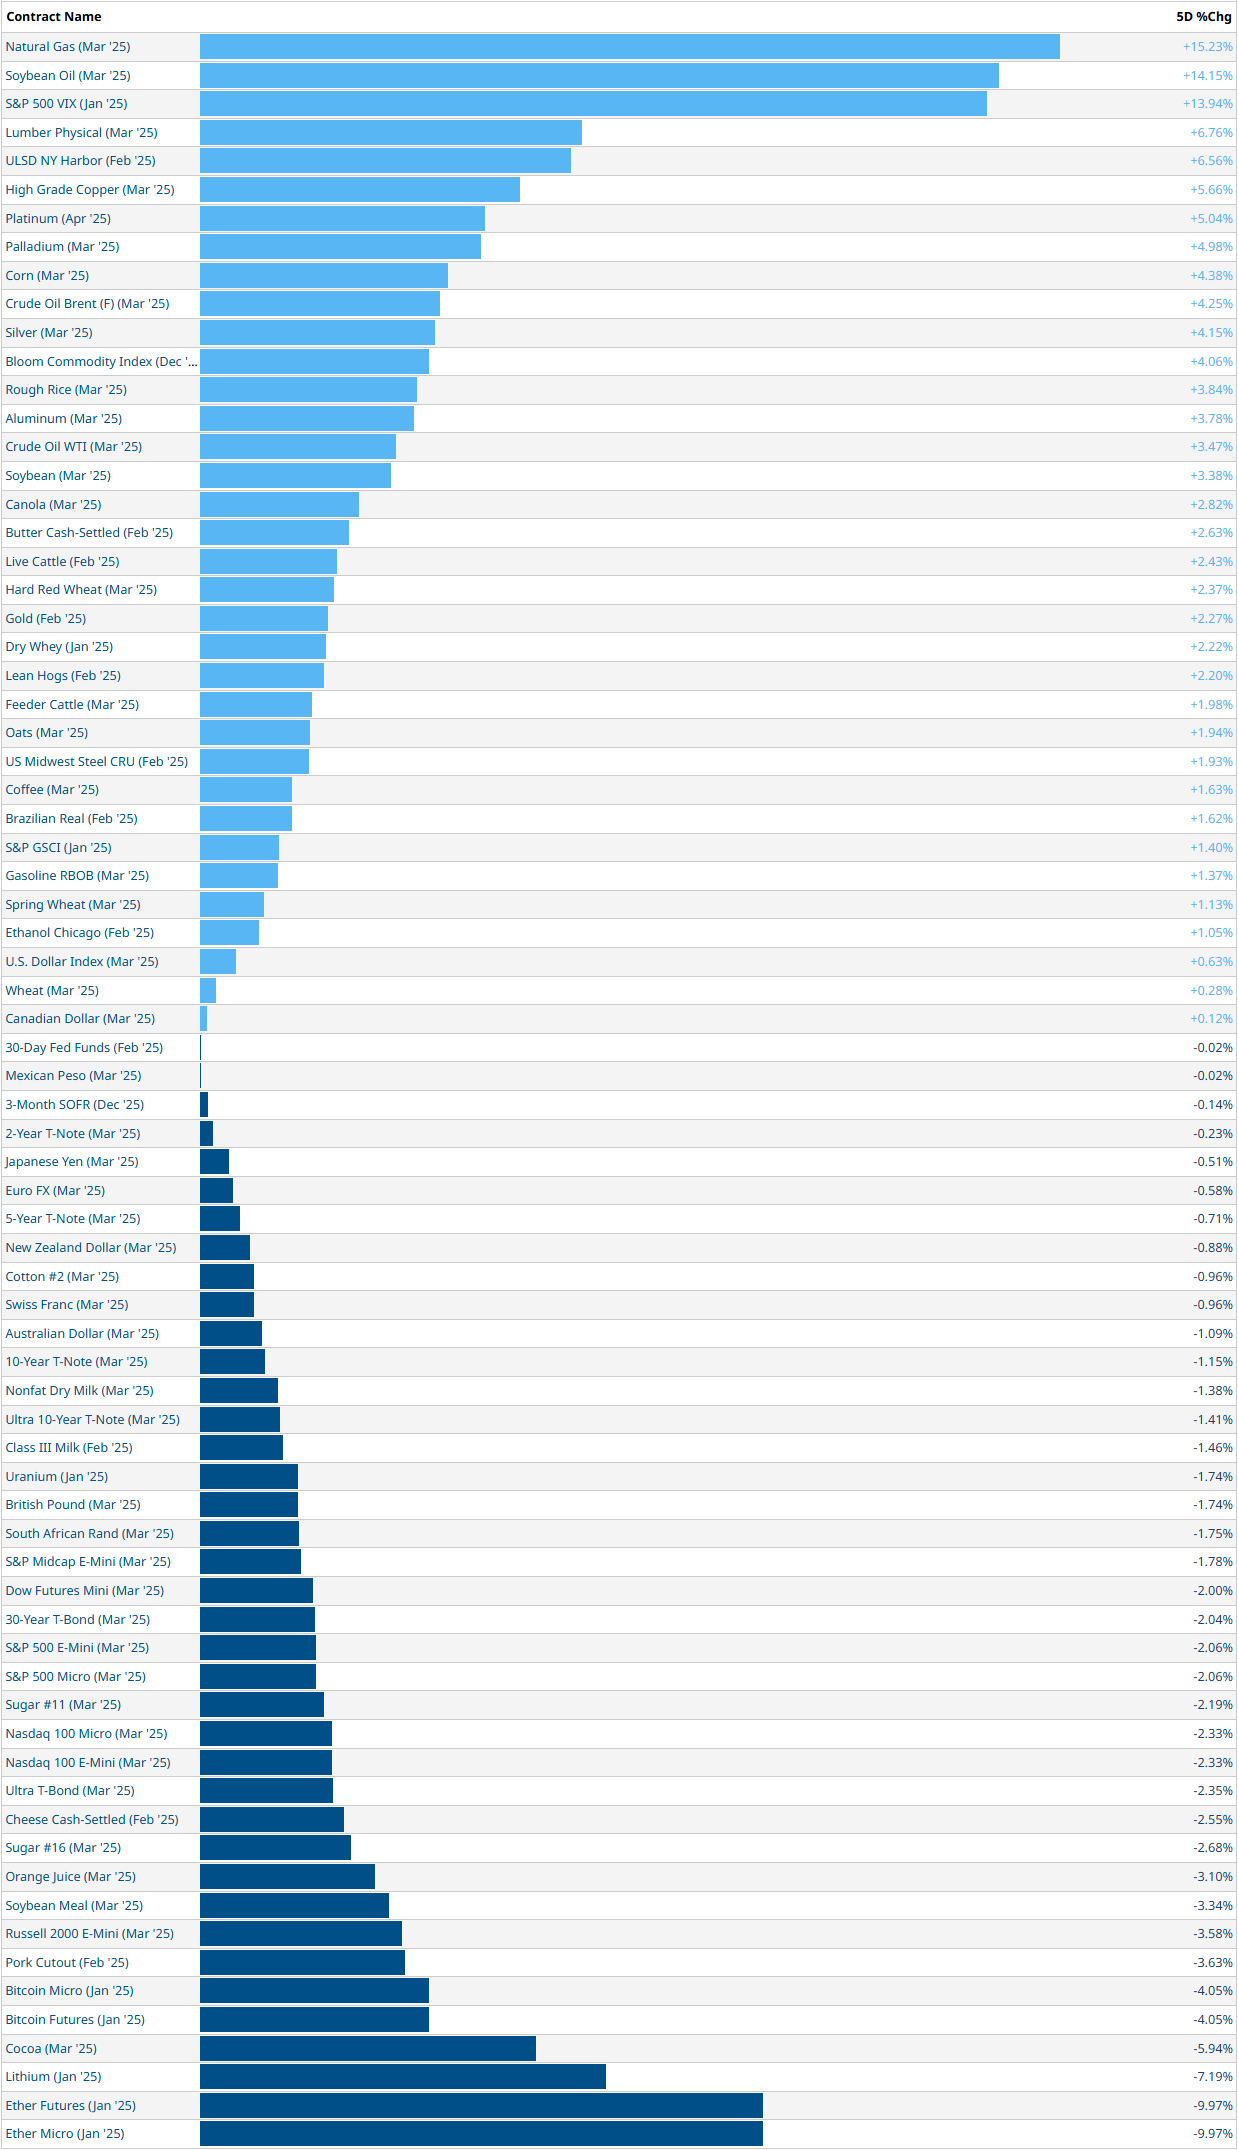
Summary Of Thematic Performance YTD
VolumeLeaders.com provides a lot of pre-built filters for thematics so that you can quickly dive into specific areas of the market. These performance overviews are provided here only for inspiration. Consider targeting leaders and/or laggards in the best and worst sectors, for example.
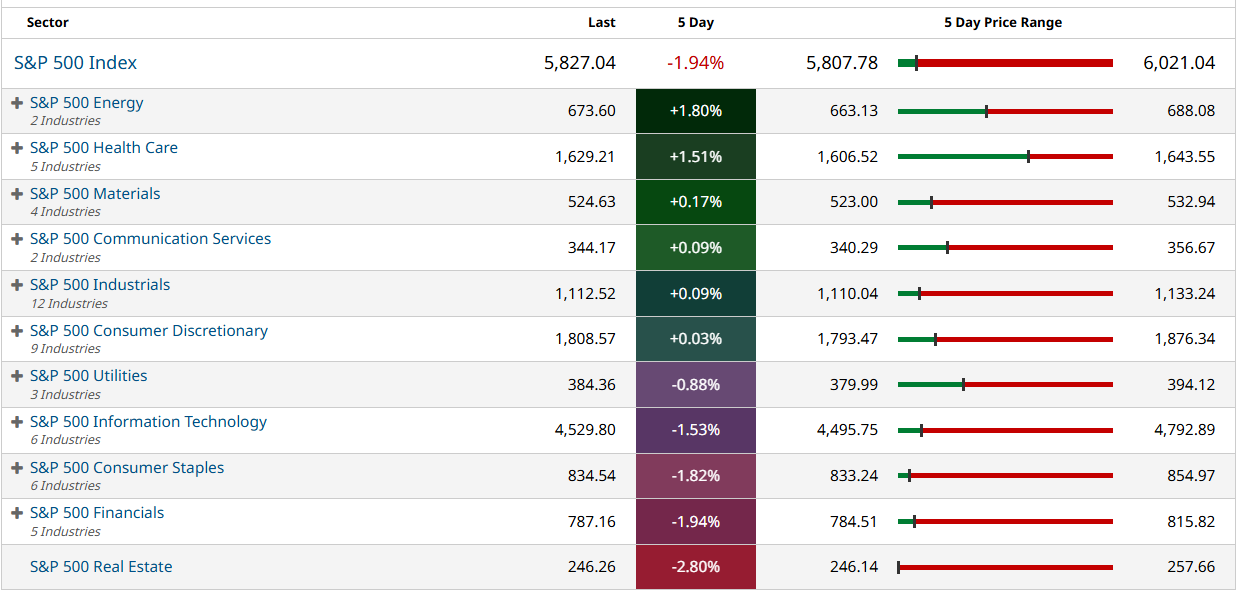
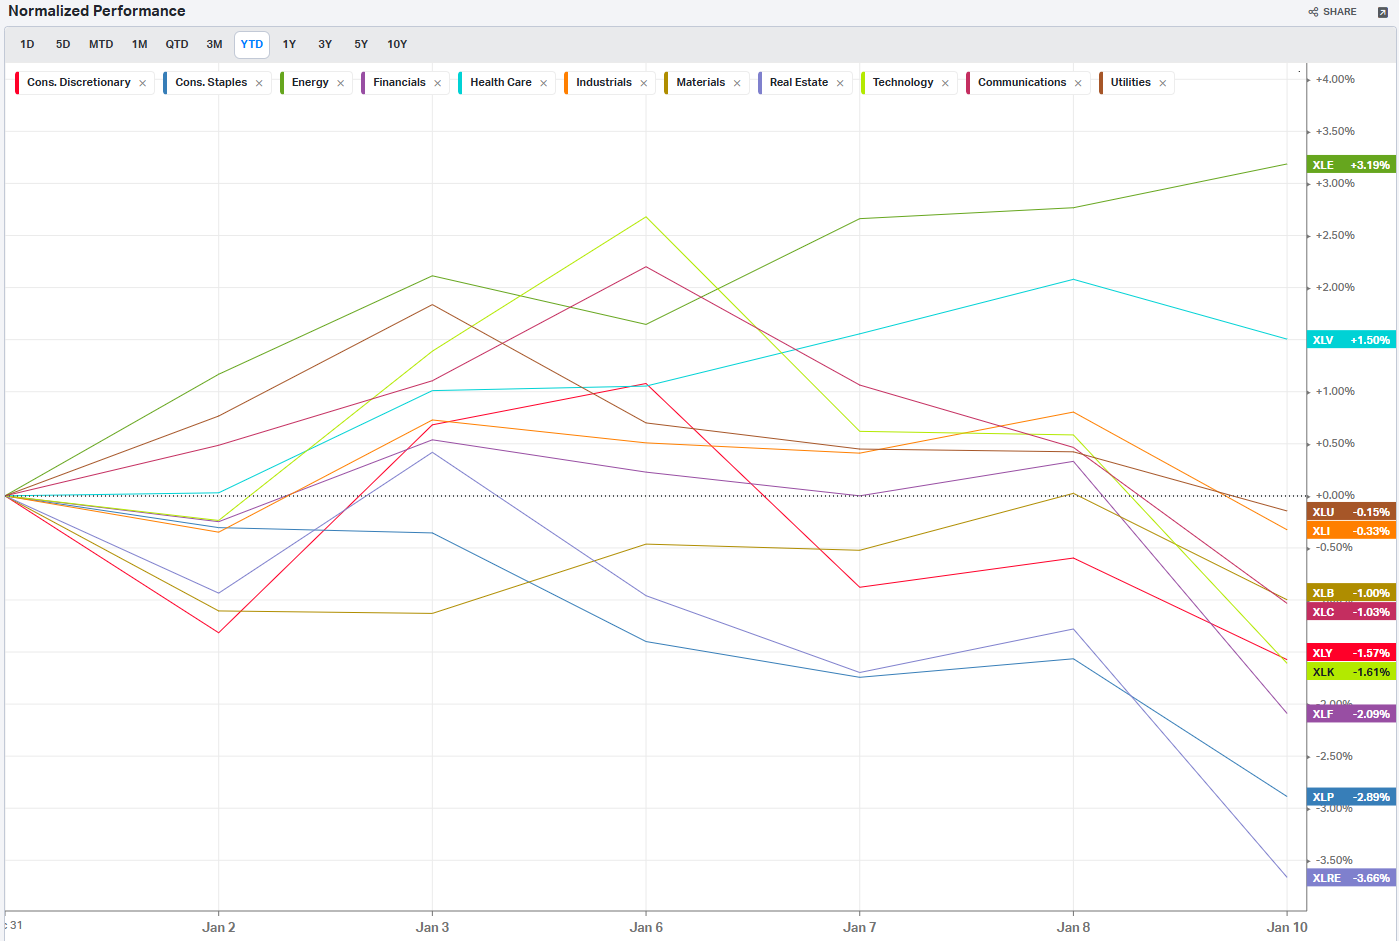
S&P By Sector
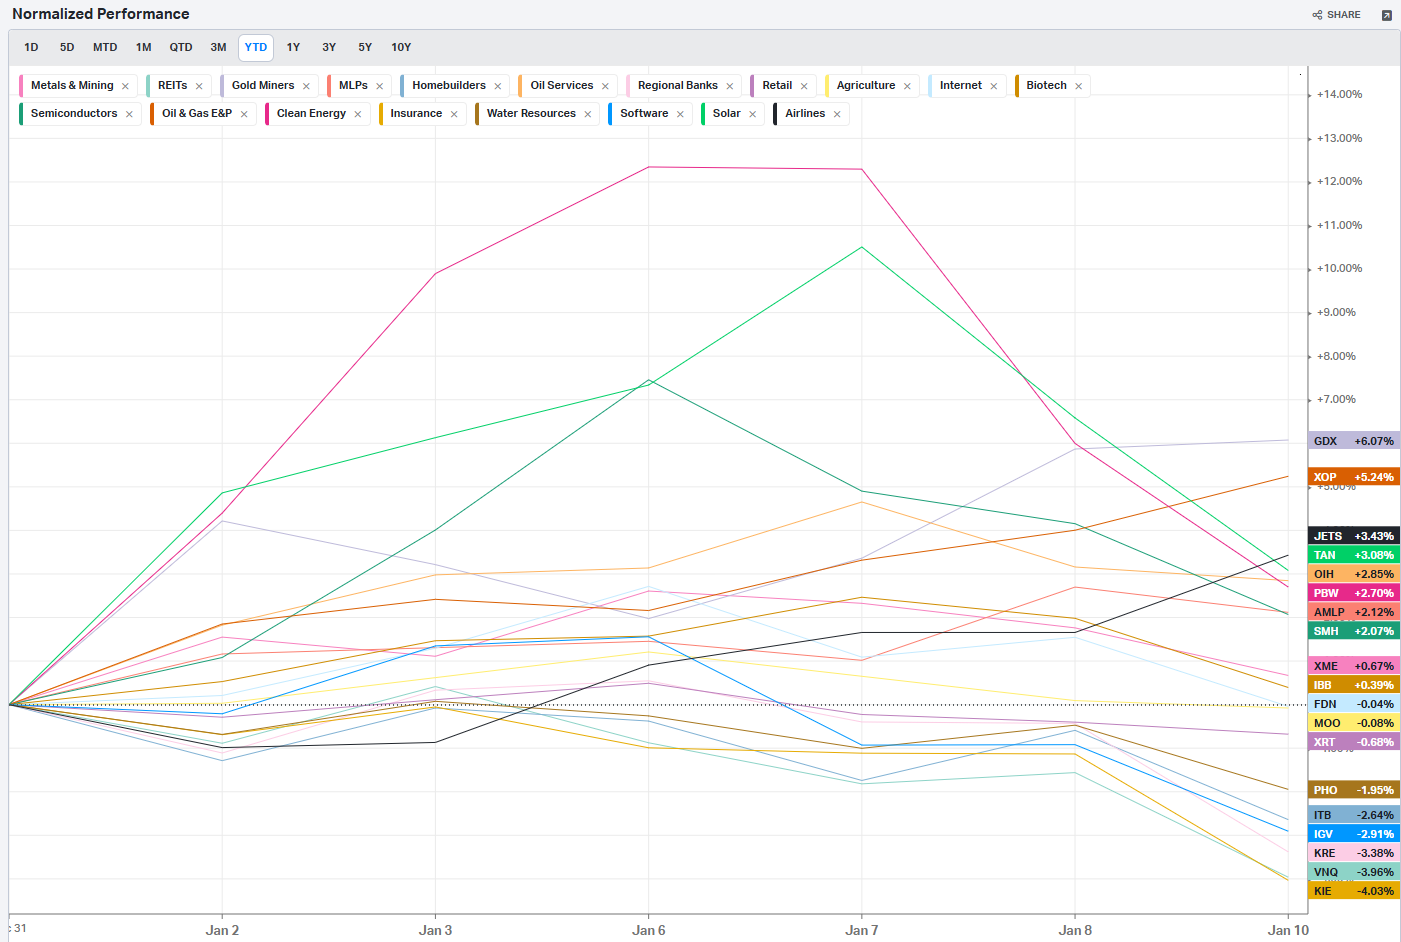
S&P By Industry
Commodities: Energy

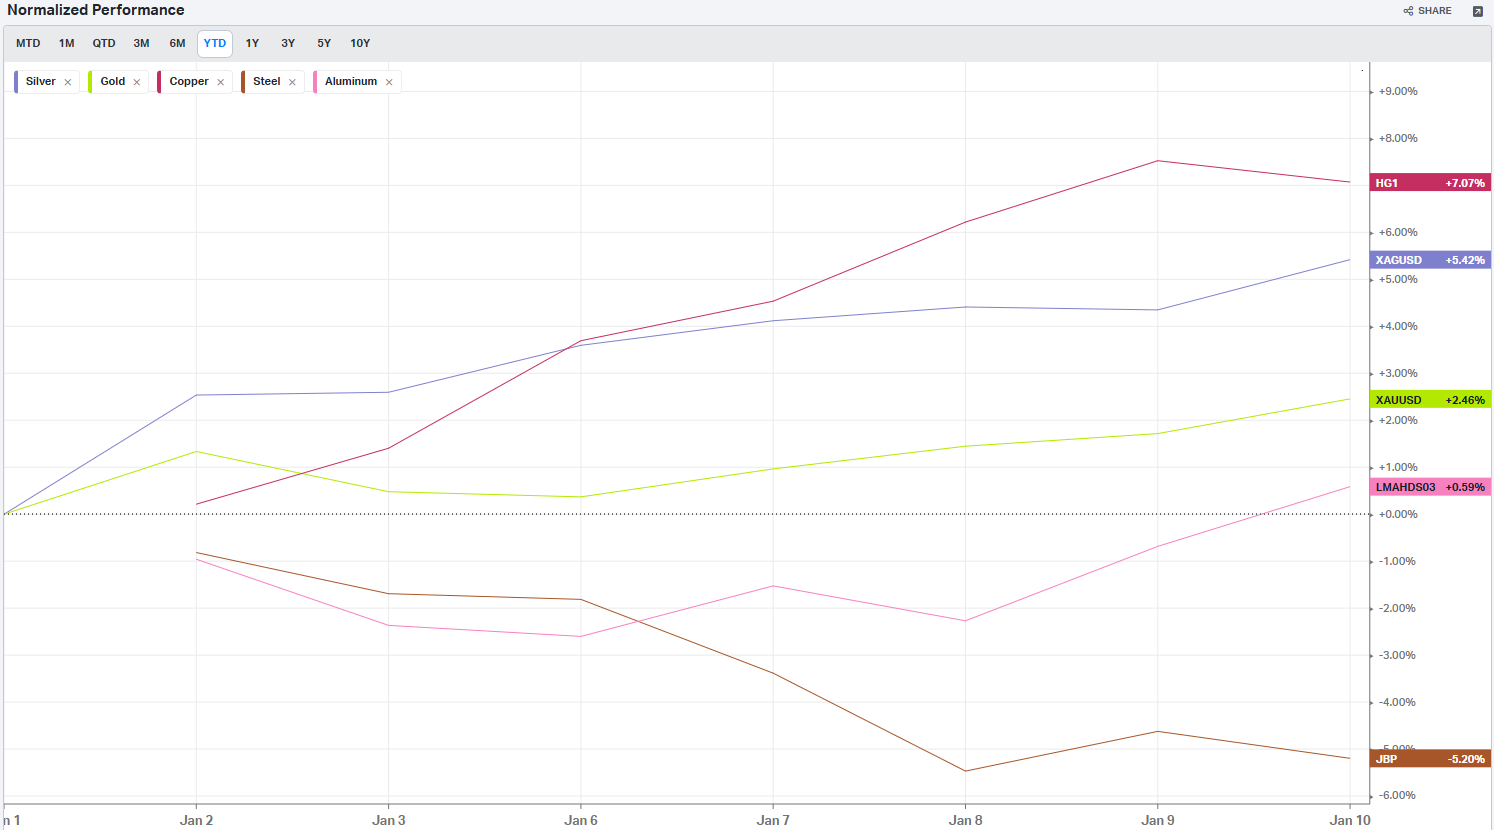
Commodities: Metals
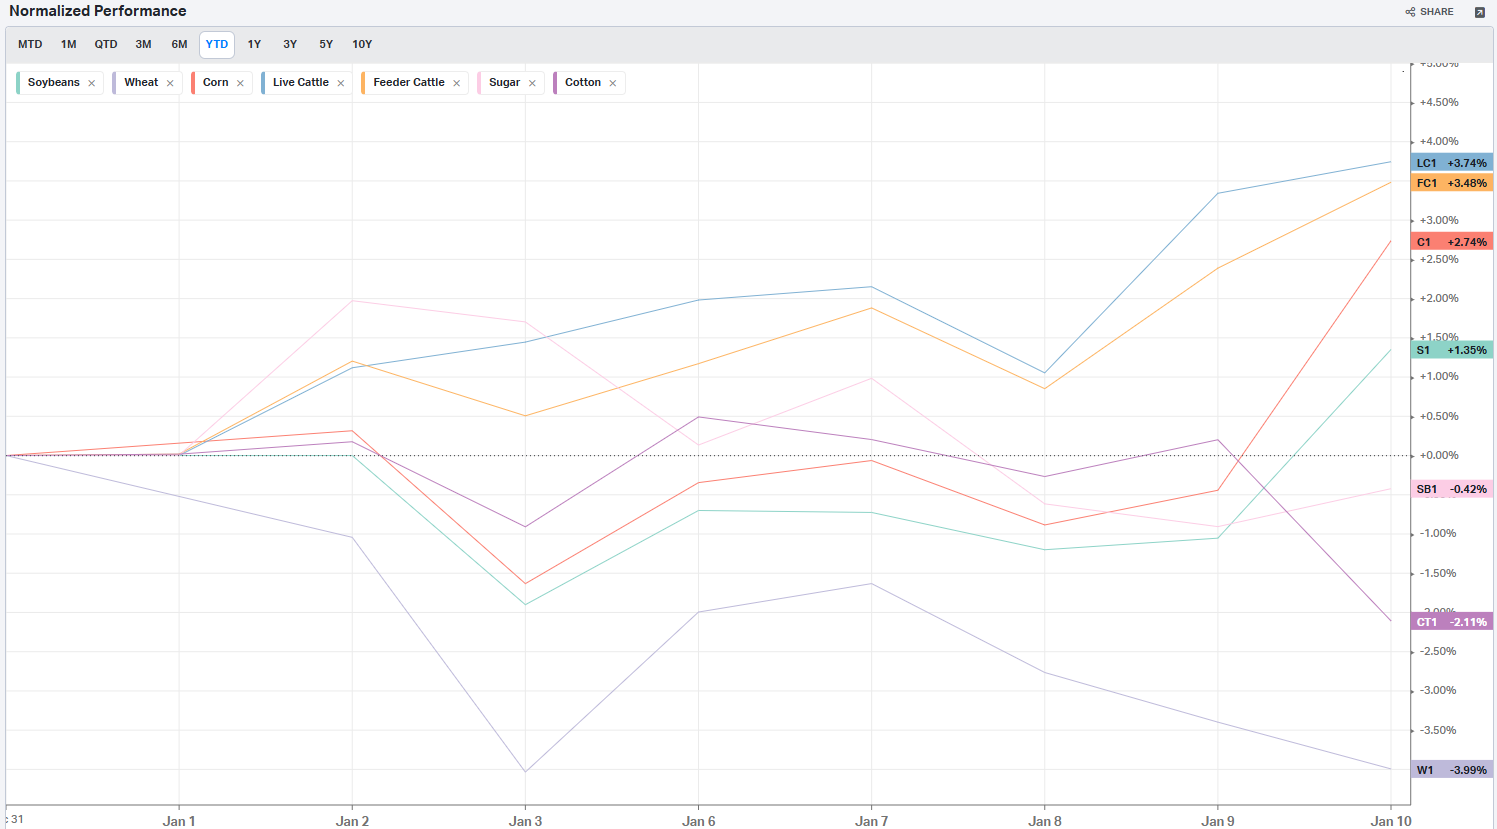
Commodities: Agriculture
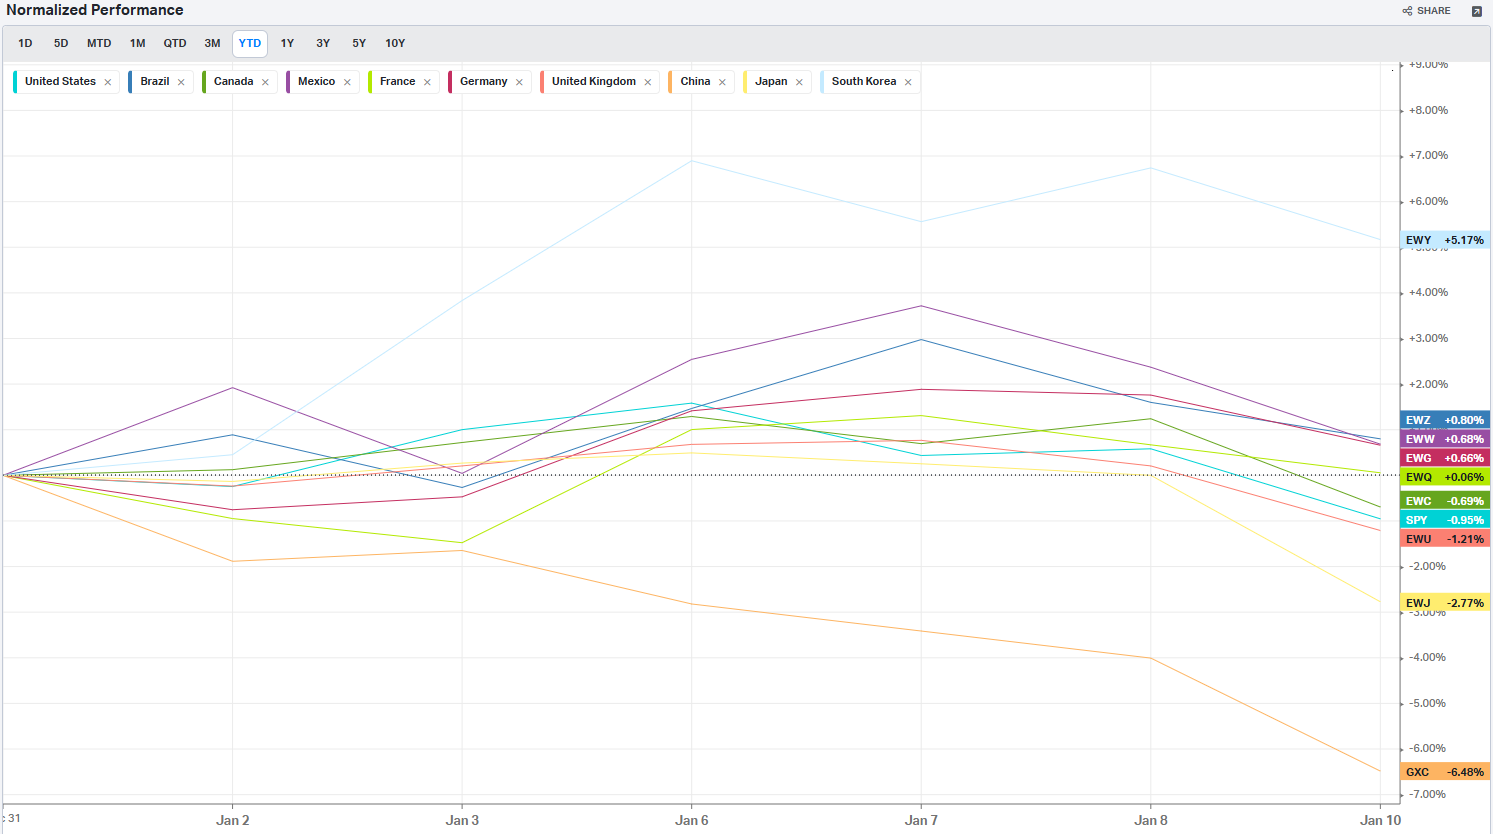
Country ETFs
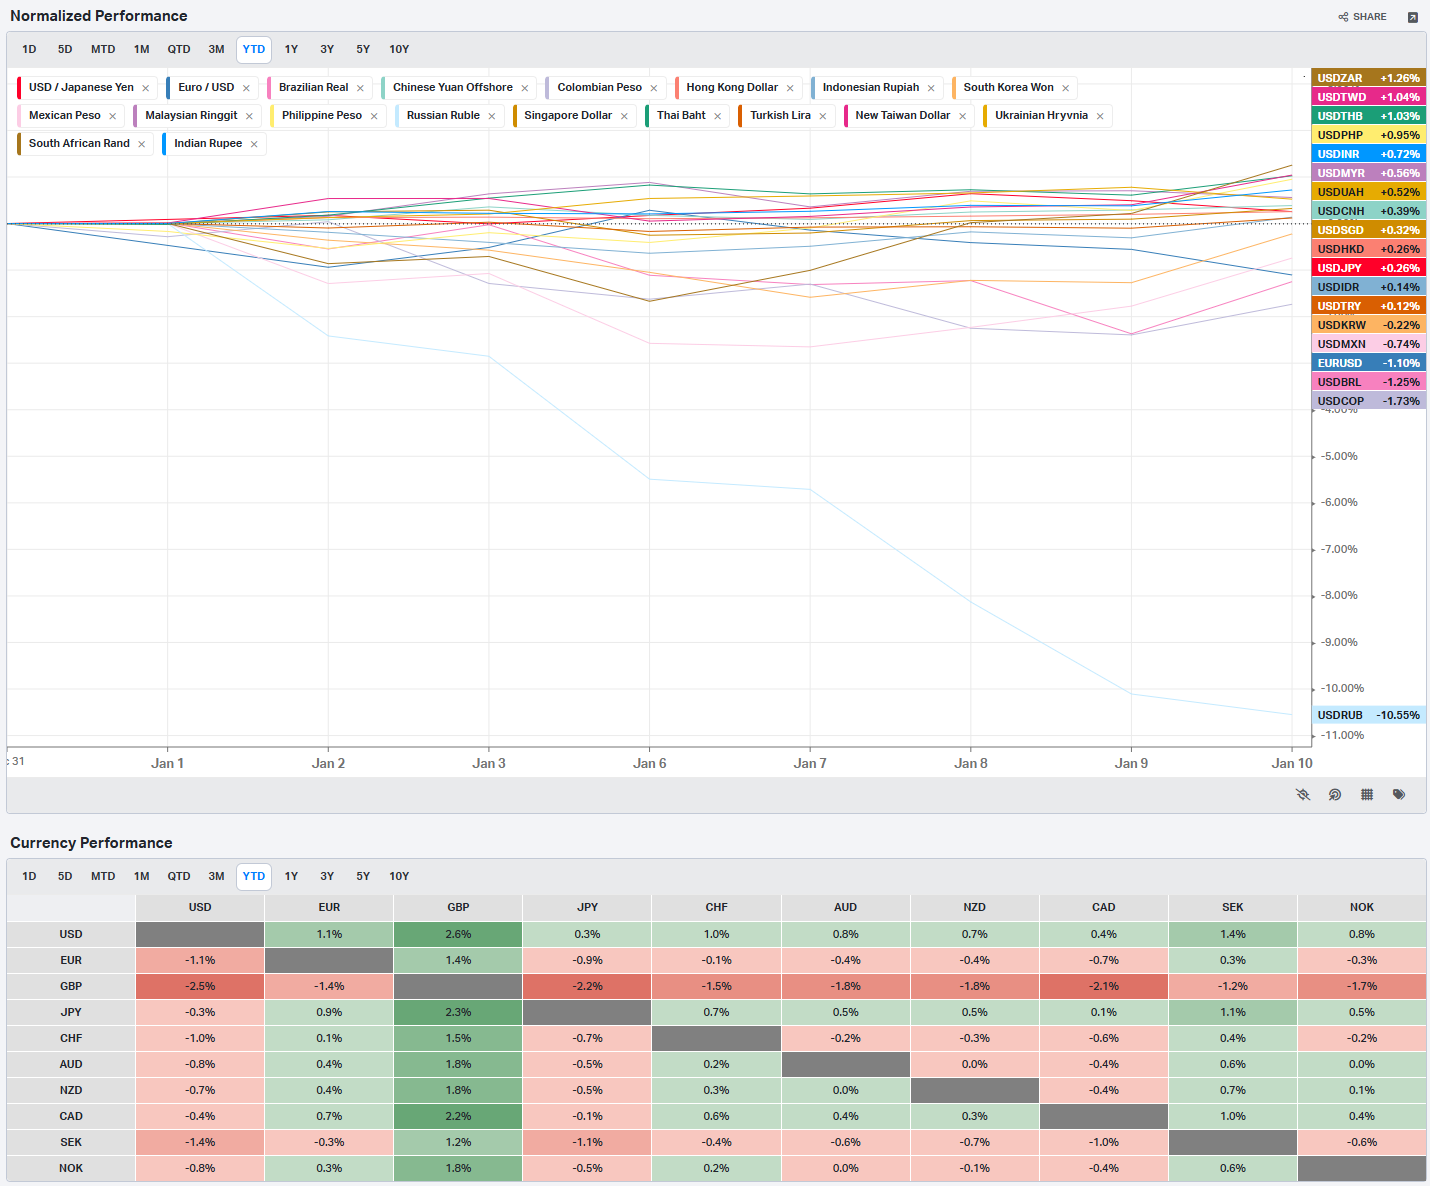
Currencies
Global Yields
Factors: Style
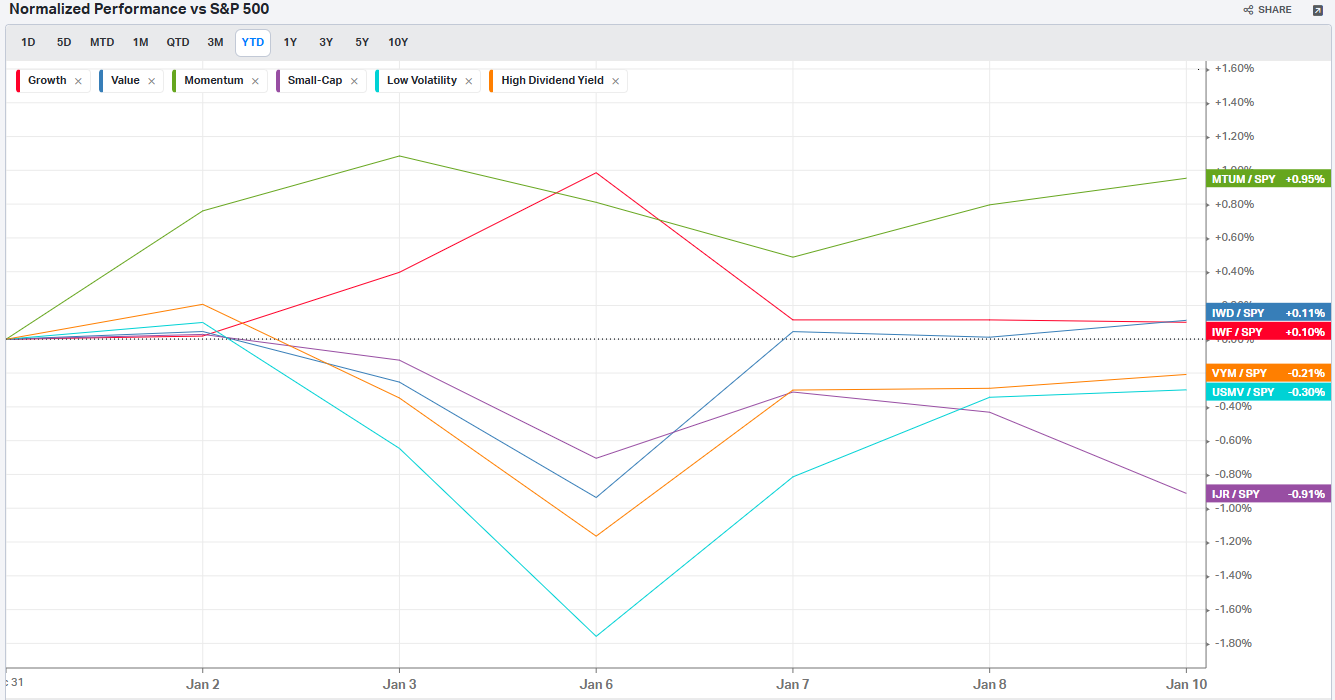
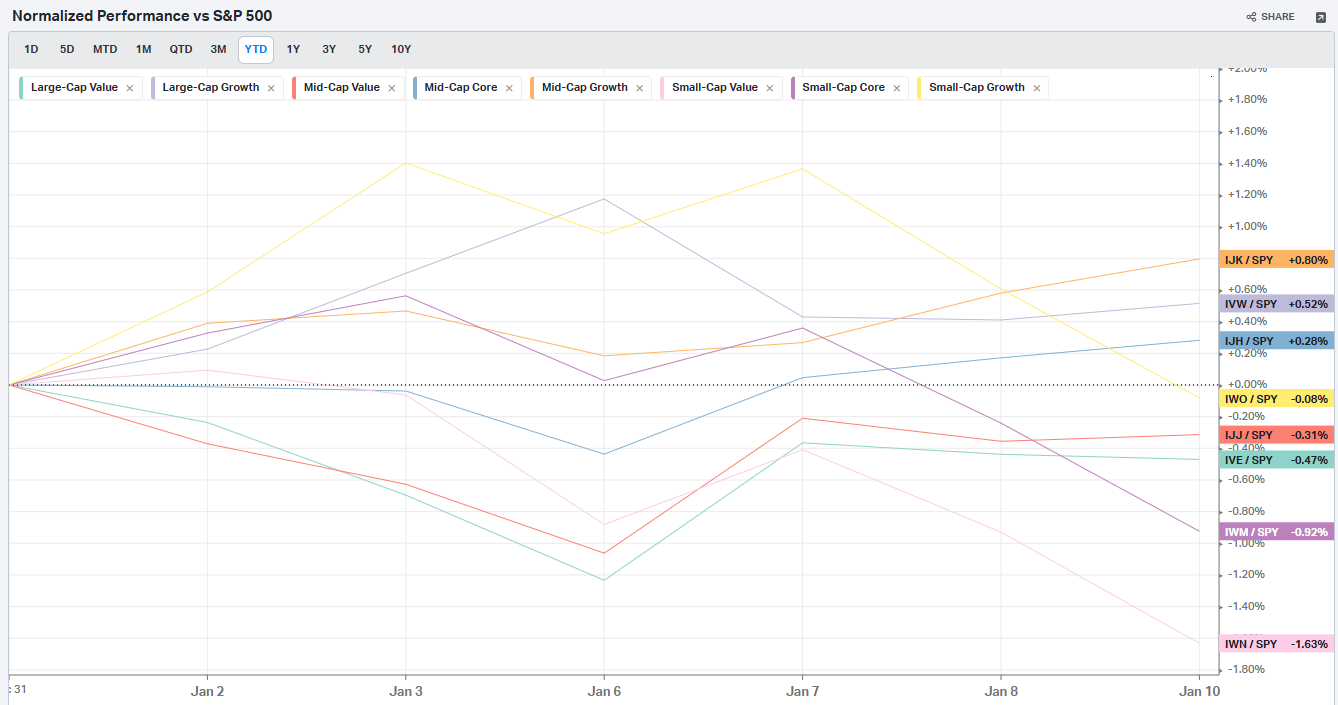
Factors: Size vs Value
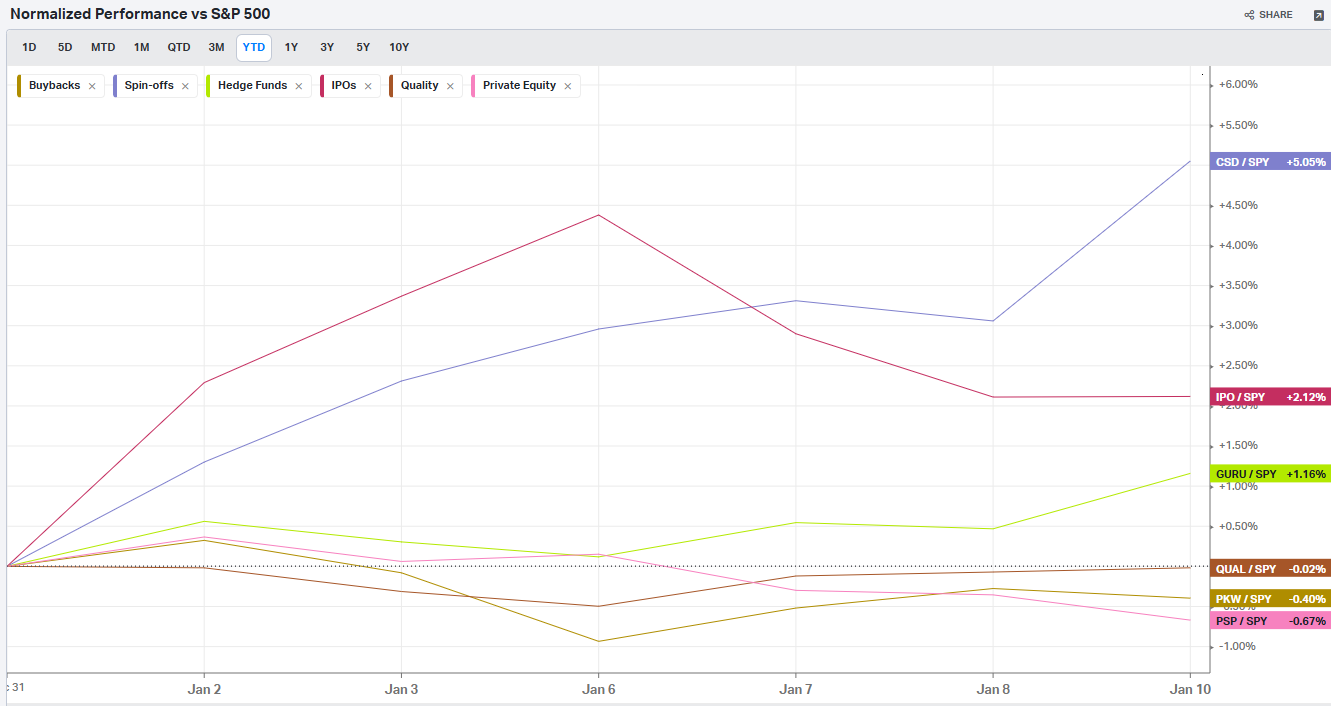
Factors: Qualitative
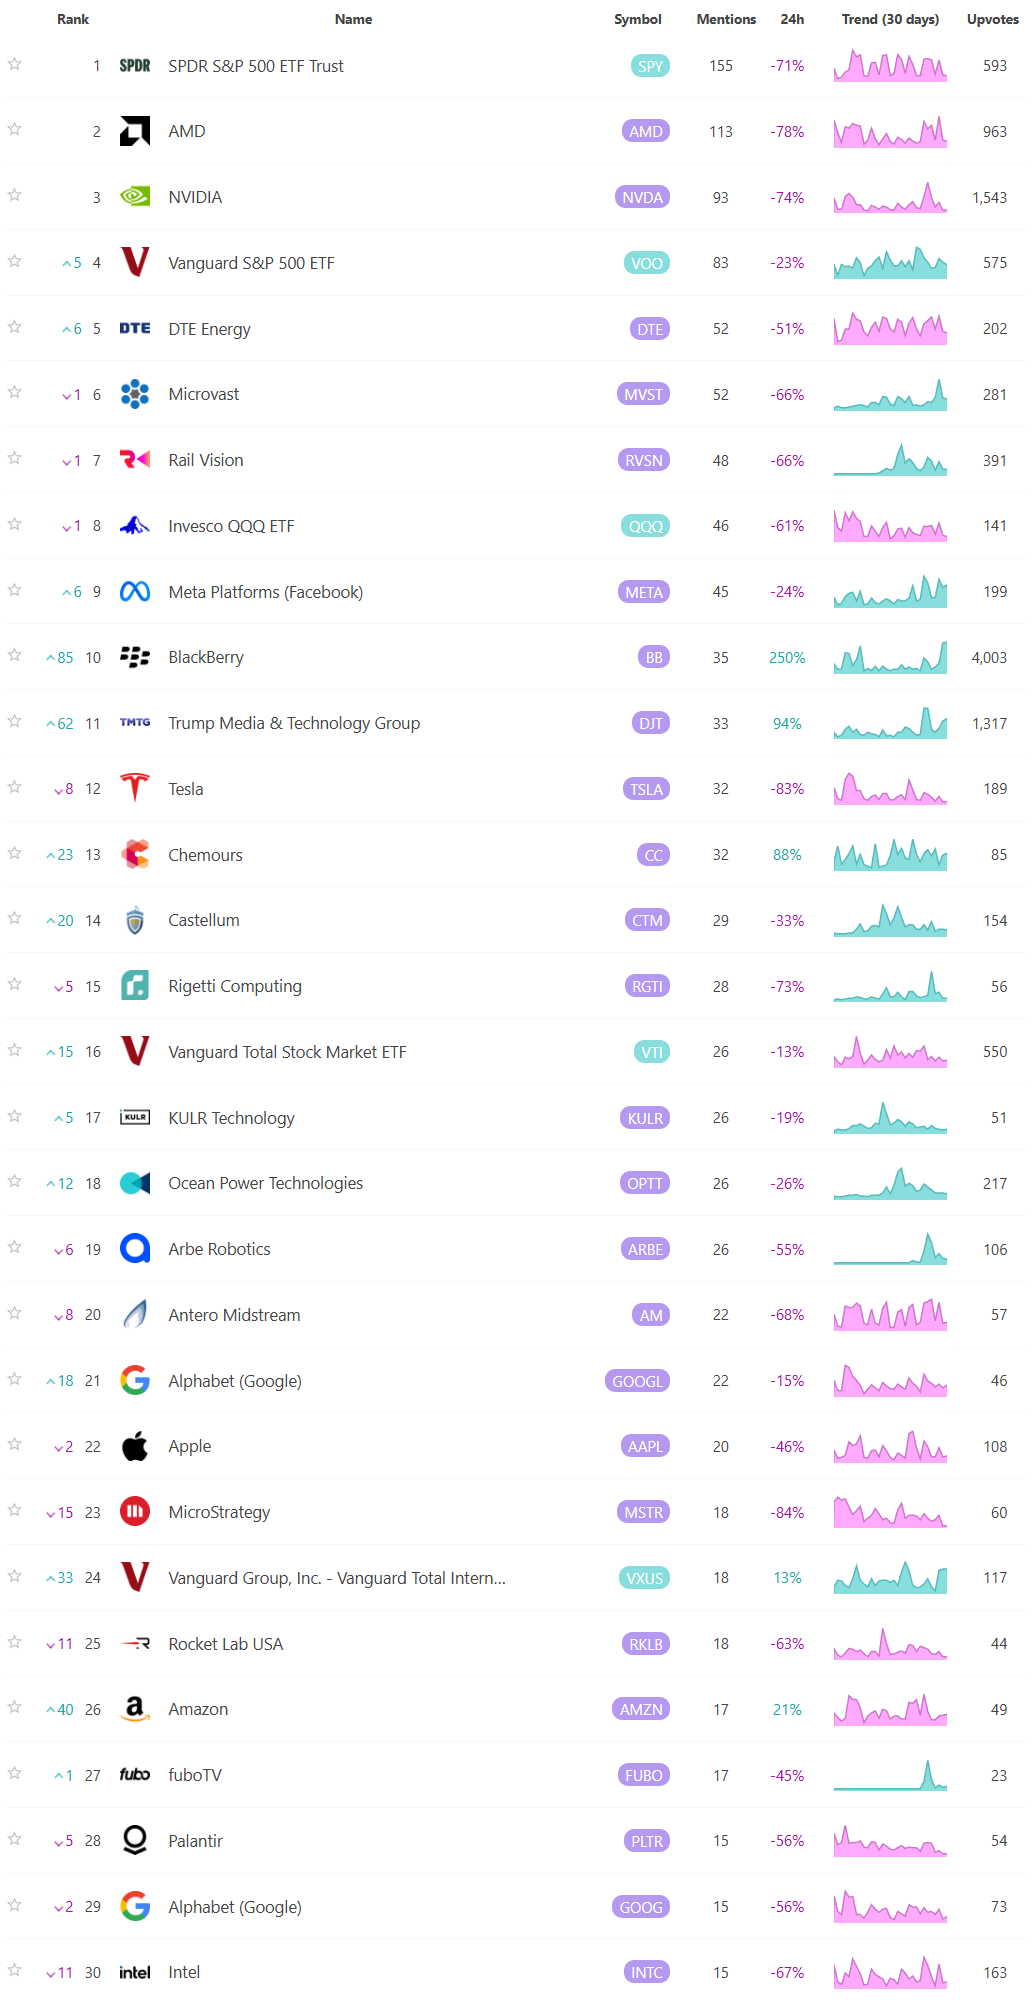
Social Media Favs
Analyzing social sentiment can provide valuable insights for investment strategies by offering a pulse on public perception, mood, and market sentiment that traditional financial indicators might not capture. Here’s how social sentiment analysis can enhance investment decisions:
Market Momentum: Positive or negative social sentiment can signal impending momentum shifts. When public opinion on a stock, sector, or asset class changes sharply, it can create buying or selling pressure, especially if that sentiment becomes widespread.
Early Detection of Trends: Social sentiment data can help investors spot trends before they show up in technical or fundamental data. For example, increased positive chatter around a particular company or sector might indicate growing interest or excitement, which could lead to price appreciation.
Gauge Retail Investor Impact: With the rise of retail investor platforms, collective sentiment on social media can lead to significant price movements (e.g., meme stocks). Understanding how retail investors view certain stocks can help in identifying high-volatility opportunities.
Event Reaction Monitoring: Social sentiment can provide real-time reactions to news events, product releases, or earnings reports. Investors can use this information to gauge market reaction quickly and adjust their strategies accordingly.
Complementing Quantitative Models: By adding a social sentiment layer to quantitative models, investors can enhance predictions. For example, a model that tracks historical price and volume data might perform even better when factoring in sentiment trends as a measure of market psychology.
Risk Management: Negative sentiment spikes can be a signal of potential downturns or increased volatility. By monitoring sentiment, investors might avoid or hedge against investments in companies experiencing a public relations crisis or facing negative perceptions.
Long-Term Sentiment Trends: Sustained sentiment trends, whether positive or negative, often mirror longer-term market cycles. Tracking sentiment trends over time can help identify shifts in investor psychology that could affect longer-term investments or sector rotations.
For these reasons, sentiment analysis, when combined with other tools, can provide a comprehensive view of both immediate market reactions and underlying investor attitudes, helping investors position themselves strategically across various time frames. Here are the most mentioned/discussed tickers on Reddit from some of the most active Subreddits for trading: