Market Momentum: Your Weekly Financial Forecast & Market Prep
Issue 27 / What to expect Jan 06, 2025 thru Jan 10, 2025

In This Issue
Market-On-Close: All of last week’s market-moving news and macro context in under 5 minutes + futures-snapshots
Special Coverage: Anticipating Market Volatility in 2025
The Latest Investor Sentiment Readings
Institutional Support & Resistance Levels For Major Indices: Exactly where to look for support and resistance this week in SPY, QQQ, IWM & DIA
Institutional Activity By Sector: Institutional order flow by sector including the top institutionally-backed names in those sectors. We break it all down and provide the key insights and take-aways you need to navigate institutional positioning this week.
Top Institutional Orderflow In Individual Names: All of the largest sweeps and trade blocks on lit exchanges and dark pools
Investments In Focus: Bull vs Bear arguments for JPM, SFM, JNPR, ABNB, ZBRA, TRP, SCHP
Top Institutionally-Backed Gainers & Losers: An explosive watchlist for day traders seeking high-volatility
Normalized Performance By Thematics YTD (Sector, Industry, Factor, Energy, Metals, Currencies, and more): which corners of the markets are beating benchmarks, which ones are overlooked and which ones are over-crowded
Key Econ Events and Earnings On-Deck For This Week

Market-On-Close
Market Overview
The first trading week of 2025 presented a mixed picture for U.S. financial markets, as investors grappled with the transition from an exceptionally strong 2024 into the uncertainties of a new year. The major stock indices experienced modest declines through most of the week before staging a recovery on Friday, with the S&P 500, Nasdaq, and Dow each posting weekly losses of approximately 0.5%. Friday's session saw the S&P 500 rise 1.26%, the Dow Jones Industrial Average gain 0.80%, and the Nasdaq 100 advance 1.67%, helping to offset earlier weakness.
The week's trading pattern reflected both the remarkable achievements of the previous year and emerging concerns about the sustainability of the market's momentum. The S&P 500's stellar performance in 2024, which included setting 57 record highs and achieving back-to-back years of 20%-plus returns for the first time since 1998, has set a high bar for 2025. However, this impressive performance was notably concentrated, with just seven technology-oriented stocks accounting for more than 53% of the index's overall return.

Key Market Drivers
Technology Sector Leadership
The week's final trading session highlighted the continuing influence of technology stocks on market direction. Megacap tech companies provided significant support to the broader market, with TSLA 0.36%↑ leading the charge by surging more than 8%. Other tech giants, including AMZN 0.00%↑ , GOOG 0.07%↑ , MSFT 0.00%↑ , and META 0.05%↑ , each gained more than 1% on Friday. The semiconductor sector showed particular strength, with ARM 0.00%↑ Holdings rising over 10% and NVDA 0.04%↑ advancing more than 4%. Other chip manufacturers, including AMD 0.18%↑ , MRVL 0.00%↑ Technology, and AMAT 0.00%↑ , posted gains exceeding 3%.
Political Developments
Market sentiment received a boost from political developments in Washington, as Louisiana Republican Mike Johnson won reelection as Speaker of the House of Representatives. This outcome was viewed positively by investors, who anticipate that Johnson's leadership could facilitate the passage of business-friendly deregulatory measures under the Trump administration. However, analysts note that policy uncertainty remains high, particularly regarding potential changes to tariffs, taxes, and regulatory frameworks.
Economic Indicators
The week brought mixed economic signals, with manufacturing data showing unexpected strength while concerns about global growth persisted. The U.S. December ISM manufacturing index surprised to the upside, rising 0.9 points to a 9-month high of 49.3, surpassing expectations of 48.2. While still in contractionary territory (below 50), the improvement suggests some resilience in the manufacturing sector.
However, the Chicago Purchasing Managers' Index painted a more concerning picture, plummeting to 36.9 in December from 40.2 in November, marking the 13th consecutive month of contracting activity. This represented the steepest month-over-month decline since May and fell well short of the expected 42.9 reading.
Labor Market Strength
The employment picture remained robust, with initial jobless claims falling to 211,000 for the week ended December 28, the lowest level in eight months. This decline from the previous week's 220,000 claims, coupled with continuing claims dropping to a three-month low of 1.84 million, suggests ongoing strength in the labor market despite broader economic uncertainties.

Interest Rates and Bond Markets
Treasury Market Dynamics
The bond market experienced notable volatility, with the 10-year Treasury yield rising 3.5 basis points to 4.594% by week's end. The movement in yields reflected various factors, including the stronger-than-expected ISM manufacturing data and comments from Richmond Fed President Barkin indicating ongoing concerns about inflation risks. Supply pressures also weighed on the Treasury market, with the Treasury scheduled to auction $119 billion of notes and bonds in the coming week.

Federal Reserve Outlook
Market participants continued to adjust their expectations for Federal Reserve policy in 2025. Current pricing suggests an 11% probability of a 25-basis-point rate cut at the January 28-29 FOMC meeting. Richmond Fed President Barkin's comments suggested a cautious approach to policy easing, noting that while inflation has moderated, there remain "upside risks to inflation and growth," supporting the case for maintaining restrictive rates for a longer period.

International Markets
Global Market Performance
Overseas markets generally underperformed their U.S. counterparts during the week. The Euro Stoxx 50 declined 0.94%, while China's Shanghai Composite Index fell 1.57% to reach a 1½-month low. Japanese markets were closed for a bank holiday. The weakness in Chinese markets, coupled with the yuan's descent to a 14-month low against the dollar, raised concerns about global growth prospects.
European Economic Data
European economic indicators showed some resilience, with German unemployment data coming in better than expected. The December unemployment change showed an increase of 10,000 jobs, better than the anticipated 15,000 increase, while the unemployment rate held steady at 6.1%, defying expectations for an increase to 6.2%. Market participants are pricing in a 100% probability of a 25-basis-point rate cut by the European Central Bank at its January 30 policy meeting.
Sector Performance and Notable Moves
Individual Stock Highlights
Several companies saw significant stock movements based on analyst actions and corporate news:
SQ 0.00%↑ surged more than 6% following an upgrade to outperform by Raymond James
CHWY 0.00%↑ gained over 6% after receiving an outperform rating from Wolfe Research
JBL 0.00%↑ advanced more than 4% after announcing a warrant issuance to Amazon.com
US Steel ( X -0.32%↓ )declined more than 6% on reports of potential government intervention in its proposed sale to Nippon Steel
CVNA 0.00%↑ dropped more than 10% after Hindenburg Research announced a short position
Industry Trends
The alcohol beverage sector faced pressure following the U.S. Surgeon General's suggestion that product labels should include cancer warnings. This impacted stocks such as Molson Coors Beverage ( TAP 0.00%↑ -3%) and Brown-Forman Corp ( $BF.B -2%) and Boston Beer ( SAM 0.00%↑ ) . The automotive sector also saw movement, with Stellantis ( STLA 0.00%↑ ) declining on news that some of its electric vehicle models would lose eligibility for U.S. tax credits under stricter rules.
Looking Ahead to 2025
Economic Outlook
Analysts anticipate a year of moderate but positive economic growth in 2025, with GDP expected to maintain a pace near its long-term potential of around 2%. Consumer spending, supported by a healthy labor market and rising real wages, should continue to provide economic stability. The manufacturing sector may show signs of improvement after a period of weakness, while services spending could moderate following exceptional strength.
Market Expectations
While the sharp gains of 2024 may be difficult to replicate, several factors support continued market strength in 2025:
Expectations for corporate profit growth of 10-15%
Potential benefits from deregulation and pro-growth policies
Opportunities for broader market participation beyond mega-cap tech stocks
Favorable positioning for value-oriented sectors and dividend stocks

Investment Implications
Investors are advised to maintain a balanced approach while preparing for potentially increased volatility. Key considerations include:
Regular portfolio rebalancing to ensure proper diversification
Attention to opportunities in previously lagging market segments
Monitoring of policy developments and their potential market impact
Recognition that returns may moderate compared to the exceptional performance of 2024

Risks and Challenges
Policy Uncertainty
The implementation of new administration policies, particularly regarding trade and regulation, could create market volatility. The timing and scope of potential corporate tax changes and deregulatory measures remain uncertain, potentially affecting different market sectors asymmetrically.
Interest Rate Environment
While the Federal Reserve is expected to begin easing monetary policy, the pace and timing of rate cuts remain uncertain. The 10-year Treasury yield is anticipated to trade in a range of 4-4.5% throughout 2025, with various factors including deficit spending and inflation expectations influencing yield movements.
Global Economic Concerns
Weakness in Chinese economic growth and potential trade tensions present ongoing risks to global market stability. The strength of the U.S. dollar, which reached a two-year high, could impact multinational corporations' earnings and global trade dynamics.
Conclusion
As markets transition into 2025, the investment landscape presents both opportunities and challenges. While the exceptional returns of 2024 may be difficult to replicate, fundamental factors including economic growth, corporate earnings, and monetary policy normalization support continued market strength. However, investors should remain mindful of potential volatility arising from policy changes, global economic uncertainty, and the evolution of market leadership beyond the dominant technology sector.
Success in 2025 will likely require a more nuanced approach to portfolio management, with attention to diversification across sectors and investment styles. While technology and growth stocks may continue to play important roles, opportunities in value-oriented sectors and previously lagging market segments could provide additional sources of returns as the market environment evolves.
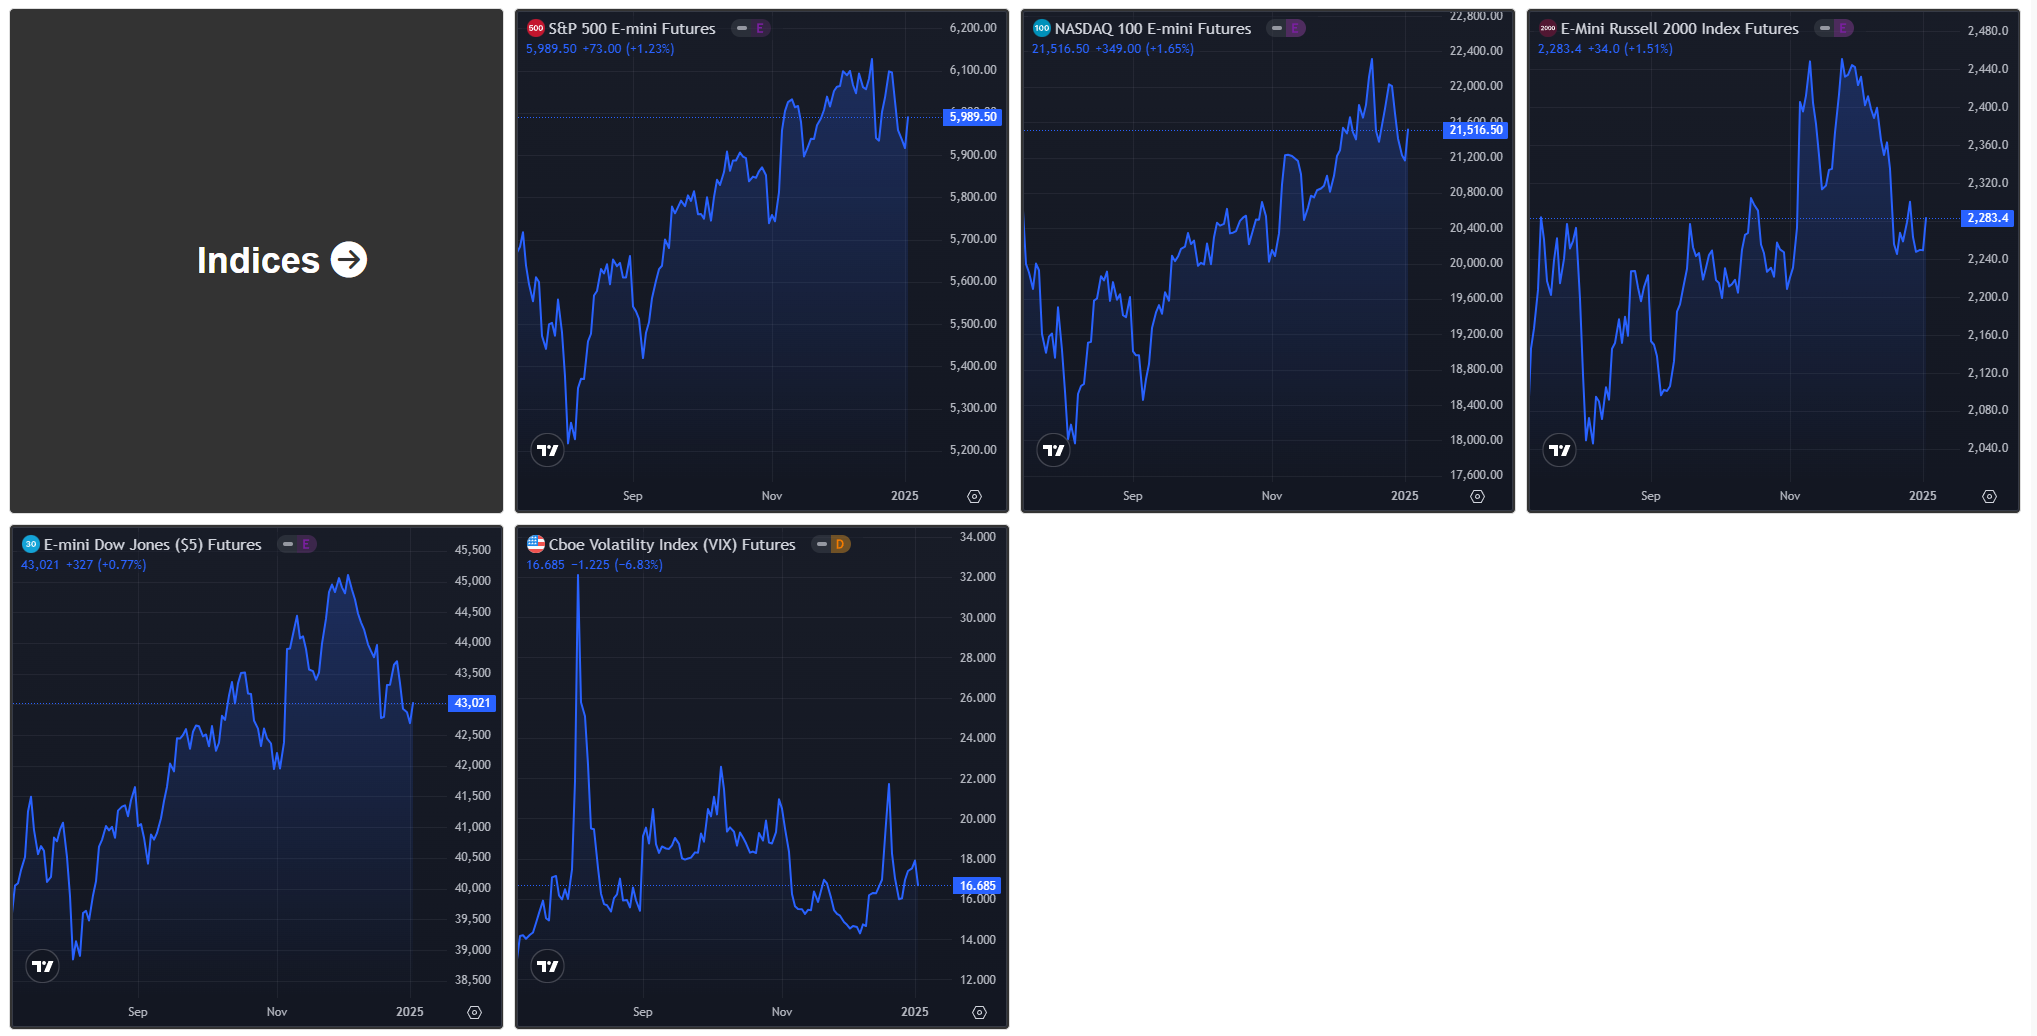
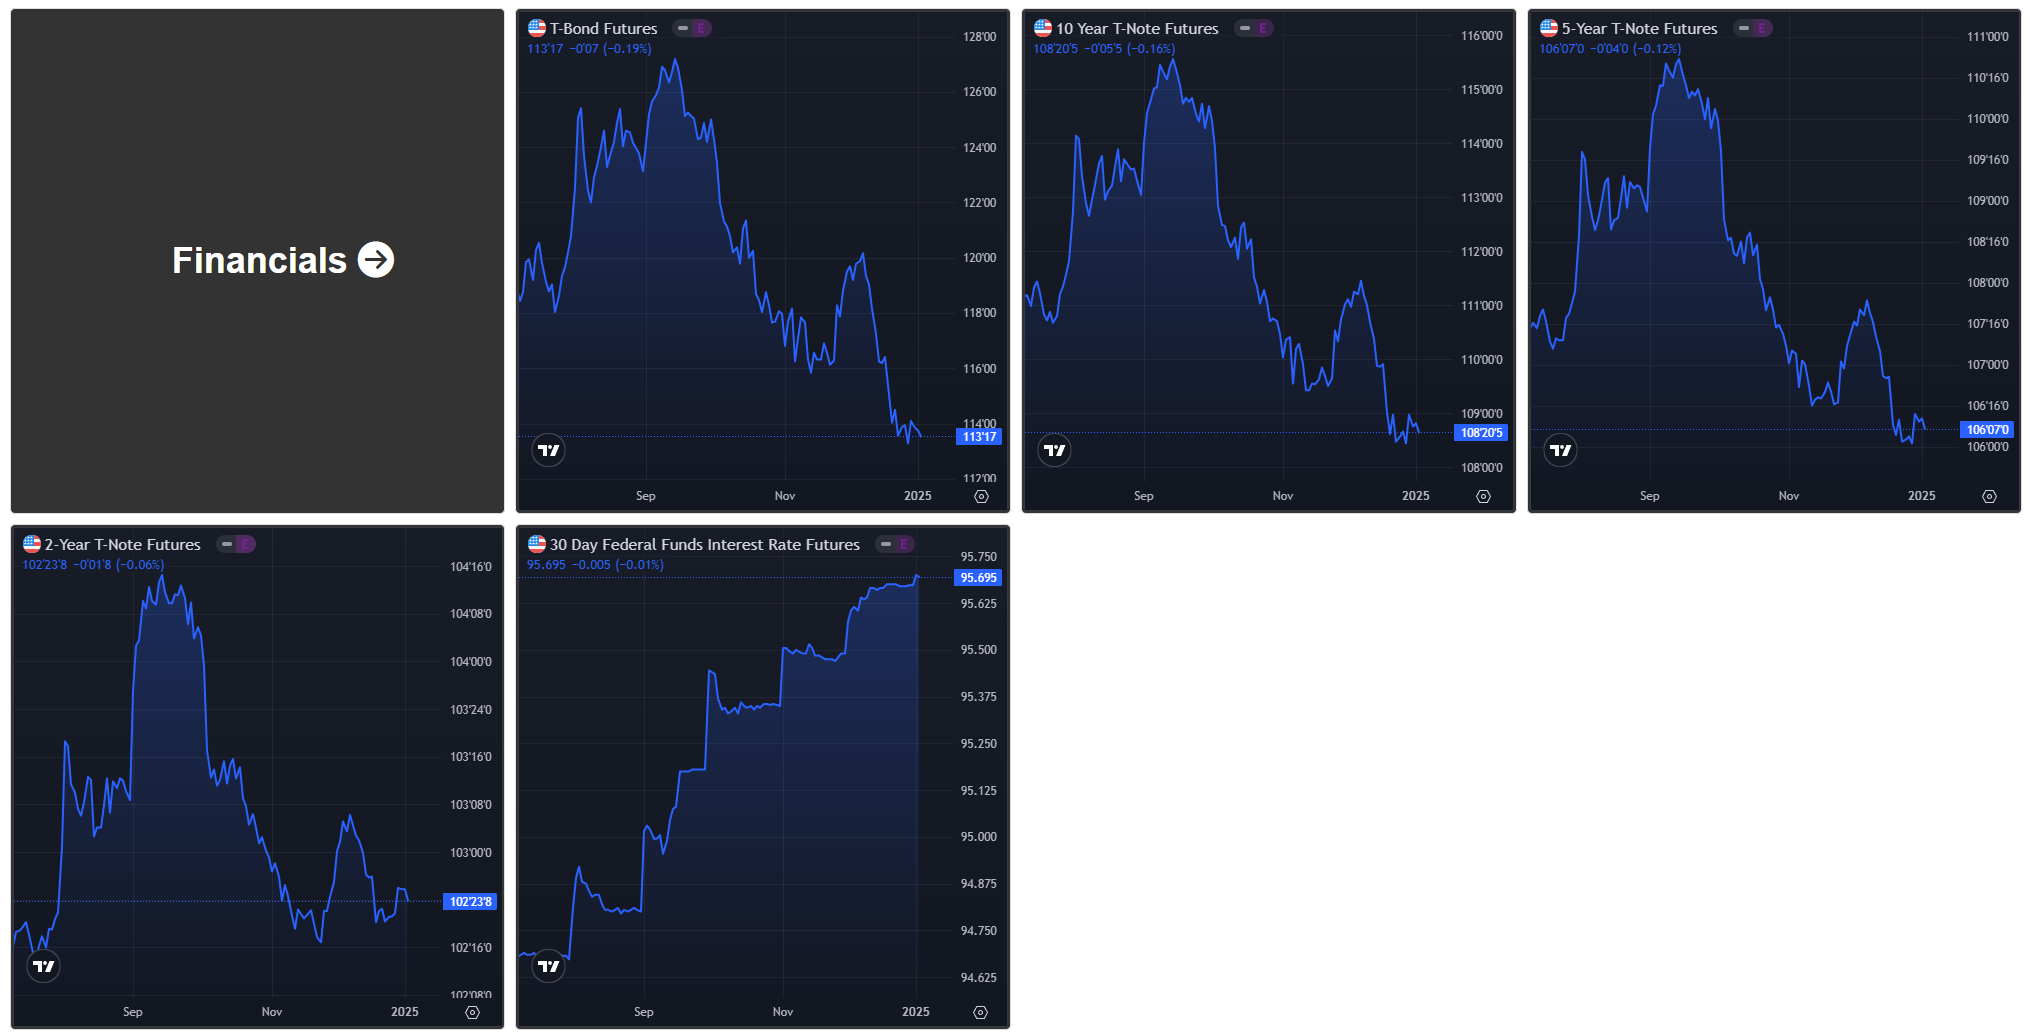
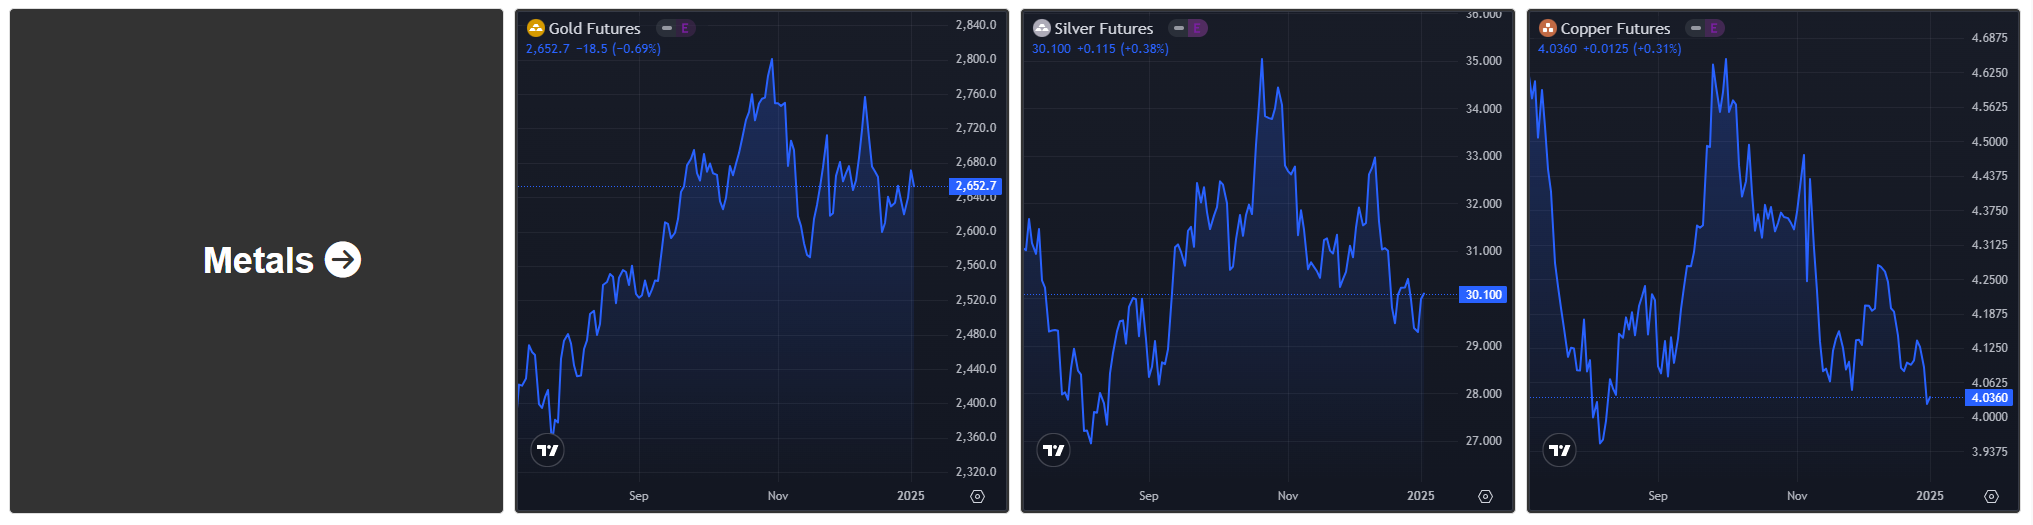
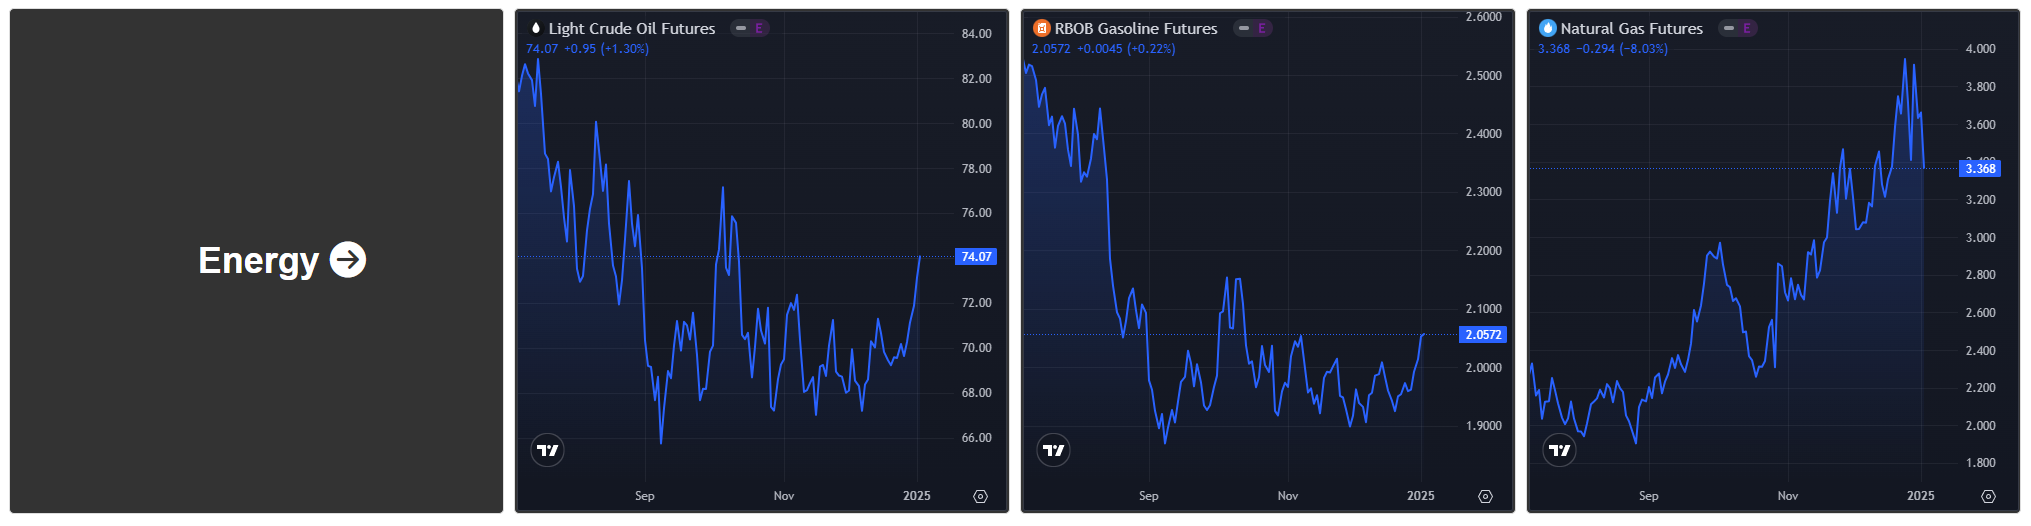
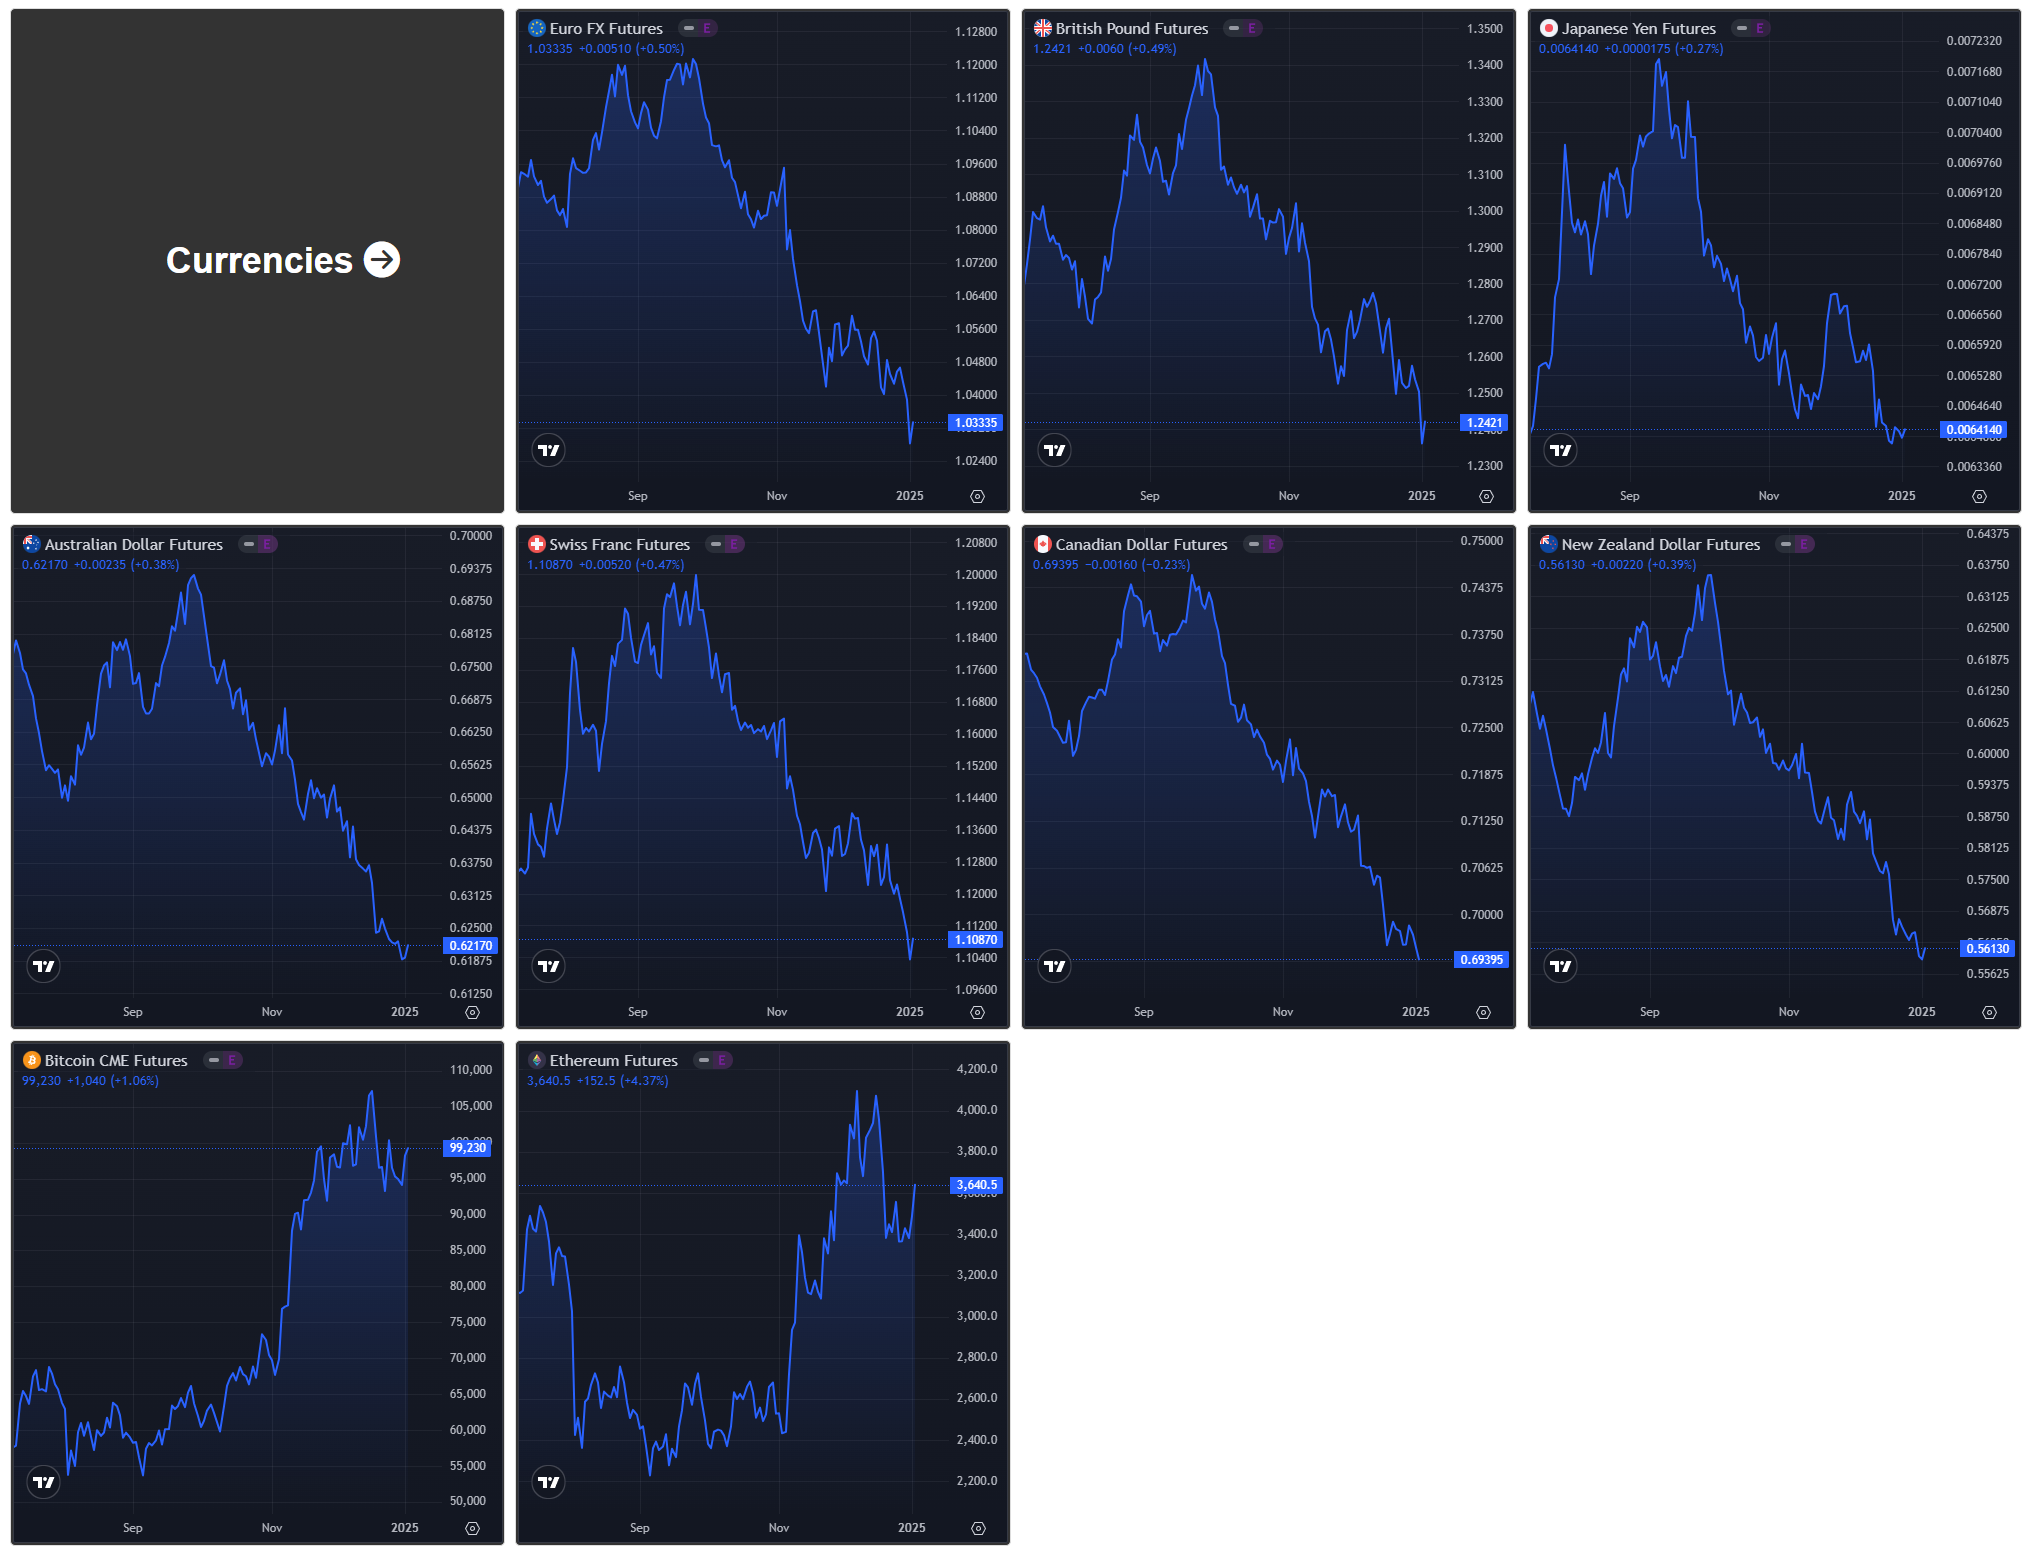
Futures Markets Snapshots
S&P 500: Sector Insights
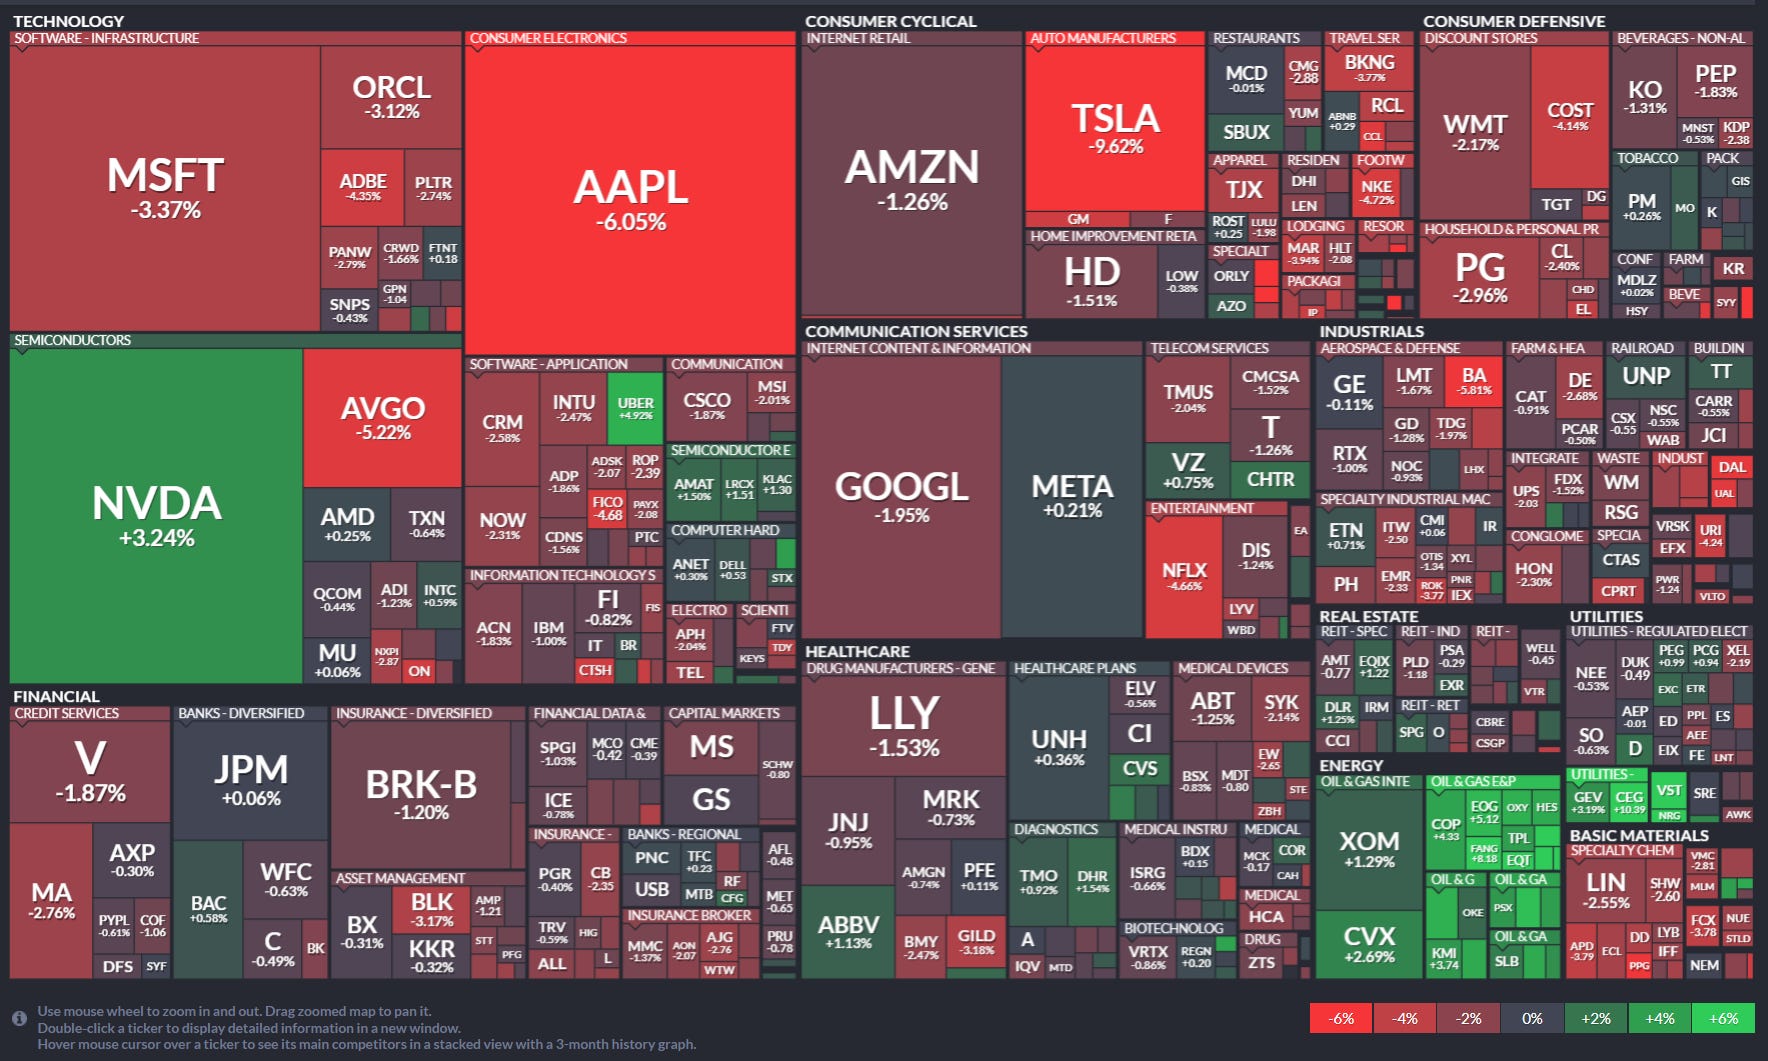
Technology
MSFT (-3.37%): Declined as part of a broader selloff in mega-cap tech stocks due to renewed fears about extended monetary tightening.
AAPL (-6.05%): Apple was one of the biggest laggards, reflecting investor concerns over slower-than-expected iPhone 15 sales and reduced demand in China.
NVDA (+3.24%): Nvidia bucked the downward trend, supported by strong AI-related demand and continued dominance in the GPU market.
AVGO (-5.22%): Fell after weaker-than-expected guidance for the next quarter, particularly around its networking and wireless businesses.
Consumer Cyclical
TSLA (-9.62%): Tesla faced heavy losses following concerns about price cuts impacting margins and heightened competition in the EV market.
AMZN (-1.26%): Amazon saw modest declines, with investors digesting mixed retail sector data and uncertain consumer spending trends.
HD (-1.51%): Home Depot declined marginally amidst concerns about the broader housing market slowdown.
Communication Services
GOOGL (-1.95%): Alphabet slid as investors rotated away from tech-heavy names, despite strong performance in its cloud business.
META (+0.21%): Meta remained mostly flat, supported by optimism around its VR initiatives and strong engagement growth.
NFLX (-6.66%): Declined significantly as concerns over slowing subscriber growth and competitive pressures weighed on sentiment.
Healthcare
LLY (-1.53%): Eli Lilly dropped slightly, reflecting broader weakness in healthcare stocks amidst concerns over potential regulatory pressures on drug pricing.
ABBV (+1.13%): Outperformed, supported by strong sales figures for its immunology portfolio and positive clinical data.
Industrials
BA (-3.81%): Boeing declined after reports of continued supply chain constraints affecting its production targets.
GE (-0.11%): General Electric showed resilience, likely supported by strong performance in its aerospace division.
Energy
XOM (+1.29%) and CVX (+2.69%): Energy stocks rebounded, driven by a slight uptick in crude oil prices and better-than-expected earnings from key players.
Financials
V (-1.87%) and MA (-2.76%): Payment processors declined as higher bond yields raised concerns about slowing consumer spending.
BRK-B (-1.20%): Berkshire Hathaway saw a small decline, reflecting broader market weakness rather than company-specific news.
Consumer Staples
PG (-2.96%): Procter & Gamble declined as investors rotated out of defensive names into growth sectors amidst expectations of higher yields.
Utilities
Utilities showed mixed performance as rising bond yields continued to pressure this interest-sensitive sector. Defensive stocks lost some appeal.
Key Takeaways
Tech Weakness: The technology sector saw heavy losses, driven by concerns over high valuations, with Apple and Microsoft leading the declines.
Tesla Under Pressure: Tesla’s double-digit drop highlighted investor worries over profitability and competitive dynamics in the EV market.
Energy Gains: Energy was one of the few sectors with positive performance, as ExxonMobil and Chevron benefited from recovering oil prices.
Healthcare Resilience: While healthcare overall was weak, AbbVie stood out positively due to strong fundamentals.
ETF Insights
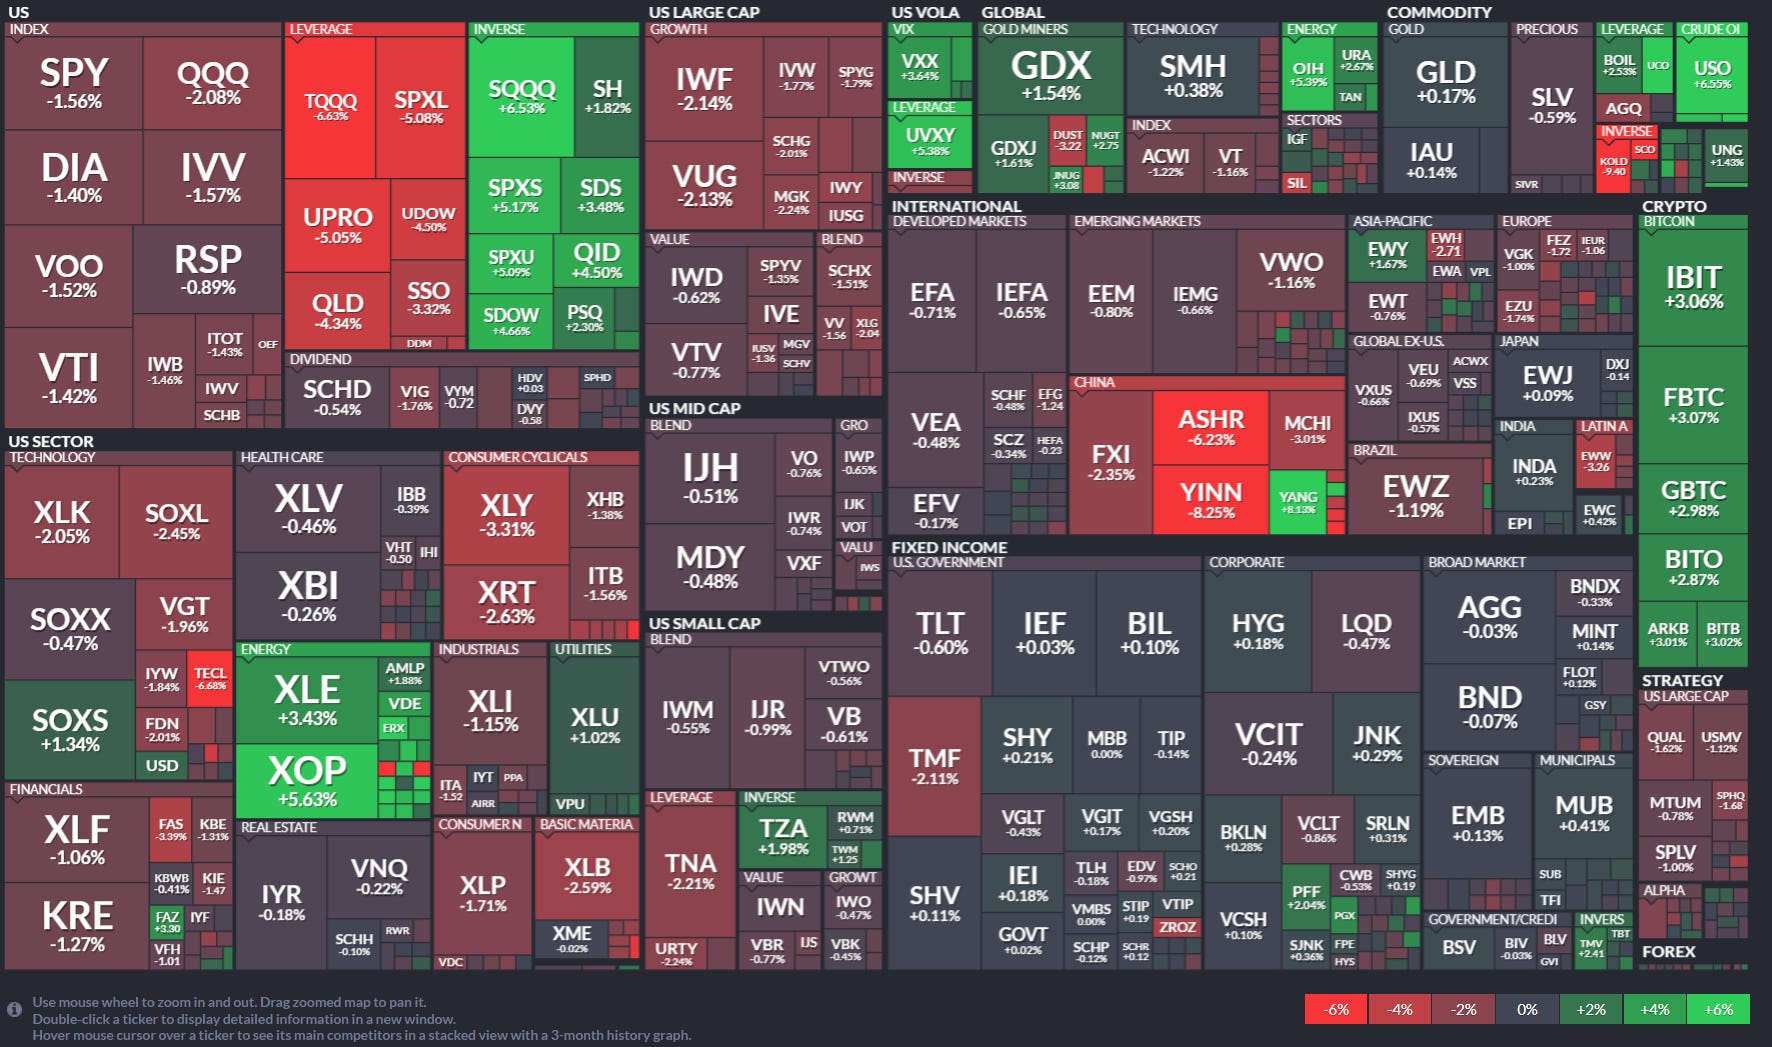
US Large Cap
SPY (-1.56%) and QQQ (-2.08%): Both broad-market ETFs declined this week, with technology-focused QQQ underperforming SPY as investors reacted to rising bond yields and concerns over stretched valuations in growth stocks.
RSP (-0.89%): The equal-weighted S&P 500 ETF outperformed SPY, reflecting slightly better performance in smaller names versus mega-caps.
US Sector ETFs
Technology (XLK, -2.05%): The technology sector continued to face pressure due to rising interest rates, which weigh on growth stock valuations.
Leveraged ETF SOXS (+1.34%), betting against semiconductor stocks, saw gains as some chipmakers showed weakness.
VGT (-1.96%): Broad tech sector ETFs followed the broader market's pullback.
Energy (XLE, +3.43%): Energy was the best-performing sector, driven by strong oil price recovery.
XOP (+5.63%): Outperformed within energy ETFs, reflecting strength in oil exploration and production stocks.
USO (+6.55%): Crude oil-linked ETFs gained due to supply concerns and geopolitical risks.
Consumer Discretionary (XLY, -3.31%): Consumer discretionary ETFs underperformed amid mixed retail earnings and concerns about high consumer debt.
XRT (-1.56%): Retail-focused ETFs showed resilience compared to broader discretionary names.
Healthcare (XLV, -0.46%): Healthcare held up relatively well, benefiting from its defensive nature, with biotech-focused XBI (-0.26%) outperforming.
Utilities (XLU, -1.15%): Utilities struggled as rising yields made their dividend yields less attractive to investors.
US Small and Mid-Cap
IJH (-0.51%) and IWM (-0.55%): Mid- and small-cap ETFs slightly outperformed their large-cap counterparts, showing relative resilience despite broader market weakness.
International and Emerging Markets
China (FXI, -2.35%): Chinese ETFs declined as weak economic data and geopolitical concerns weighed on sentiment.
Leveraged ETF YINN (-8.25%) was particularly hard-hit, reflecting bearish sentiment on China.
Emerging Markets (EEM, -0.80%): Emerging market ETFs were pressured by a stronger dollar and global growth concerns.
Japan (EWJ, +0.09%): Japanese ETFs were a rare bright spot, buoyed by a weaker yen and optimism around corporate reforms.
Fixed Income
TLT (-0.60%): Long-duration Treasury ETFs fell as yields continued to rise.
TMF (-2.11%): Leveraged long Treasury ETFs saw outsized losses due to their sensitivity to rising rates.
IEF (+0.03%): Shorter-duration Treasuries fared better as investors moved further out on the yield curve.
Commodities and Cryptocurrency
Gold (GLD, +0.17%) and Silver (SLV, -0.95%): Precious metals were mixed, with gold holding steady due to safe-haven demand, while silver fell on industrial demand concerns.
Oil (USO, +6.55%): Oil prices surged amid supply cuts and geopolitical risks, supporting energy-related ETFs.
Bitcoin ETFs (BITO, +2.87%) and GBTC (+2.98%): Crypto-linked ETFs rallied on renewed optimism in the cryptocurrency market, bolstered by increasing regulatory clarity and Bitcoin's recent strength.
Leverage and Inverse ETFs
TZA (+1.98%): Small-cap bear leveraged ETF gained, reflecting pressure on small-cap stocks this week.
SOXL (-2.45%): Leveraged bullish bets on semiconductors struggled as the tech sector weakened overall.
SOQQQ (+6.53%): Bearish bets on the Nasdaq performed strongly as tech-heavy ETFs sold off.
Key Takeaways
Energy Outperformance: Energy ETFs led the market, driven by strong oil prices and optimism around exploration and production stocks.
Tech Weakness: Technology ETFs were hit hard, especially leveraged bullish tech ETFs, reflecting concerns about rising rates and valuations.
Crypto Strength: Cryptocurrency-linked ETFs continued to rebound, supported by Bitcoin's recent rally and broader market interest.
Resilience in Mid- and Small-Caps: Mid-cap and small-cap ETFs showed relative outperformance, highlighting interest in diversified equity exposure.

[Special Coverage] Anticipating Market Volatility in 2025
As we embark on 2025, investors are bracing for a year characterized by significant volatility in the U.S. financial markets. If the first few sessions are any indication of things to come, we could be in for some thrilling moves. The anticipated turbulence stems from a confluence of factors, including the Federal Reserve's monetary policy adjustments, persistent inflationary pressures, and the economic policies of the Trump administration. Recognizing these dynamics among the current backdrop of geopolitical uncertainty is crucial for investors seeking to navigate the complexities of the current financial landscape.
Federal Reserve's Monetary Policy: A Delicate Balancing Act
The Federal Reserve's approach to interest rates in 2025 is poised to play a pivotal role in shaping market conditions. In December 2024, the Fed reduced its key interest rate by a quarter-point to a target range of 4.25% to 4.5%, marking the third cut of the year. However, the central bank signaled a more gradual pace of rate reductions for 2025, projecting only two quarter-point cuts, a departure from the four cuts anticipated in September.
This cautious stance reflects the Fed's commitment to combating persistent inflation, which remains above its 2% target. Federal Reserve Chair Jerome Powell emphasized the need for a measured approach, stating that the current policy is "appropriately restrictive" to return inflation to the desired level. The Fed's projections indicate that the federal funds rate could remain higher for longer, with potential implications for borrowing costs and investment decisions.
Inflationary Pressures: A Persistent Challenge
Inflation continues to be a significant concern for policymakers and investors alike. Despite some moderation from the peaks observed in 2022, inflation rates have not fully aligned with the Federal Reserve's target. Factors contributing to sustained inflation include robust consumer spending, supply chain disruptions, and labor market tightness. The Fed's latest projections suggest that core inflation will decline to 2.5% in 2025, indicating a gradual easing of price pressures.
The potential implementation of new tariffs under the Trump administration could exacerbate inflationary trends. Tariffs on imports may lead to higher prices for goods, thereby increasing production costs and consumer prices. This scenario presents a complex challenge for the Federal Reserve as it seeks to balance economic growth with price stability.
Trump Administration's Economic Policies: Uncertainty and Market Implications
The return of President Donald Trump introduces a new layer of uncertainty to the economic outlook. His administration's policy agenda, including potential trade tariffs and fiscal measures, could have far-reaching effects on both domestic and global economies. For instance, proposed tariffs on imports aim to protect domestic industries but may also lead to retaliatory measures from trading partners, disrupting international trade dynamics.
Additionally, fiscal policies such as tax cuts and increased government spending could stimulate economic growth in the short term but may also contribute to higher inflation and increased federal debt. The interplay between these policies and the Federal Reserve's monetary stance will be critical in determining the trajectory of the economy and financial markets in 2025.
Market Volatility: Investor Sentiment and Strategic Considerations
Given these factors, financial advisors anticipate that the stock market's bull run may persist into 2025, albeit with increased volatility. A survey by InspereX revealed that over two-thirds of advisors expect the S&P 500 to rise by more than 10% in 2025, yet 80% foresee at least one market correction during the year. To mitigate potential risks, many advisors are incorporating downside protection strategies into client portfolios and adjusting asset allocations to favor sectors that may perform well in a volatile environment.
Sectors such as energy, utilities, and healthcare are expected to attract investor interest due to their defensive characteristics and potential for stable returns amid market fluctuations. Conversely, technology stocks, which have driven market gains in recent years, may experience heightened sensitivity to interest rate changes and policy shifts, warranting a more cautious approach.
Conclusion: Navigating Uncertainty with Informed Strategies
The confluence of the Federal Reserve's monetary policy, persistent inflation, and the Trump administration's economic agenda sets the stage for a complex and volatile financial environment in 2025. Investors are advised to stay informed, remain adaptable, and consider diversified investment strategies to navigate the uncertainties ahead. By closely monitoring policy developments and economic indicators, market participants can make informed decisions to safeguard their portfolios and capitalize on emerging opportunities in the evolving financial landscape.

US Investor Sentiment
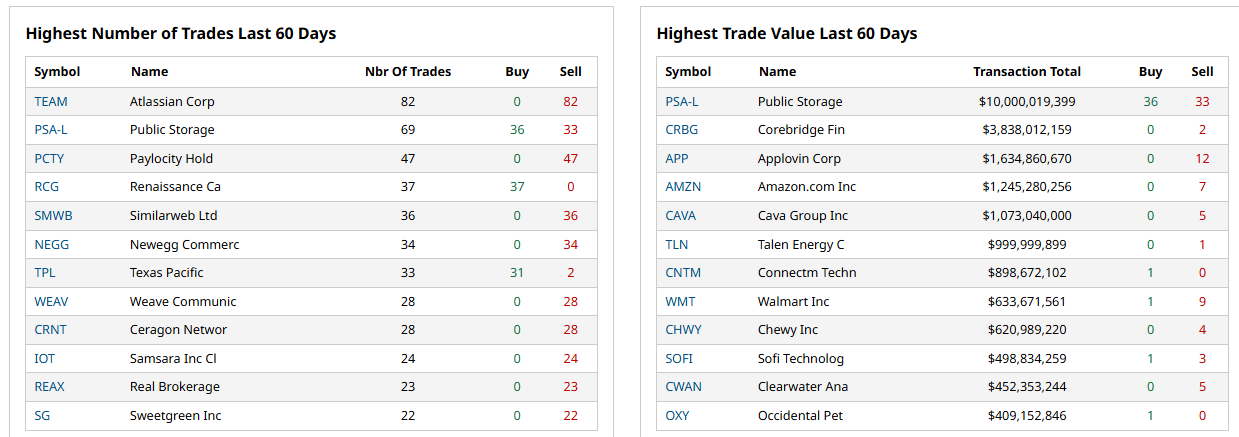
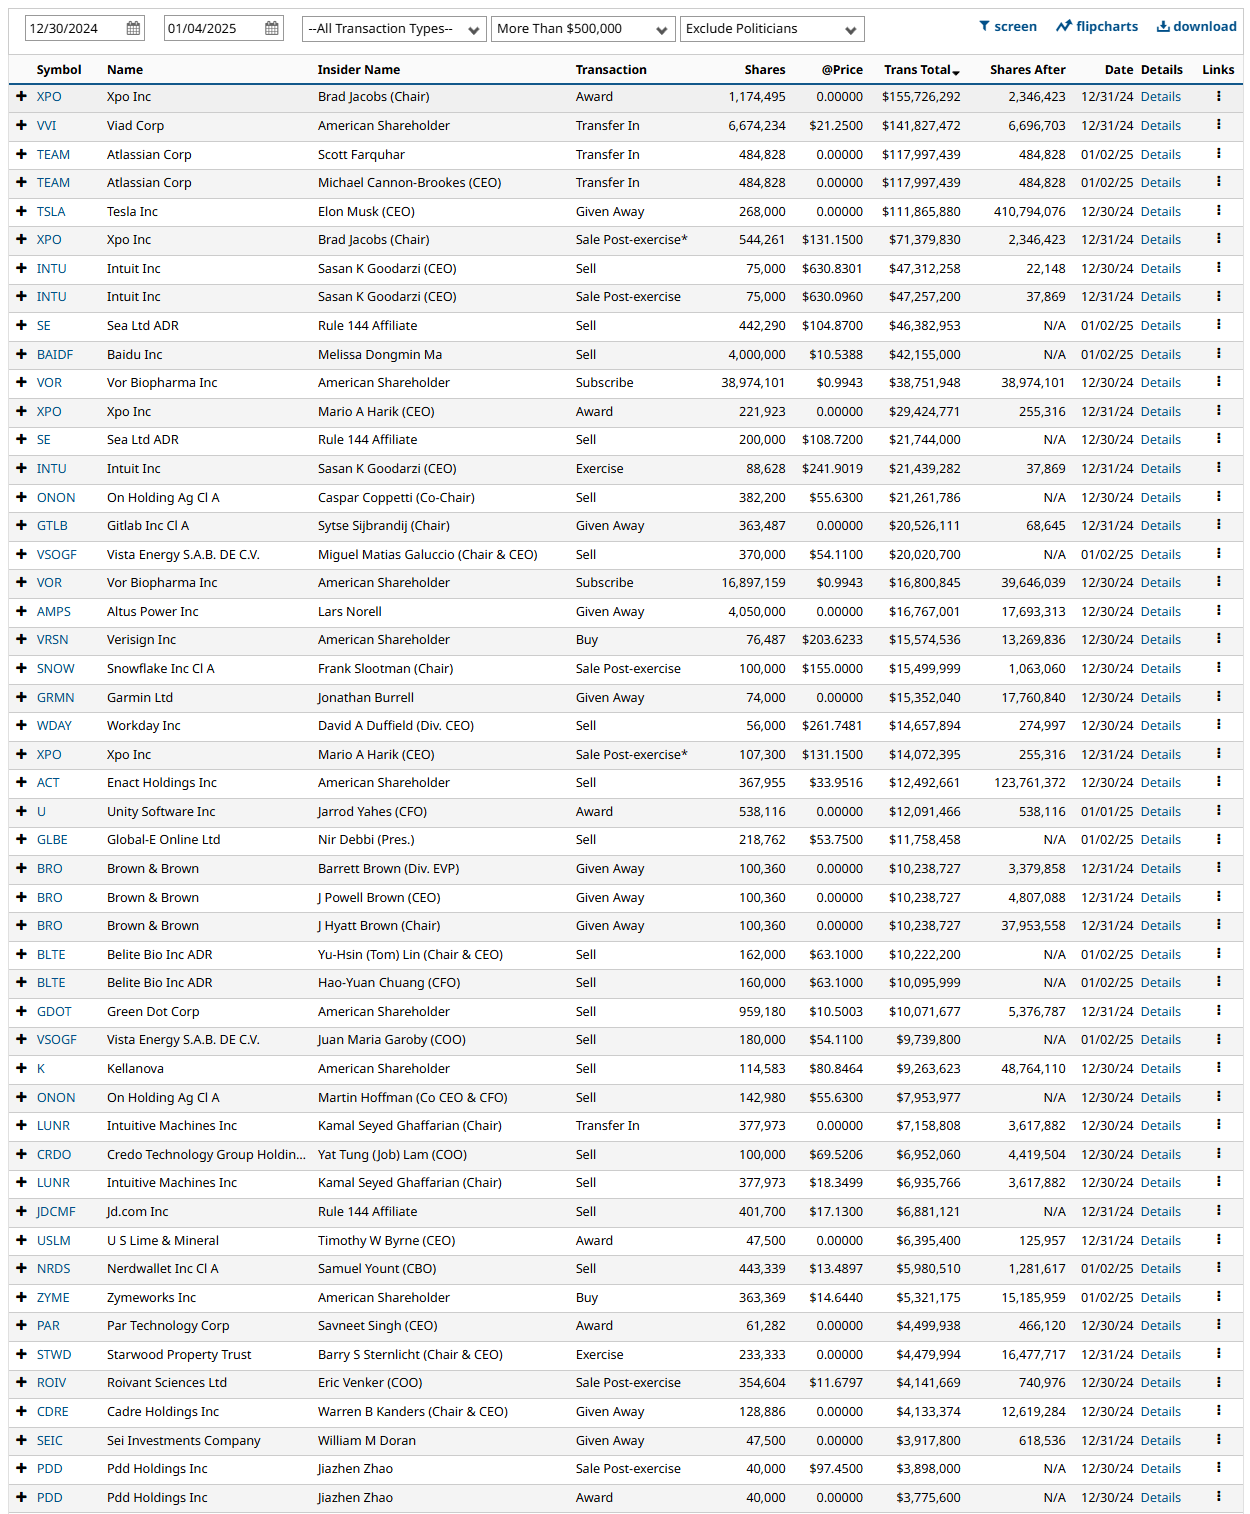
Insider Trading
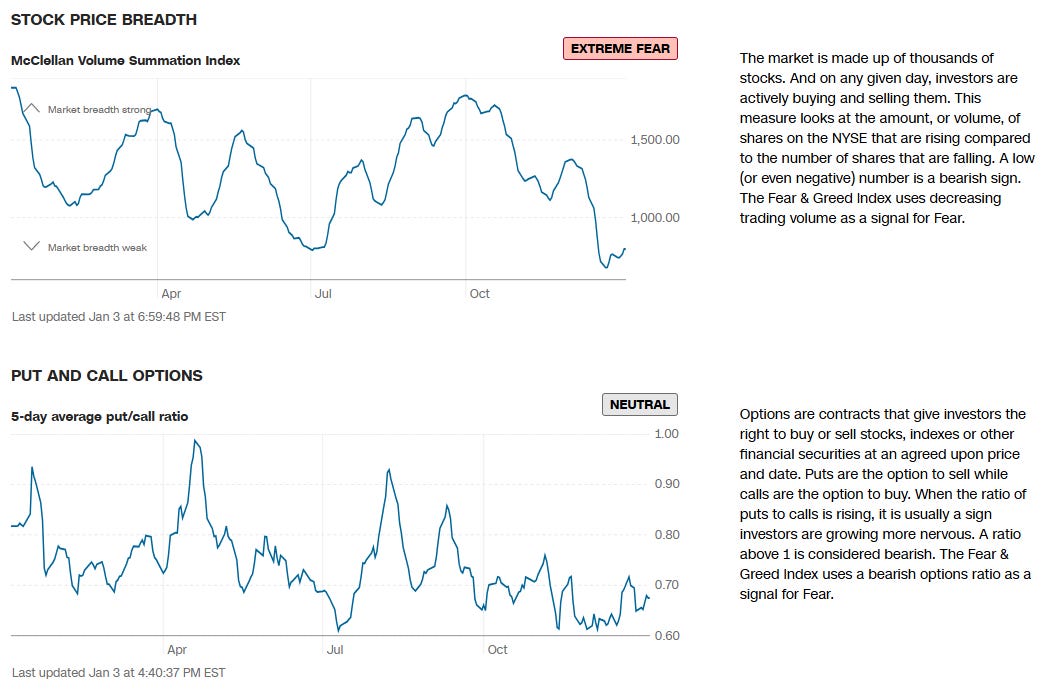
Insider trading occurs when a company’s leaders or major shareholders trade stock based on non-public information. Tracking these trades can reveal insider expectations about the company’s future. For example, large purchases before an earnings report or drug trial results might indicate confidence in upcoming good news.
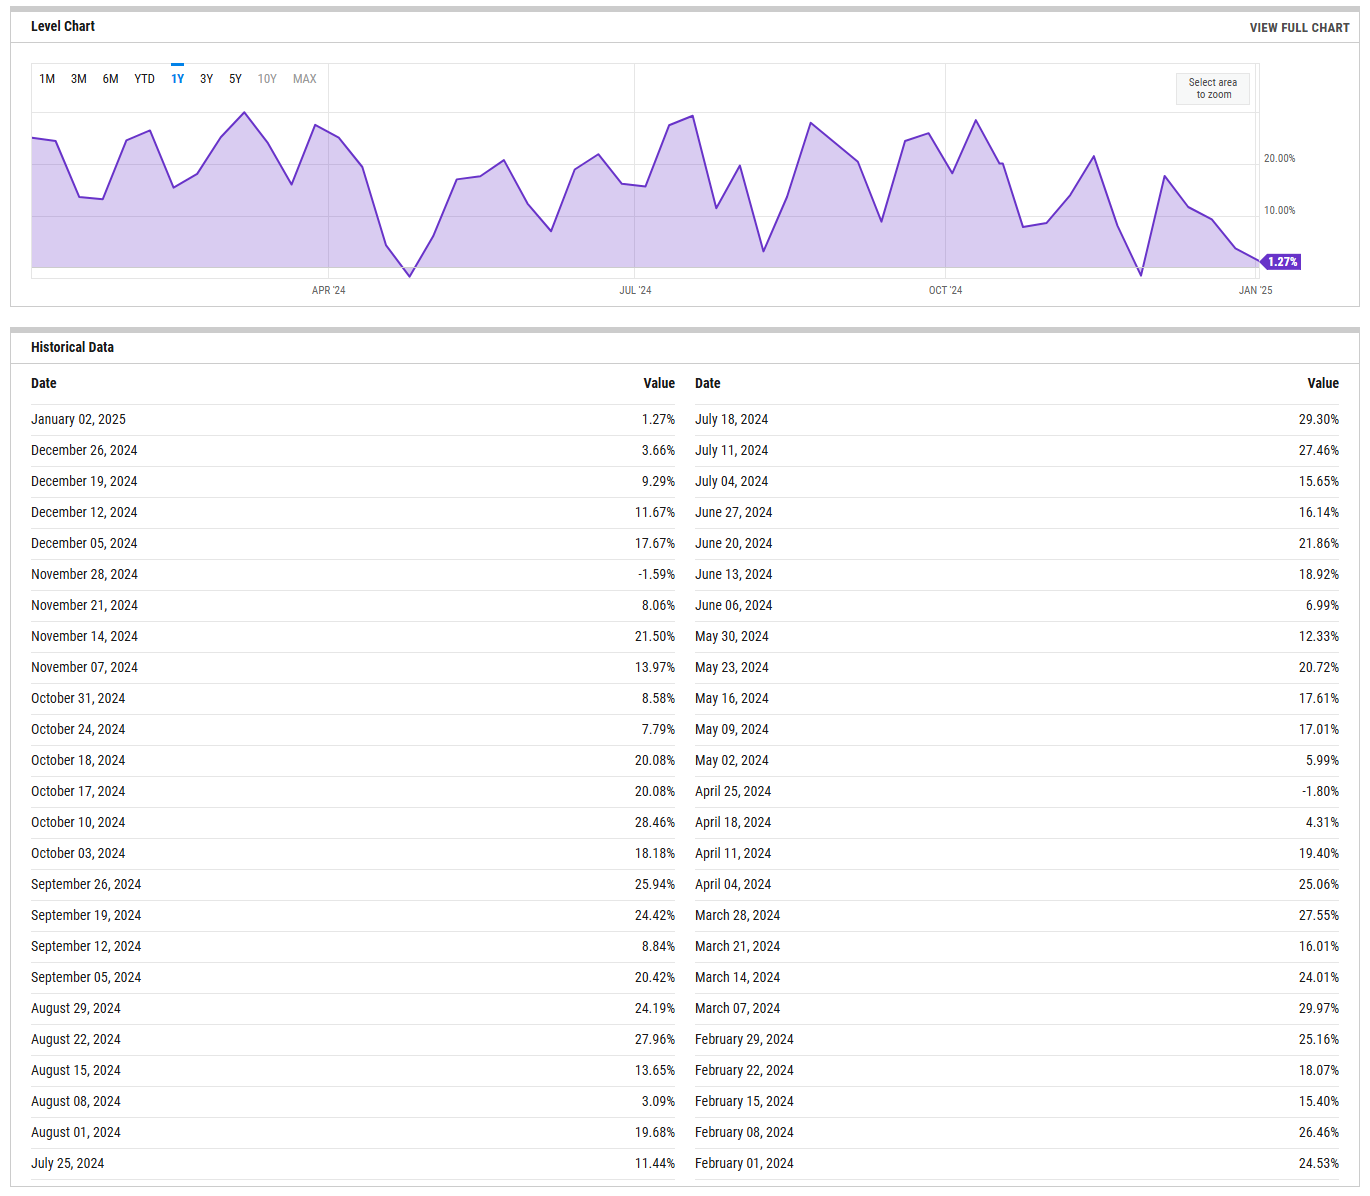
%Bull-Bear Spread
The %Bull-Bear Spread chart is a sentiment indicator that shows the difference between the percentage of bullish and bearish investors, often derived from surveys or sentiment data, such as the AAII (American Association of Individual Investors) sentiment survey. This spread tells investors about the prevailing mood in the market and can provide insights into market extremes and potential turning points.
Bullish or Bearish Sentiment:
When the spread is positive, it means more investors are bullish than bearish, indicating optimism about the market’s direction.
A negative spread indicates more bearish sentiment, meaning more investors expect the market to decline.
Contrarian Indicator:
The %Bull-Bear Spread is often used as a contrarian indicator. For example, extremely high levels of bullish sentiment might suggest that the market is overly optimistic and could be due for a correction.
Similarly, when bearish sentiment is extremely high, it might indicate that the market is overly pessimistic, and a rally could be on the horizon.
Market Extremes and Reversals:
Historically, extreme values of the spread (both positive and negative) can signal turning points in the market. A very high positive spread can signal market exuberance, while a very low or negative spread may indicate fear or capitulation.
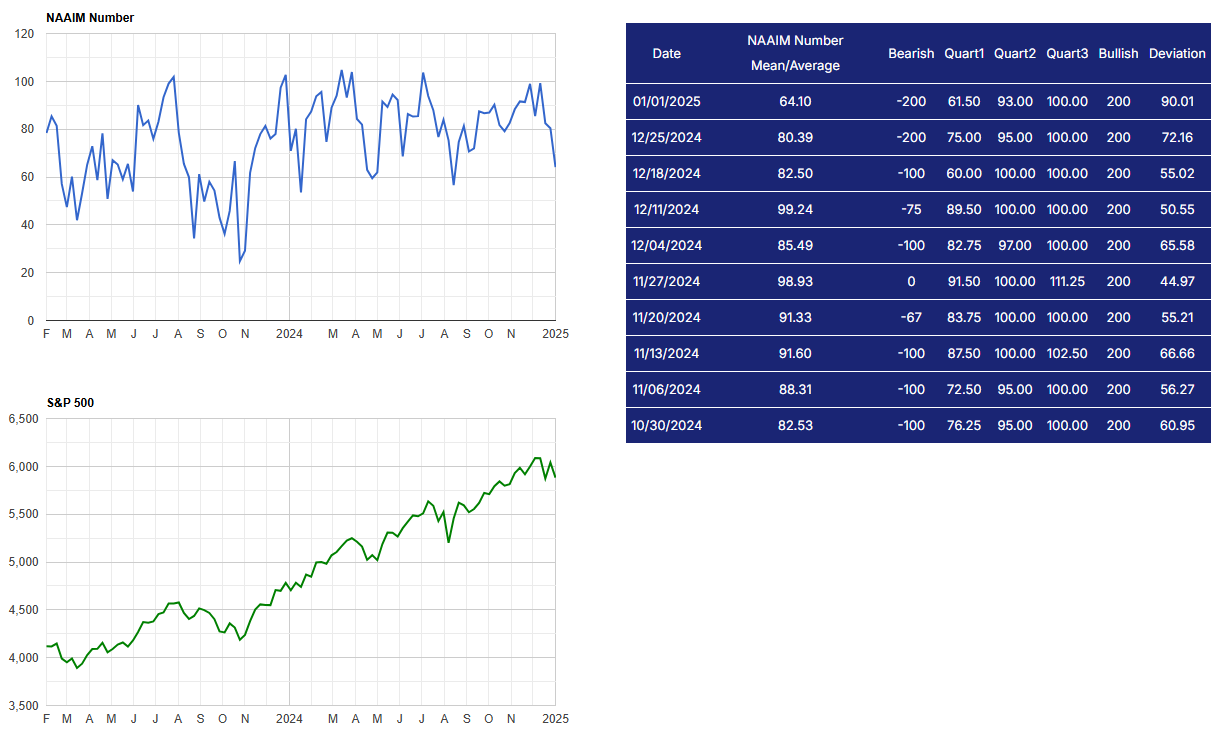
NAAIM Exposure Index
The NAAIM Exposure Index (National Association of Active Investment Managers Exposure Index) measures the average exposure to U.S. equity markets as reported by its member firms. These are typically active money managers who provide their equity exposure levels weekly. The index offers insight into how much these managers are investing in equities at any given time, ranging from being fully short (-100%) to leveraged long (up to +200%).

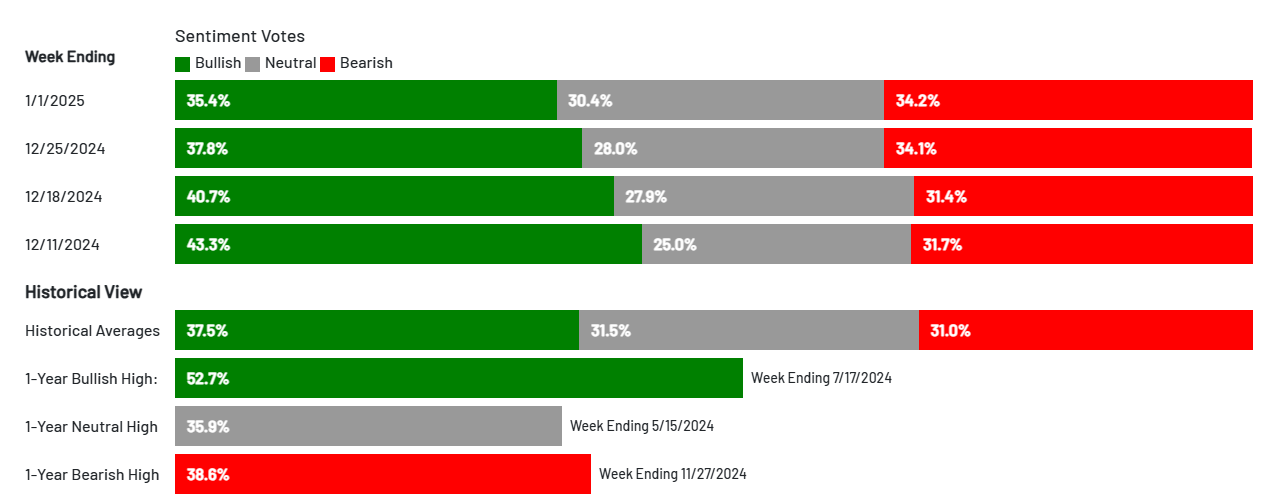
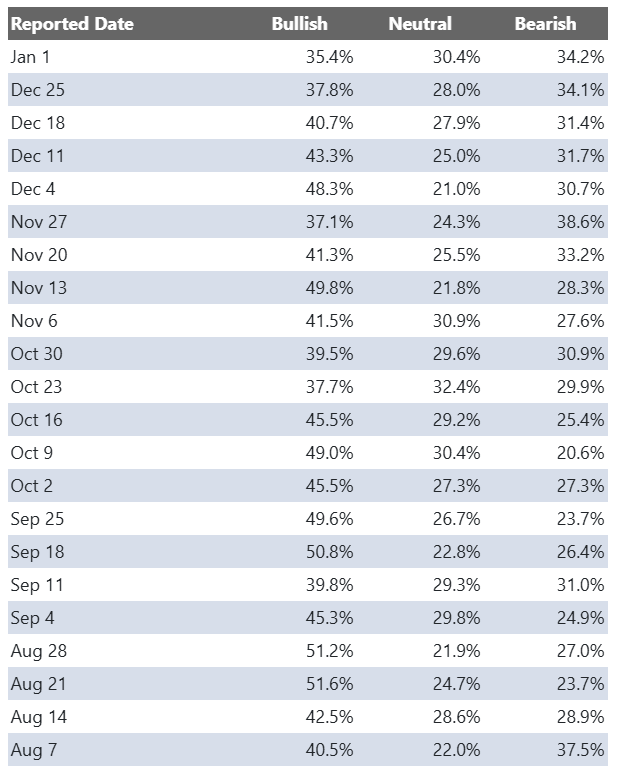
AAII Investor Sentiment Survey
The AAII Investor Sentiment Survey is a weekly survey conducted by the American Association of Individual Investors (AAII) to gauge the mood of individual investors regarding the direction of the stock market over the next six months. It provides insights into whether investors are feeling bullish (expecting the market to rise), bearish (expecting the market to fall), or neutral (expecting the market to stay about the same).
Key Points:
Bullish Sentiment: Reflects the percentage of investors who believe the stock market will rise in the next six months.
Bearish Sentiment: Represents those who expect a decline.
Neutral Sentiment: Reflects investors who anticipate little to no market movement.
The survey is widely followed as a contrarian indicator, meaning that extreme levels of bullishness or bearishness can sometimes signal market turning points. For example, when a large number of investors are overly optimistic (high bullish sentiment), it could suggest a market top, while excessive pessimism (high bearish sentiment) may indicate a market bottom is near.
SPX Put/Call Ratio
The SPX Put/Call Ratio is an indicator that is used to gauge market sentiment. This is calculated as the ratio between trading S&P 500 put options and S&P call options. A high put/call ratio can indicate fear in the markets, while a low ratio indicates confidence. For example, in 2015, the Put-Call ratio was as high as 3.77 because of market fears stemming from various global economic issues like a GDP growth slowdown in China and a Greek debt default.
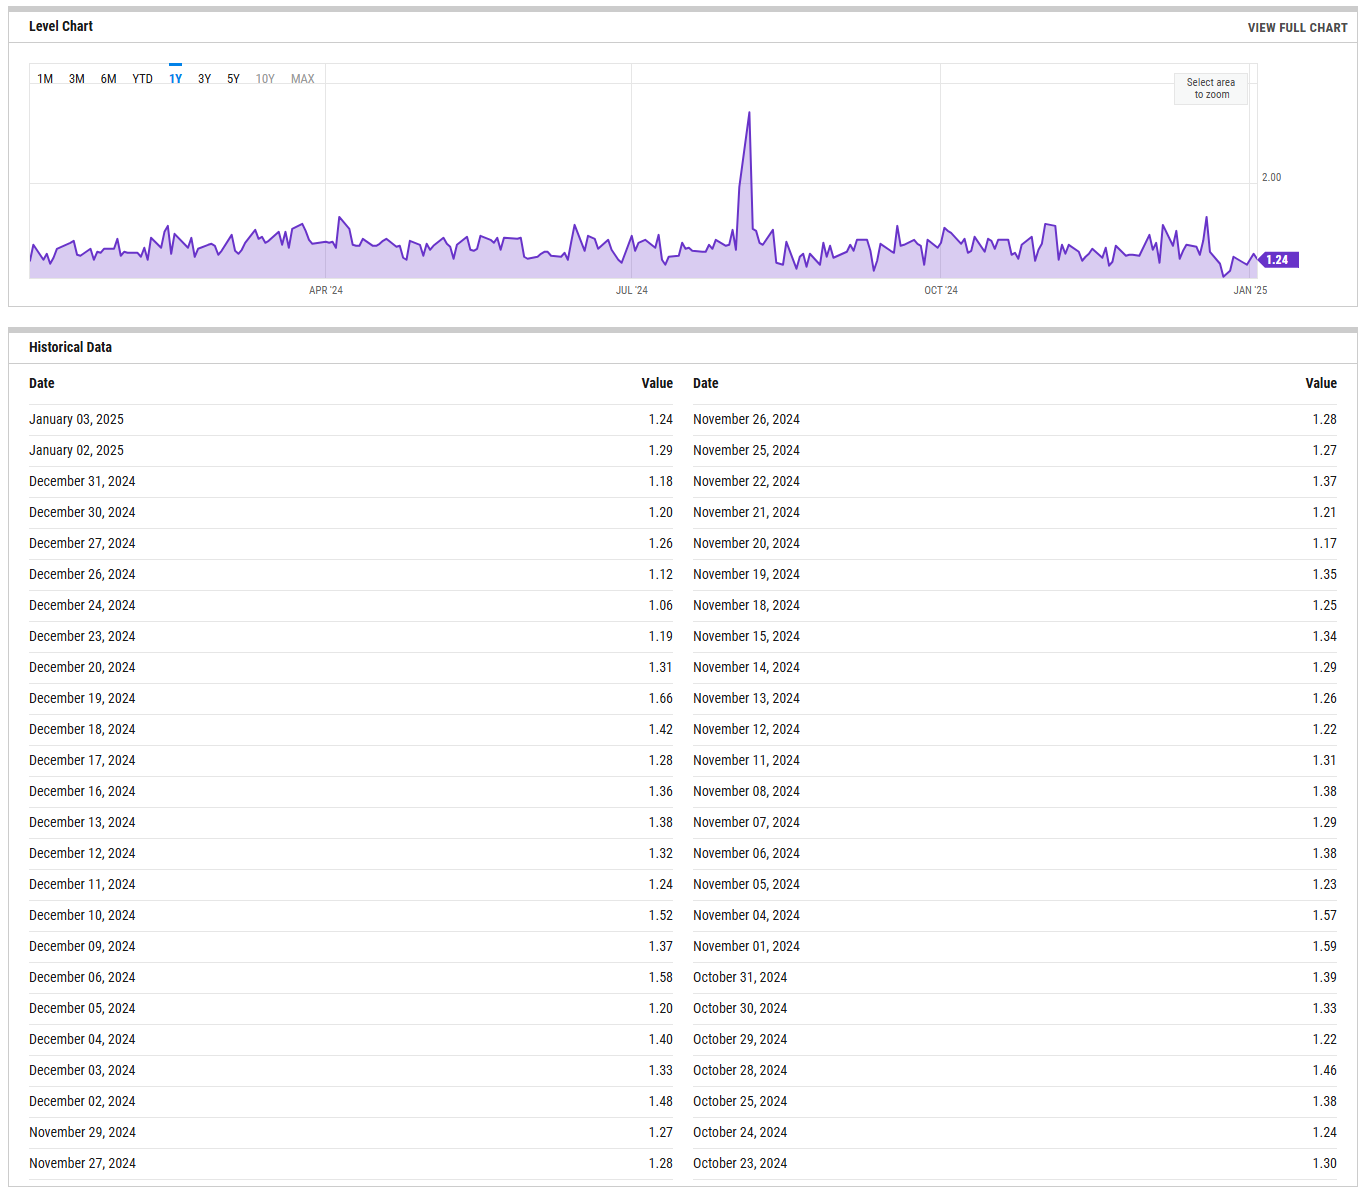
CBOE Equity Put/Call Ratio
The CBOE (Chicago Board Options Exchange) equity put/call ratio is a sentiment indicator used by traders and analysts to gauge market sentiment and potential shifts in investor behavior. It is calculated by dividing the volume of put options by the volume of call options on equities. Here’s what it reveals and how it is generally interpreted:
High Put/Call Ratio: When the put/call ratio is high (above 1.0), it suggests that there is more demand for put options than call options. This typically reflects a more bearish sentiment, as investors may be hedging against potential declines or expecting the market to fall.
Low Put/Call Ratio: Conversely, a low put/call ratio (below 0.7) indicates a higher volume of call options compared to puts, reflecting bullish sentiment. Investors may be expecting upward momentum and are positioning themselves to profit from price gains
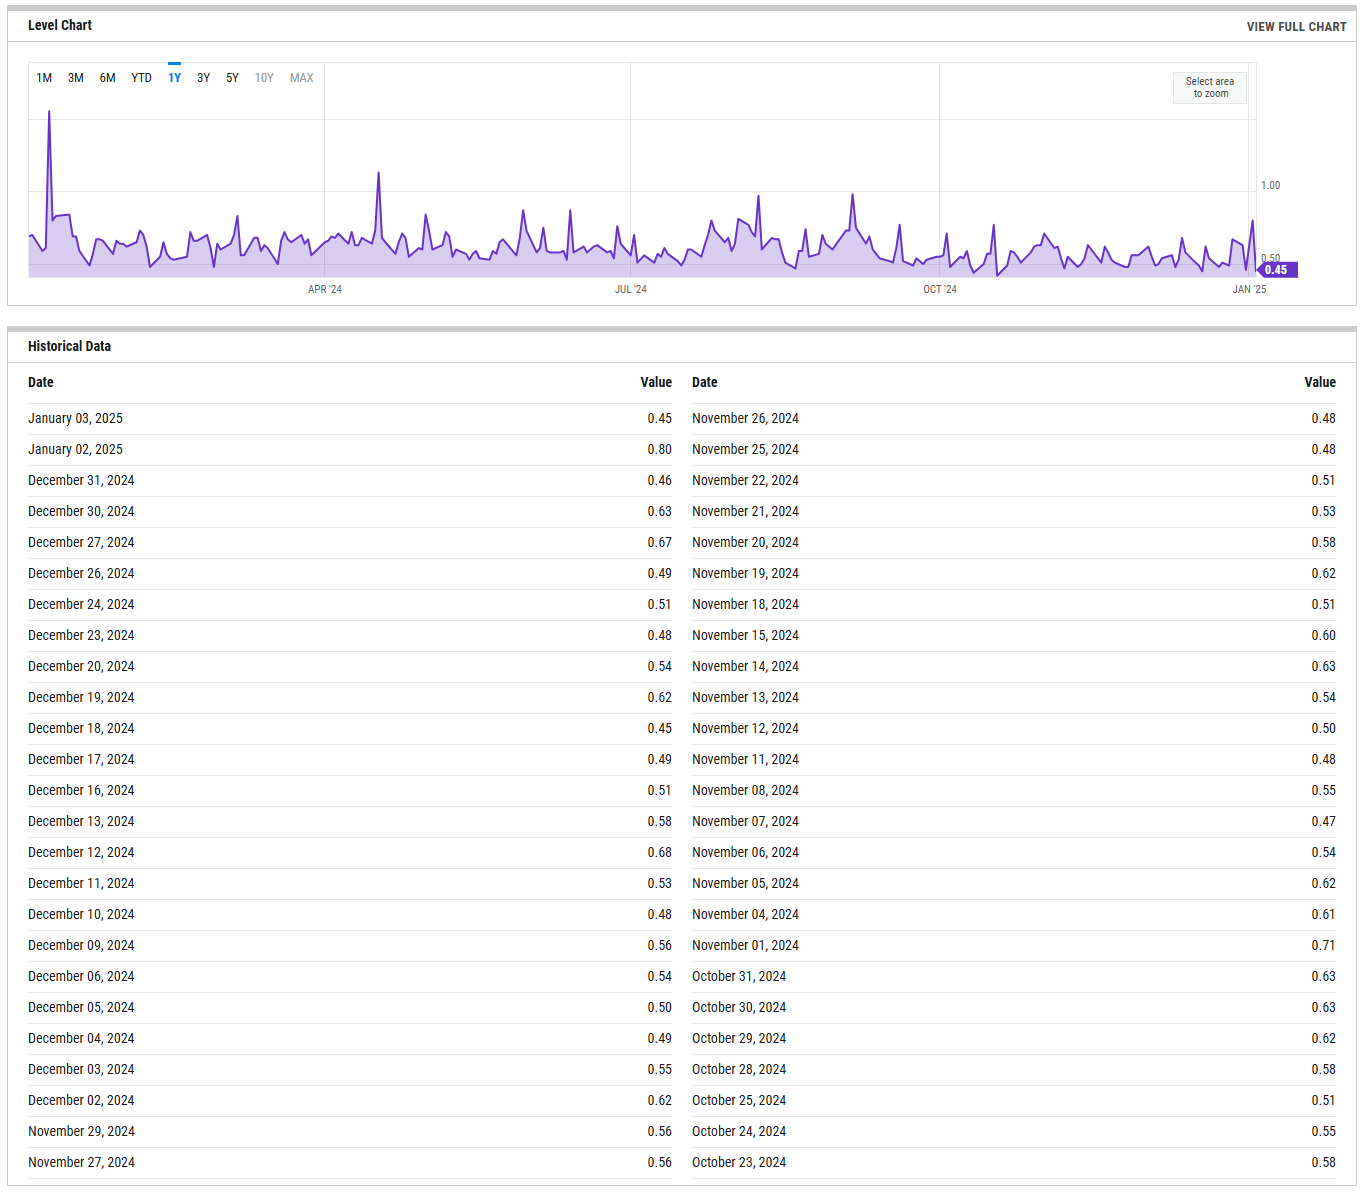
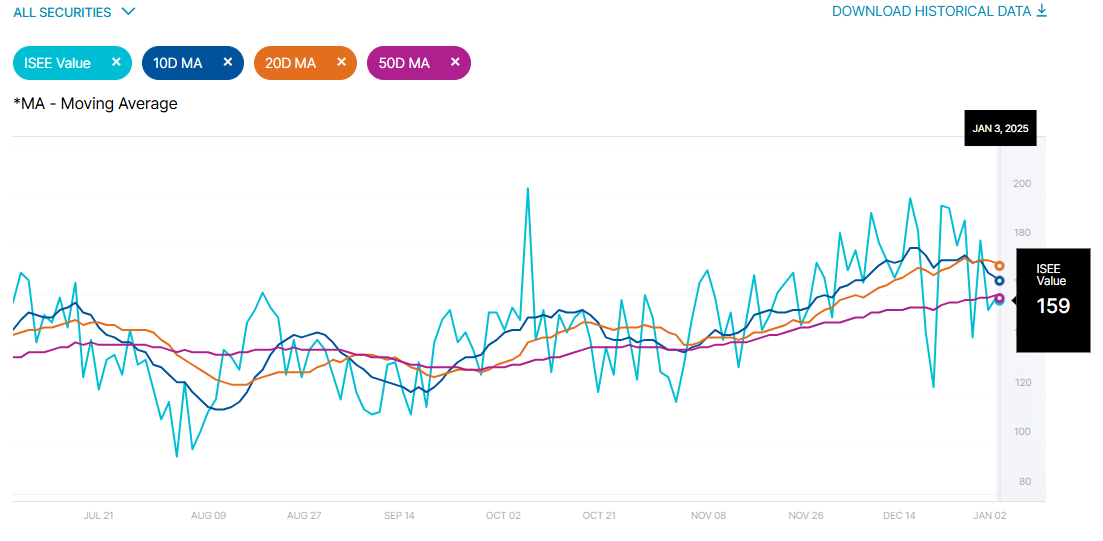
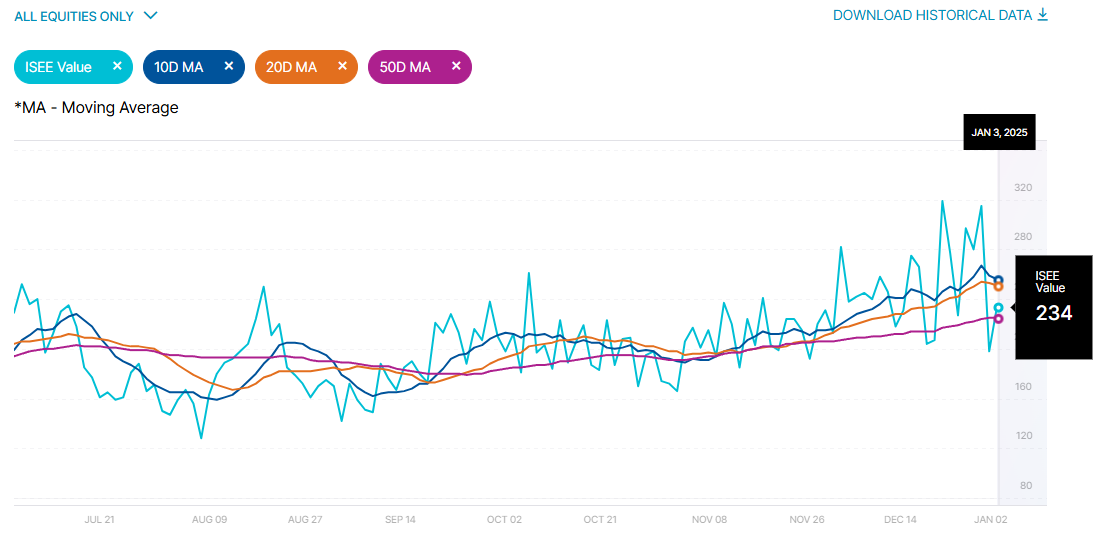
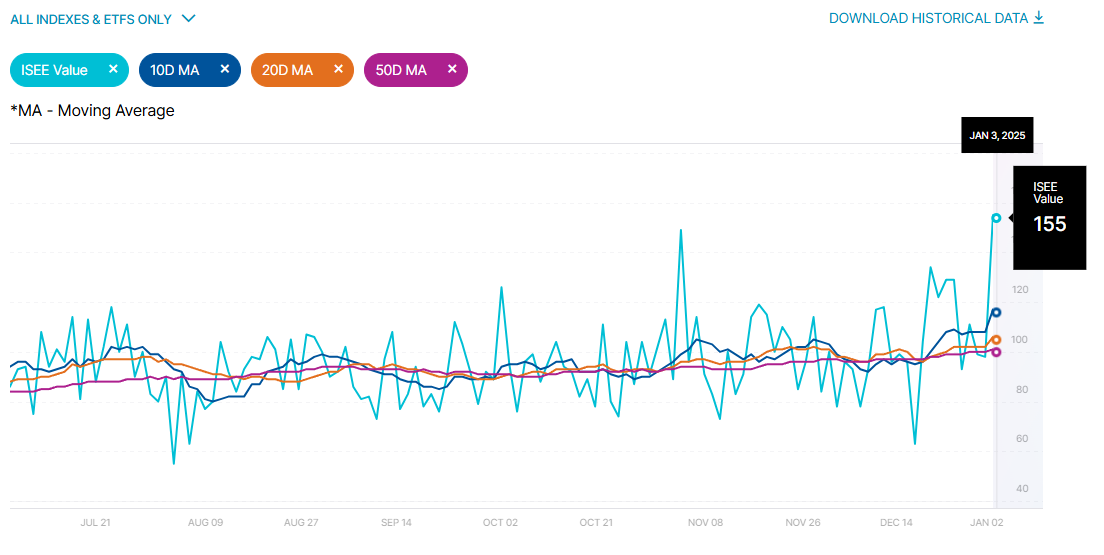
ISEE Sentiment Index
The ISEE (International Securities Exchange Sentiment) Index is a measure of investor sentiment derived from options trading. Unlike traditional put/call ratios, the ISEE Index focuses only on opening long customer transactions and is adjusted to remove market-maker and firm trades, providing a purer sentiment reading.
The ISEE Index typically ranges from 0 to 200, with readings above 100 indicating more call options being bought relative to put options, suggesting bullish sentiment. Conversely, readings below 100 suggest bearish sentiment, with more puts being purchased relative to calls.
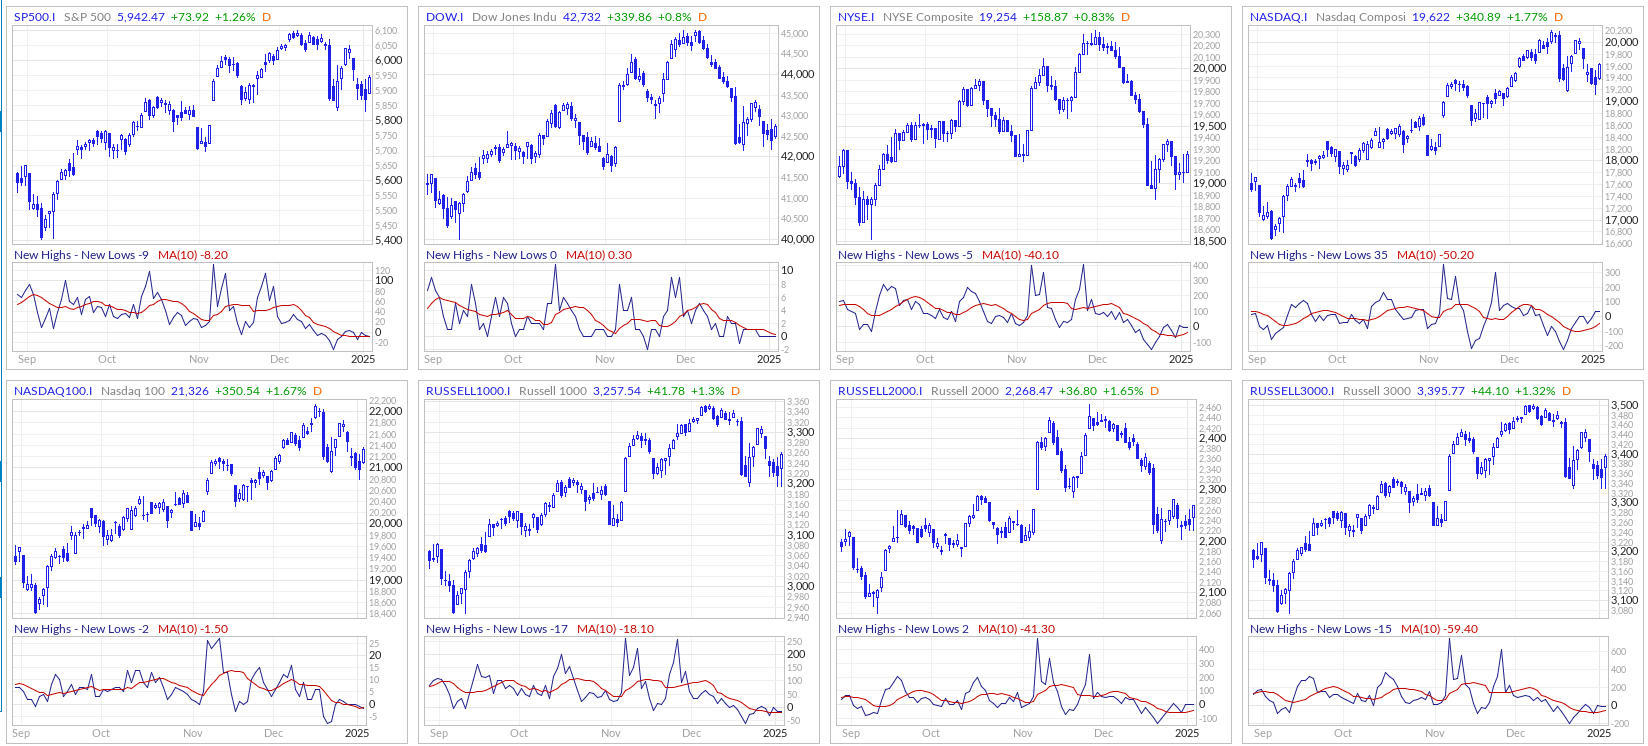
New Highs - New Lows
The New Highs - New Lows indicator (NH-NL) displays the daily difference between the number of stocks reaching new 52-week highs and the number of stocks reaching new 52-week lows. The NH-NL indicator generally reaches its extreme lows slightly before a major market bottom. As the market then turns up from the major bottom, the indicator jumps up rapidly. During this period, many new stocks are making new highs because it's easy to make a new high when prices have been depressed for a long time. The NH-NL indicator oscillates around zero. If the indicator is positive, the bulls are in control. If it is negative, the bears are in control. As the cycle matures, a divergence often occurs as fewer and fewer stocks are making new highs (the indicator falls), yet the market indices continue to reach new highs. This is a classic bearish divergence that indicates that the current upward trend is weak and may reverse.
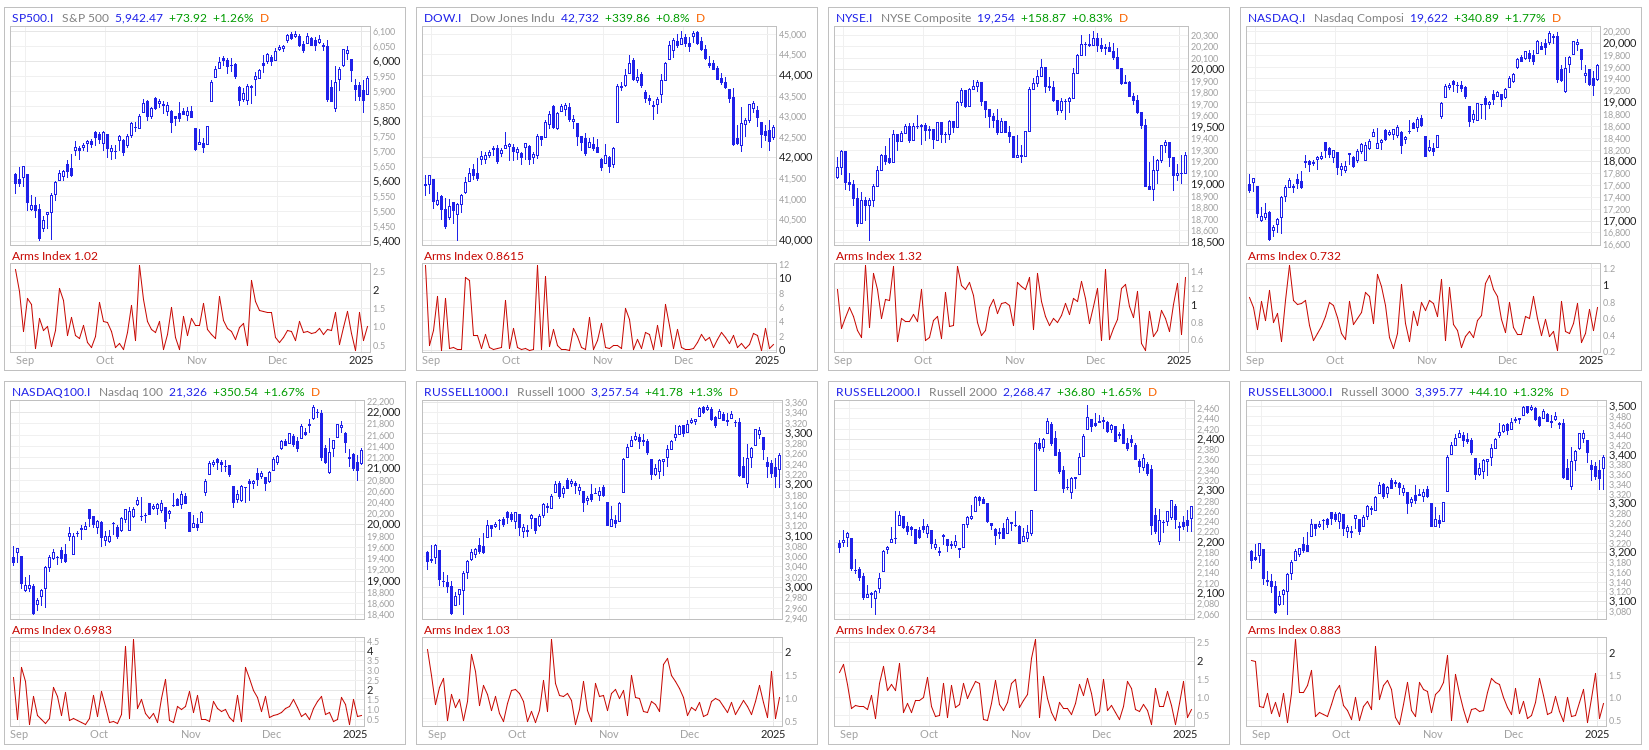
ARMS Index
The Arms Index, also known as the TRIN (Short-Term TRading INdex), was developed by Richard Arms in the 1960s. It is calculated by dividing the ratio of advancing stocks to declining stocks by the ratio of advancing volume to declining volume. Interpreting the Arms Index involves looking at its value in relation to certain thresholds. A value below "1" is considered bullish, indicating that advancing stocks and volume dominate the market. Conversely, a value above "1" is considered bearish, suggesting that declining stocks and volume are more prevalent. Extremely low values (below 0.5) or high values (above 2) are often seen as potential reversal signals.
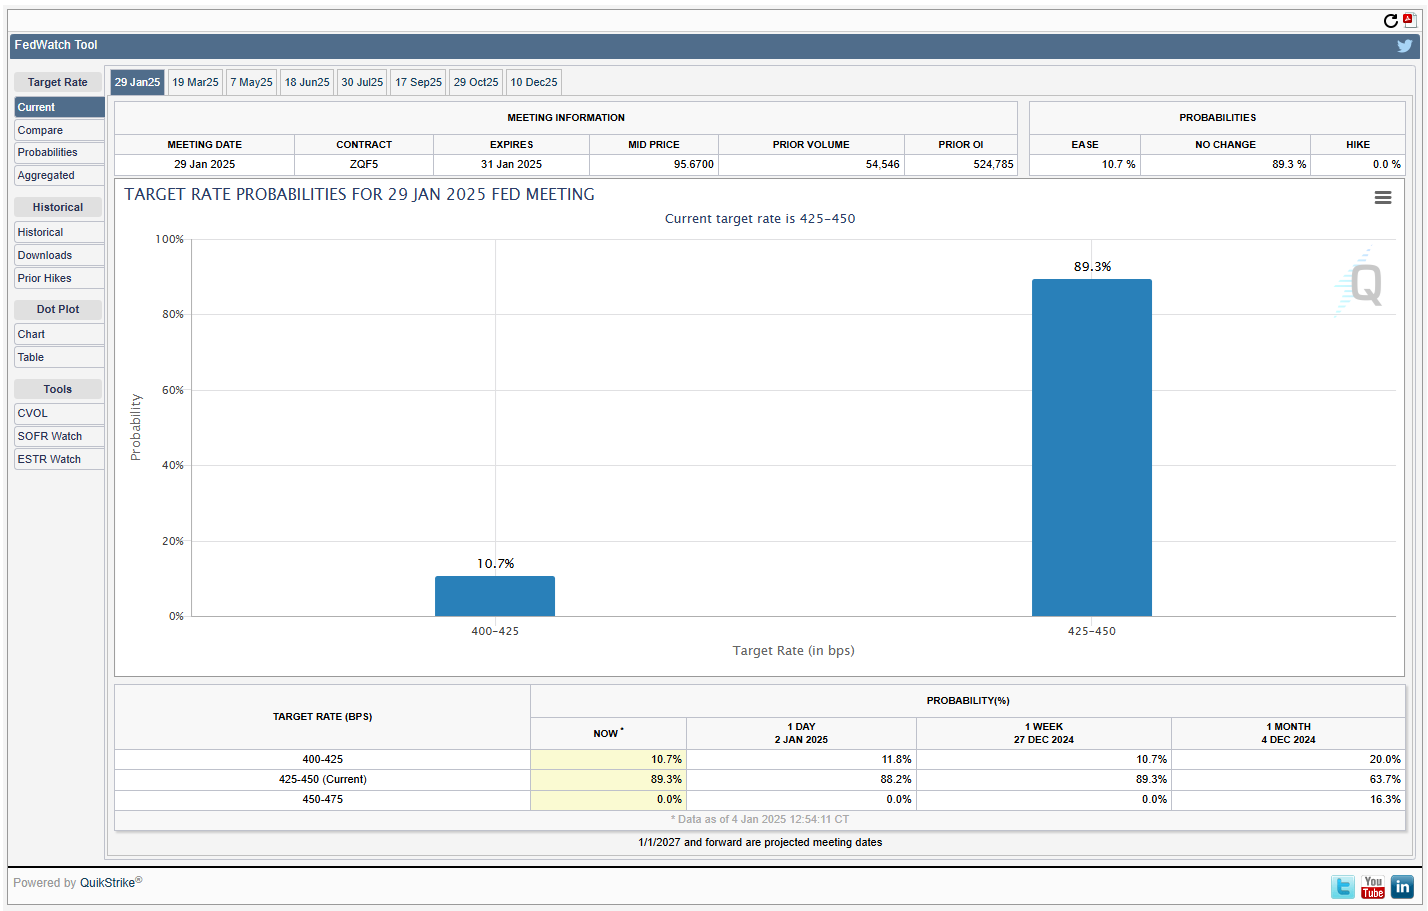
CME Fedwatch
What is the likelihood that the Fed will change the Federal target rate at upcoming FOMC meetings, according to interest rate traders? Use CME FedWatch to track the probabilities of changes to the Fed rate, as implied by 30-Day Fed Funds futures prices.
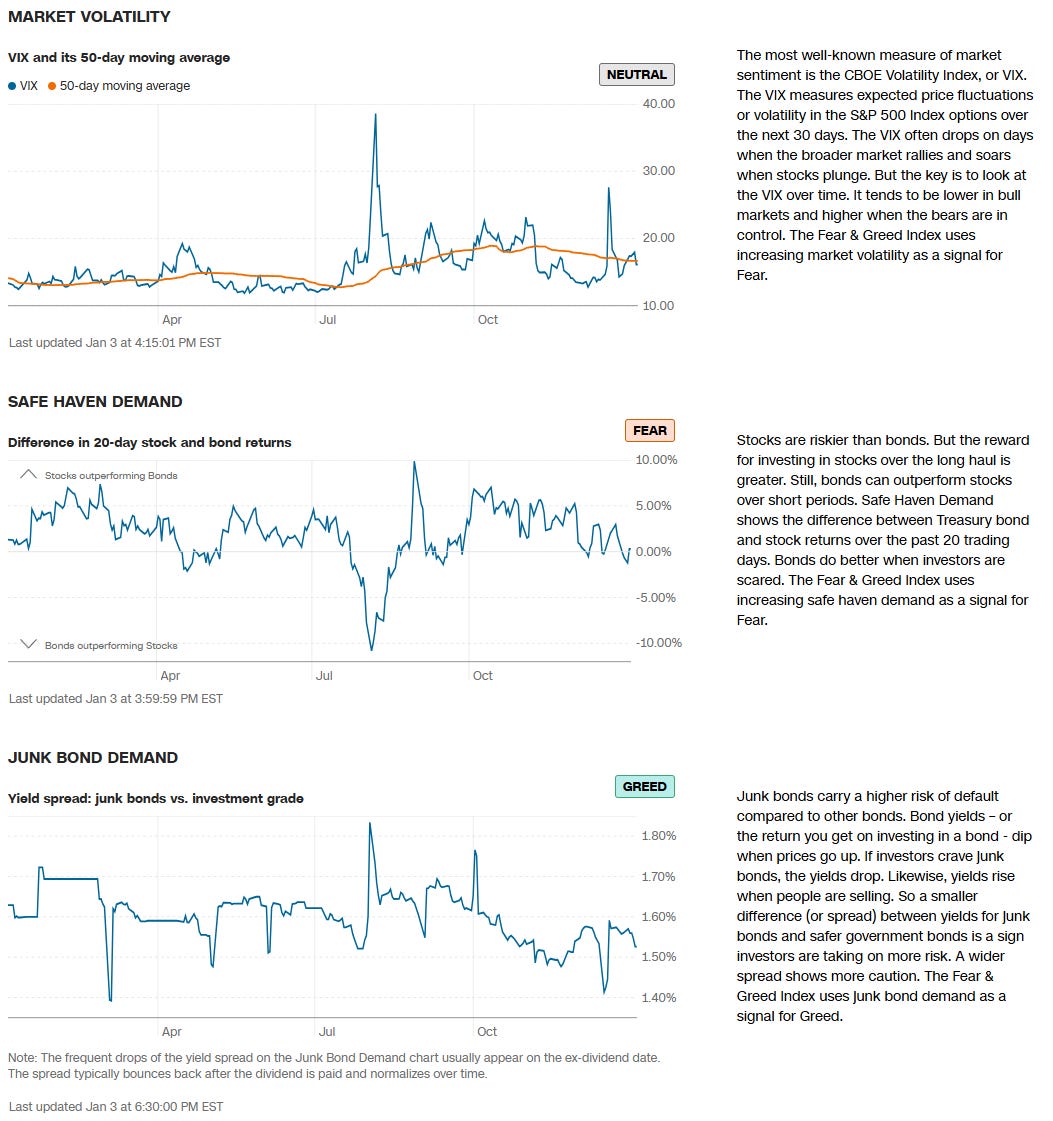
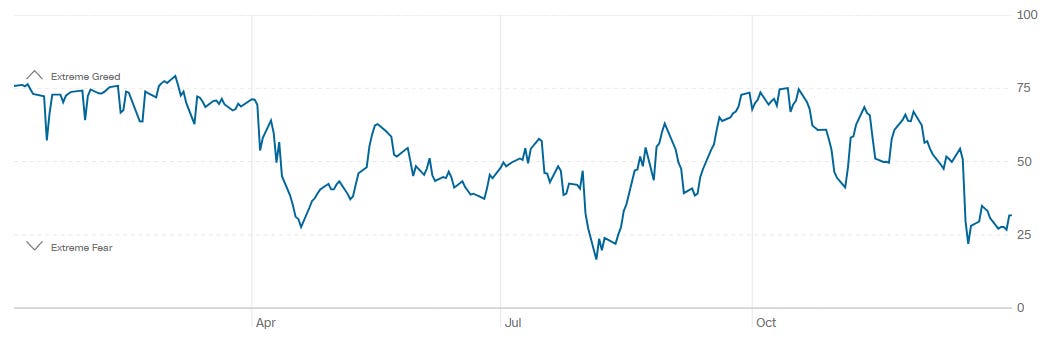
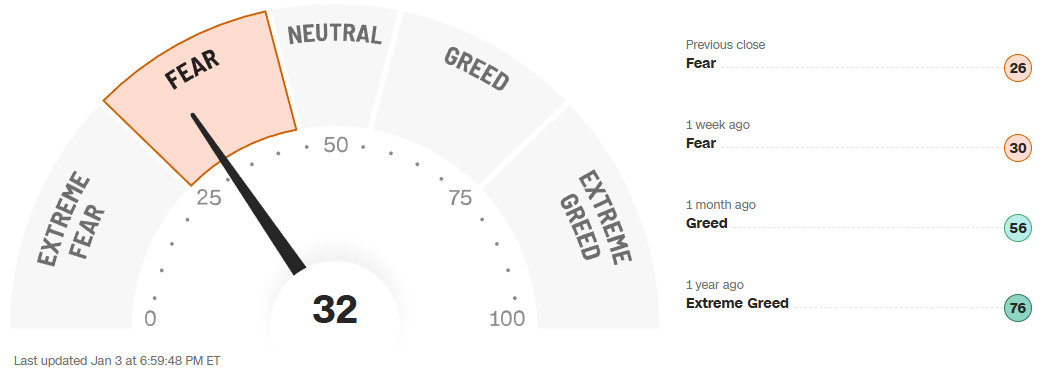
CNN Fear & Greed Constituent Data Points & Composite Index
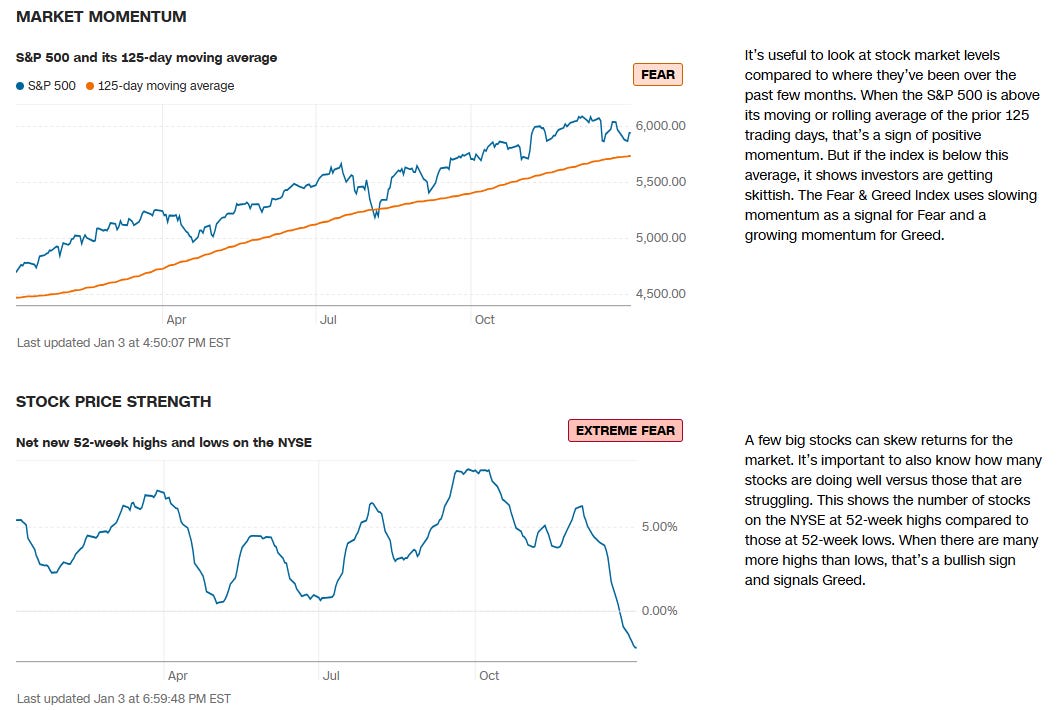
Final Composite Fear & Greed Index Reading
Institutional S/R Levels for Major Indices
When you’re a large institutional player, your primary goal is to find liquidity - places to do a ton of business with the least amount of slippage possible. VolumeLeaders.com automatically identifies and visually plots the exact spots where institutions are doing business and where they are likely to return for more. It’s one of the primary reasons “support” and “resistance” concepts work and truly one of the reasons “price has memory”.
Levels from the VolumeLeaders.com platform can help you formulate trades theses about:
Where to add or take profit
Where to de-risk or hedge
What strikes to target for options
Where to expect support or resistance
And this is just a small sample; there are countless ways to leverage this information into trades that express your views on the market. The platform covers thousands of tickers on multiple timeframes to accommodate all types of traders. Observe for yourself how accurate the levels are by marking-up your charts with the information in the “Trade Levels” boxes and play-along in real-time this week.
SPY 0.01%↑
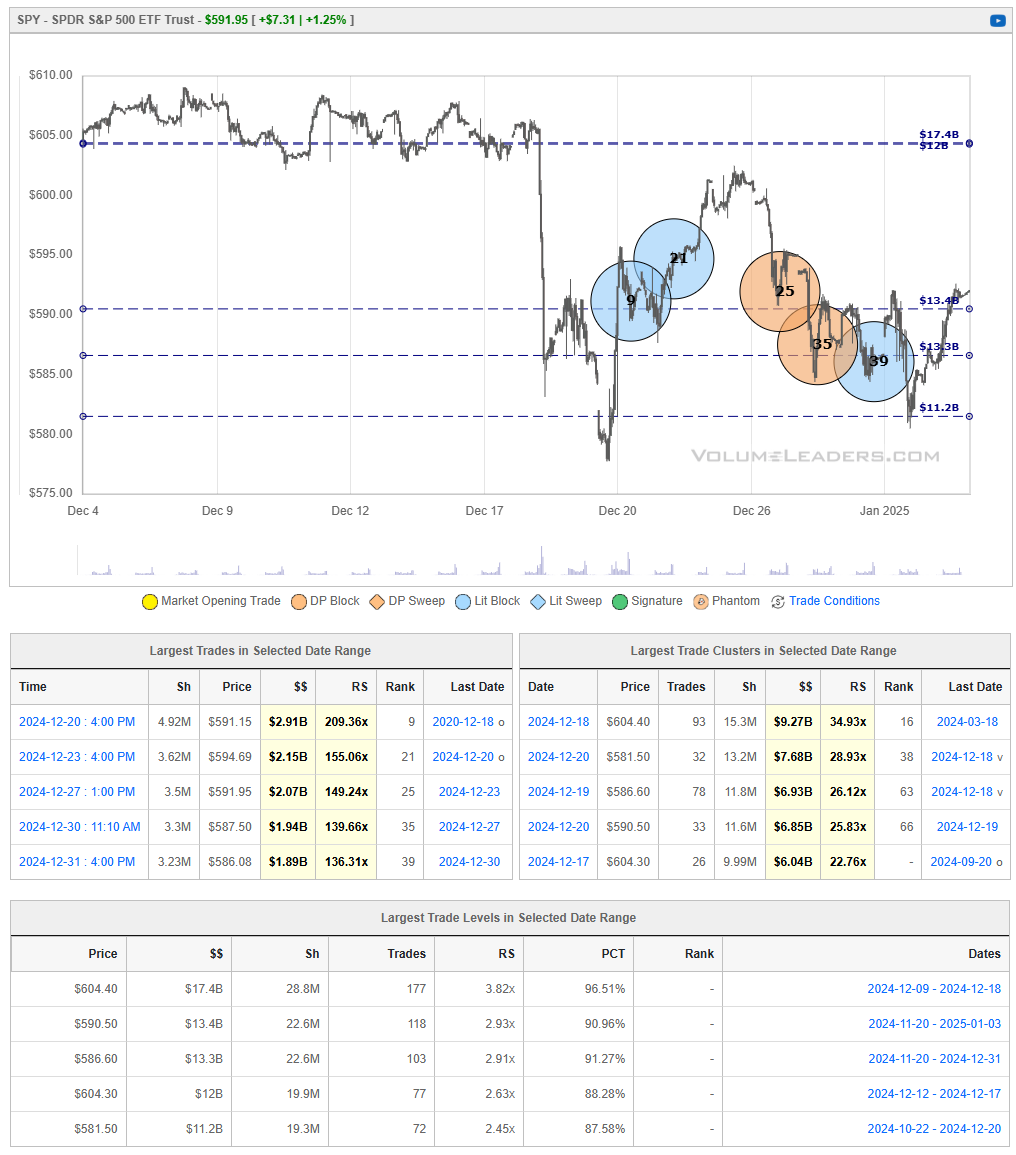
SPY continues to oscillate within a volume‐dense zone after December’s sharp drop from the $605 region down to near $575. Following that sell‐off, the ETF rebounded strongly off the $580–$585 area, where significant institutional trades appear to have provided support. It has since tested overhead supply in the $590–$595 zone but remains stuck below the larger resistance band near $600.
A convincing break above $595–$600 would indicate that buyers have absorbed enough supply to push the market higher, potentially reversing the December downtrend. Conversely, a failure to clear that ceiling—or a drop back below the $585 level—raises the risk of returning toward last month’s lows. Essentially, SPY is consolidating between two major volume‐based areas, and whichever side is broken first is likely to define the short‐term trend.
QQQ -0.00%↓
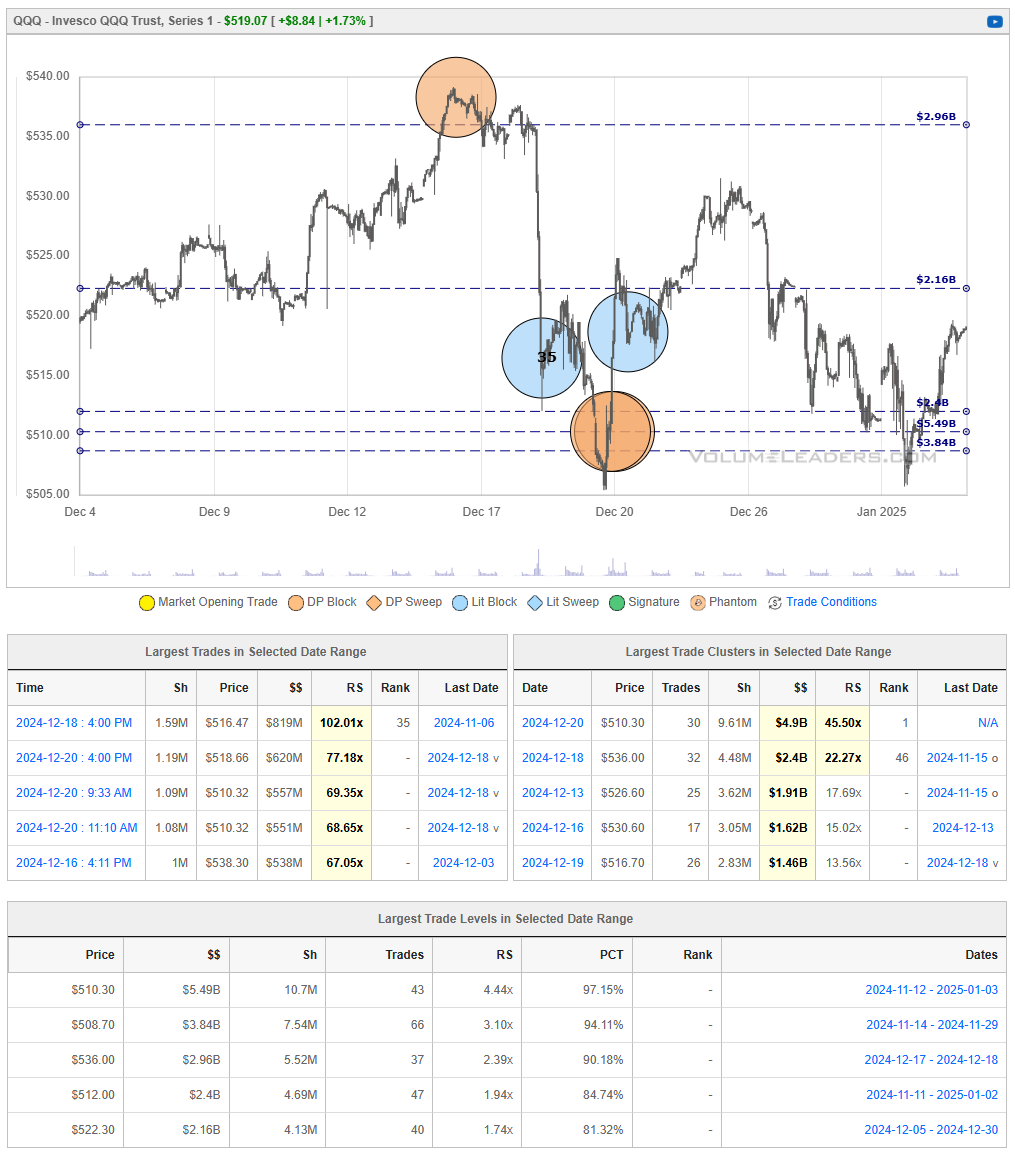
QQQ staged a steep drop in mid‐December from the $535–$540 area down toward $505 before stabilizing around the $510 region, where sizable institutional trades provided a short‐term floor. The subsequent rebound now has the ETF testing near $520, but it remains under key resistance in the $525–$530 band, where previous heavy trading could still harbor considerable supply.
If QQQ can push convincingly above $525–$530, it would suggest that buyers have absorbed the December sell‐off and are ready to reclaim higher ground. However, a failure to overcome this overhead cluster—or a drop back below the recent support shelf near $510—would raise the odds of a retest of the December lows. In short, QQQ is at an inflection point: clearing these volume‐based ceilings signals a potential bullish reversal, while rejection at resistance leaves the door open for renewed selling pressure.
IWM 0.00%↑
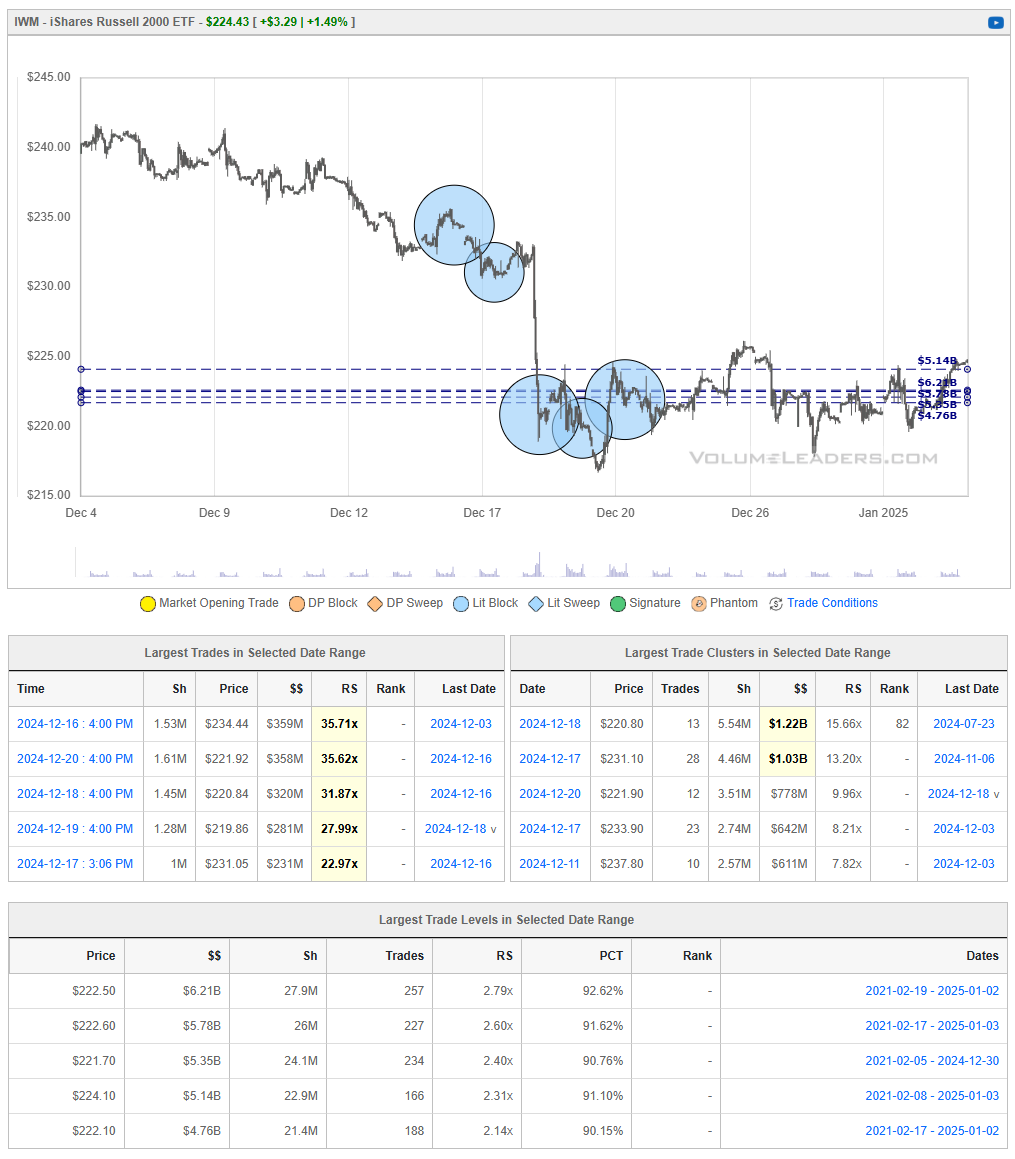
IWM tumbled sharply in mid‐December from around the mid‐$230s down into the low‐$220s, where it found support on elevated volume. Multiple large trades near $220–$222 helped stabilize price and formed a short‐term base. Since then, the ETF has been grinding higher but still faces overhead supply in the $224–$227 region—an area that may cap further advances unless buyers can absorb lingering sell orders.
A decisive push above that $224–$227 band would signal renewed bullish momentum and could open the door to a more meaningful recovery. Conversely, failure to break through this ceiling, combined with any slip back below the $220–$222 support zone, would raise the odds of retesting December’s lows. The ETF is thus caught between a known floor of institutional accumulation and a likely layer of resistance—a classic inflection point where the next breakout or breakdown should help clarify the short‐term trend.
DIA 0.00%↑
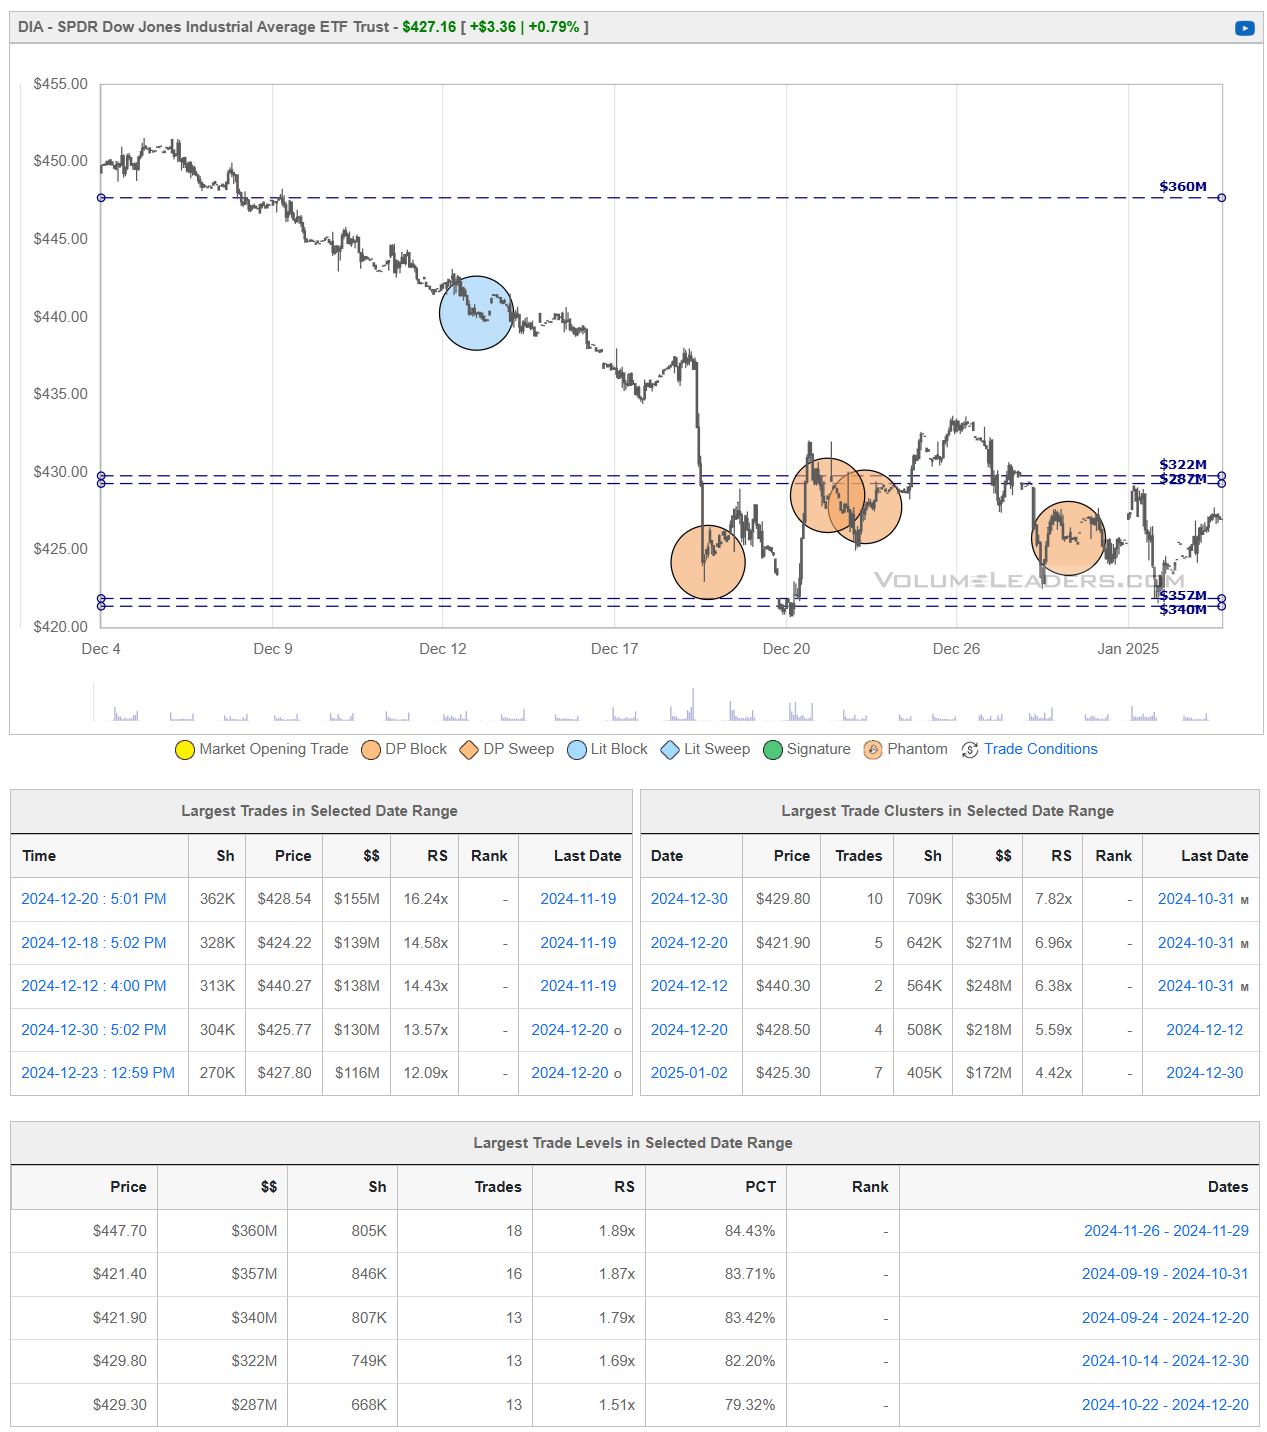
DIA has been attempting to stabilize after its December slide took price down near the $420 area, where strong institutional activity helped form a tentative floor. A subsequent bounce has now propelled the ETF back toward $427–$430, but it still faces layers of overhead supply in the low‐to‐mid‐$430s, where past high‐volume trading may cap further upside.
If DIA can break above that $430–$435 region on convincing volume, it would suggest that buyers have absorbed lingering sell orders and could fuel a more sustained recovery. On the other hand, a rejection at resistance—particularly if price slips back under the $420–$425 band—would keep the broader downtrend intact and raise the likelihood of retesting December’s lows.
Institutional Order Flow
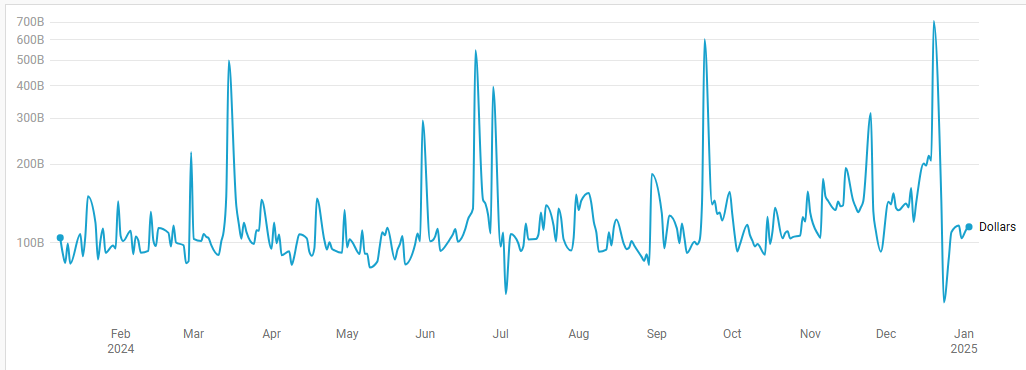
Rolling 1-Yr Dollars By Day
This chart shows institutional activity by dollars by day on a rolling 1-year basis. From a theoretical standpoint, examining a chart of daily institutional dollar activity over the course of a year can offer several insights and possible inferences, though all should be approached with caution since the data alone may not prove causality or confirm underlying reasons. Some potential takeaways include:
Event-Driven Behavior:
Sharp, singular spikes on certain days might correlate with major market-moving events. These could include central bank policy announcements, significant geopolitical news, sudden macroeconomic data releases (like employment reports or GDP data), earnings seasons for large-cap companies, or unexpected shocks (e.g., mergers, acquisitions, regulatory changes).Liquidity Dynamics:
Institutions often concentrate large trades on days with higher expected liquidity. For instance, heightened activity might coincide with index reconstitutions, option expiration dates, or the days leading up to or following a major index rebalance, when large amounts of capital shift hands simultaneously.Risk Management and Hedging Activity:
Institutions may significantly adjust their exposures on days that are critical from a risk management perspective. Large spikes can occur if hedge funds, pension funds, or asset managers are rolling over futures contracts, initiating or closing out large hedges, or reacting to volatility triggers.Market Sentiment Indicators:
While the data is purely transactional, the sheer volume of institutional involvement on certain days might indirectly hint at changing sentiment or strategic shifts.
In essence, a chart like this can lead you to hypothesize that institutional trading volumes are not constant or random but rather influenced by a mix of predictable calendar effects, major market events, liquidity considerations, risk management decisions, and strategic allocation shifts.
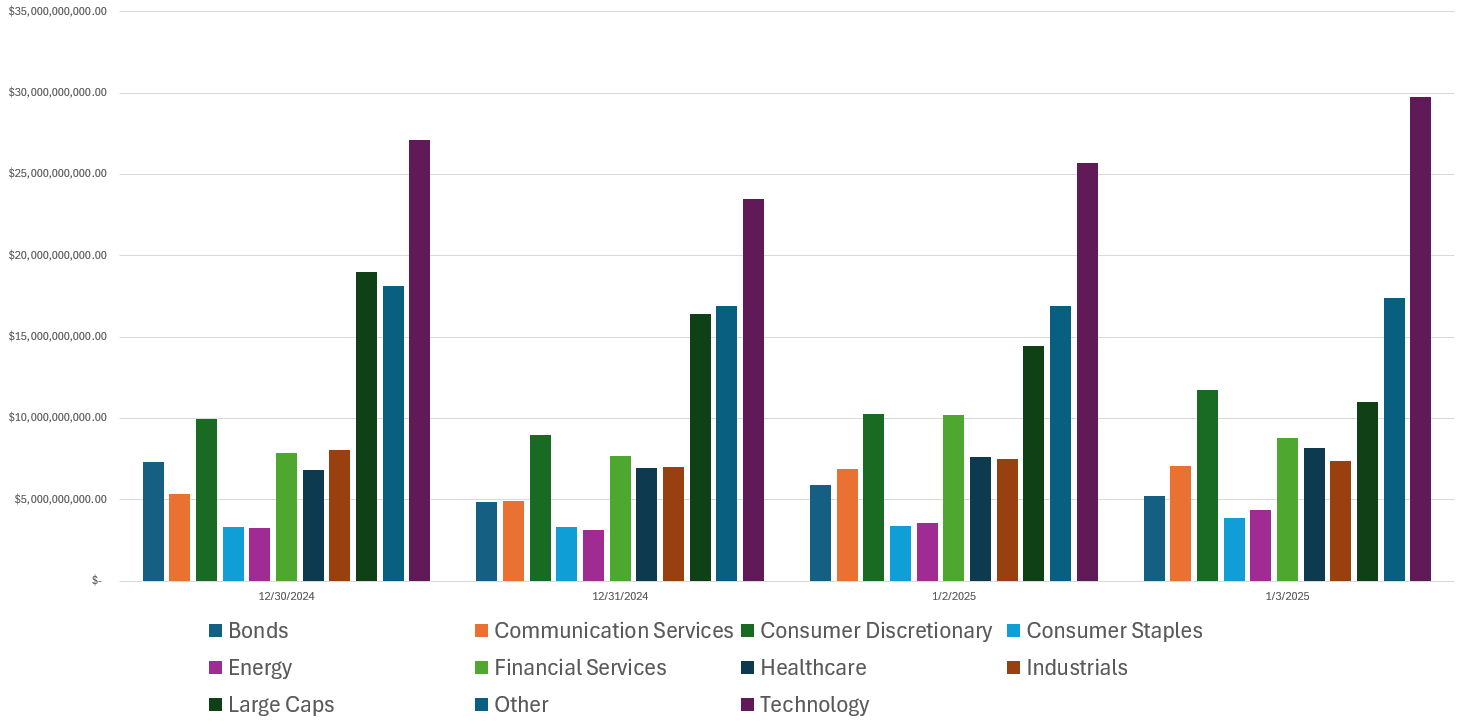
Last Week’s Institutional Activity By Sector
This is an incredibly important chart to watch as it contains lots of nuanced suggestions at a thematic level. Watch this chart closely week-to-week to stay informed about where institutional money is flowing, adjust your strategies based on momentum, align your portfolio with macroeconomic and market trends, and manage risks more effectively by avoiding sectors losing institutional favor. The Top 10 active sectors are identified and the rest grouped as “Other”.
Sector Rotation Insights: The chart highlights which sectors are attracting institutional activity and which are losing favor. Institutions often lead market trends, so tracking shifts in their focus can indicate sector rotations.
Sentiment Analysis: The level of institutional activity reflects confidence in specific sectors. Rising activity in traditionally defensive sectors (e.g., healthcare, utilities) may indicate caution, while a surge in growth sectors (e.g., technology, consumer discretionary) could suggest optimism.
Emerging Trends: Sudden spikes in a previously overlooked sector, like industrials or consumer staples, might hint at emerging opportunities or structural shifts.
Macro Themes: Changes in sector activity often align with broader macroeconomic themes like inflation, interest rates, or geopolitical events. For instance:
Increased activity in energy might indicate concerns about oil supply or rising prices.
Growth in technology could align with innovations or favorable policies.
Risk Management: Declining institutional activity in a sector might signal weakening fundamentals or heightened risks.
Spotting Overcrowding: Excessive activity in a single sector over multiple weeks may suggest overcrowding, which could lead to heightened volatility if institutions begin to exit.
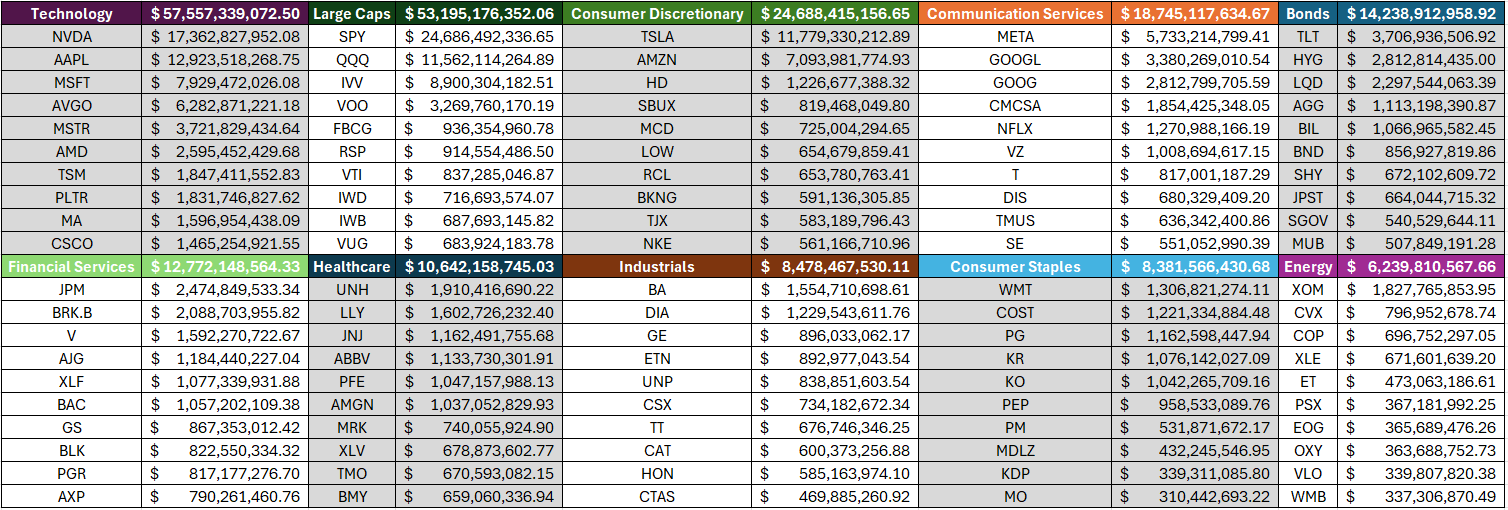
This Week’s Institutional Order Flow Insights
Sector Dominance:
Technology and Large Caps together account for over 51% of all institutional flows
Technology leads with 26.78% of flows, followed closely by Large Caps at 24.75%
The top 3 sectors (including Consumer Discretionary at 11.49%) represent about 63% of all flows
High Concentration in Top Names:
NVIDIA ( NVDA 0.04%↑ ) , Apple ( AAPL -0.00%↓ ) , and Microsoft ( MSFT 0.00%↑ ) account for 66.40% of all Technology sector flows
In Large Caps, the top 3 ETFs ( SPY 0.01%↑ , QQQ -0.00%↓ , IVV 0.00%↑ ) represent an extremely high 84.87% of sector flows
Tesla ( TSLA 0.36%↑ ), Amazon ( AMZN 0.00%↑ ) , and Home Depot ( HD 0.00%↑ ) make up 81.41% of Consumer Discretionary flows
Notable Individual Stock Flows:
NVIDIA led individual stock flows with $17.3B
Tesla dominated Consumer Discretionary with $11.8B
Meta ( META 0.05%↑ ) led Communication Services with $5.7B
JPMorgan ( JPM 0.00%↑ )topped Financial Services with $2.5B
UnitedHealth ( UNH 0.00%↑ ) led Healthcare with $1.9B
Defensive Positioning:
Significant bond flows ($14.2B) suggest some defensive positioning
Consumer Staples and Healthcare, traditionally defensive sectors, saw moderate flows
The mix of TLT 0.00%↑ , HYG 0.00%↑ , and LQD 0.00%↑ in bonds indicates diverse fixed-income strategies
Market Structure:
Heavy concentration in index ETFs ( SPY 0.01%↑ , QQQ -0.00%↓ , IVV 0.00%↑ ) suggests continued passive investment trends
Strong flows in mega-cap tech ( NVDA 0.04%↑ , AAPL -0.00%↓ , MSFT 0.00%↑ ) indicate continued big-tech dominance
Significant cryptocurrency-adjacent exposure through stocks like MSTR 0.00%↑ suggests institutional crypto interest
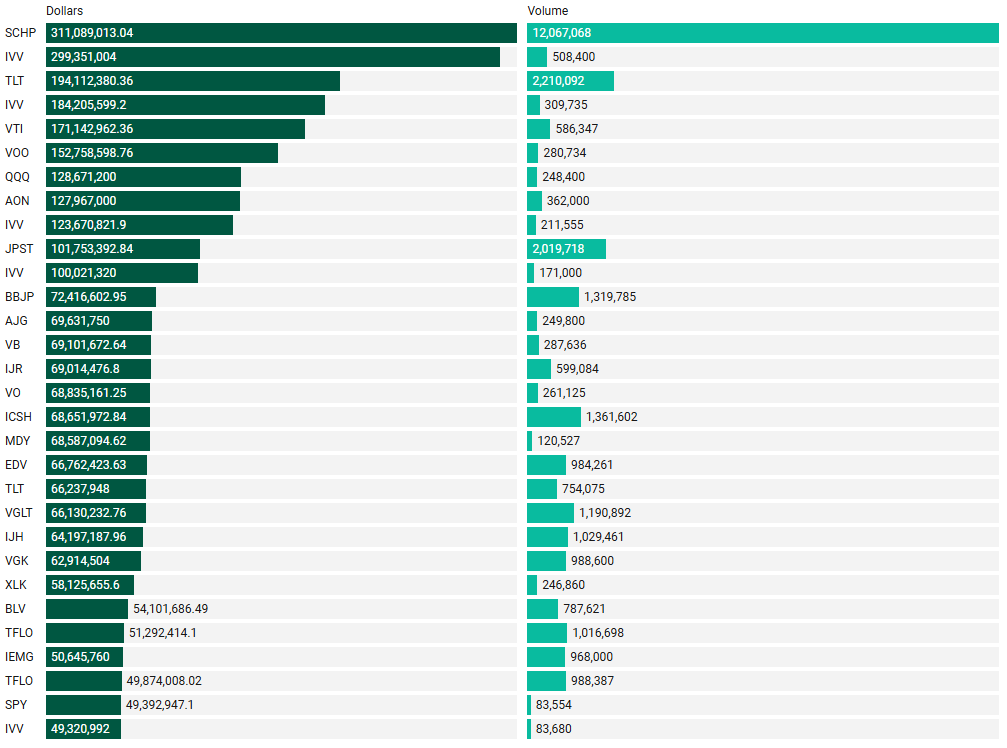
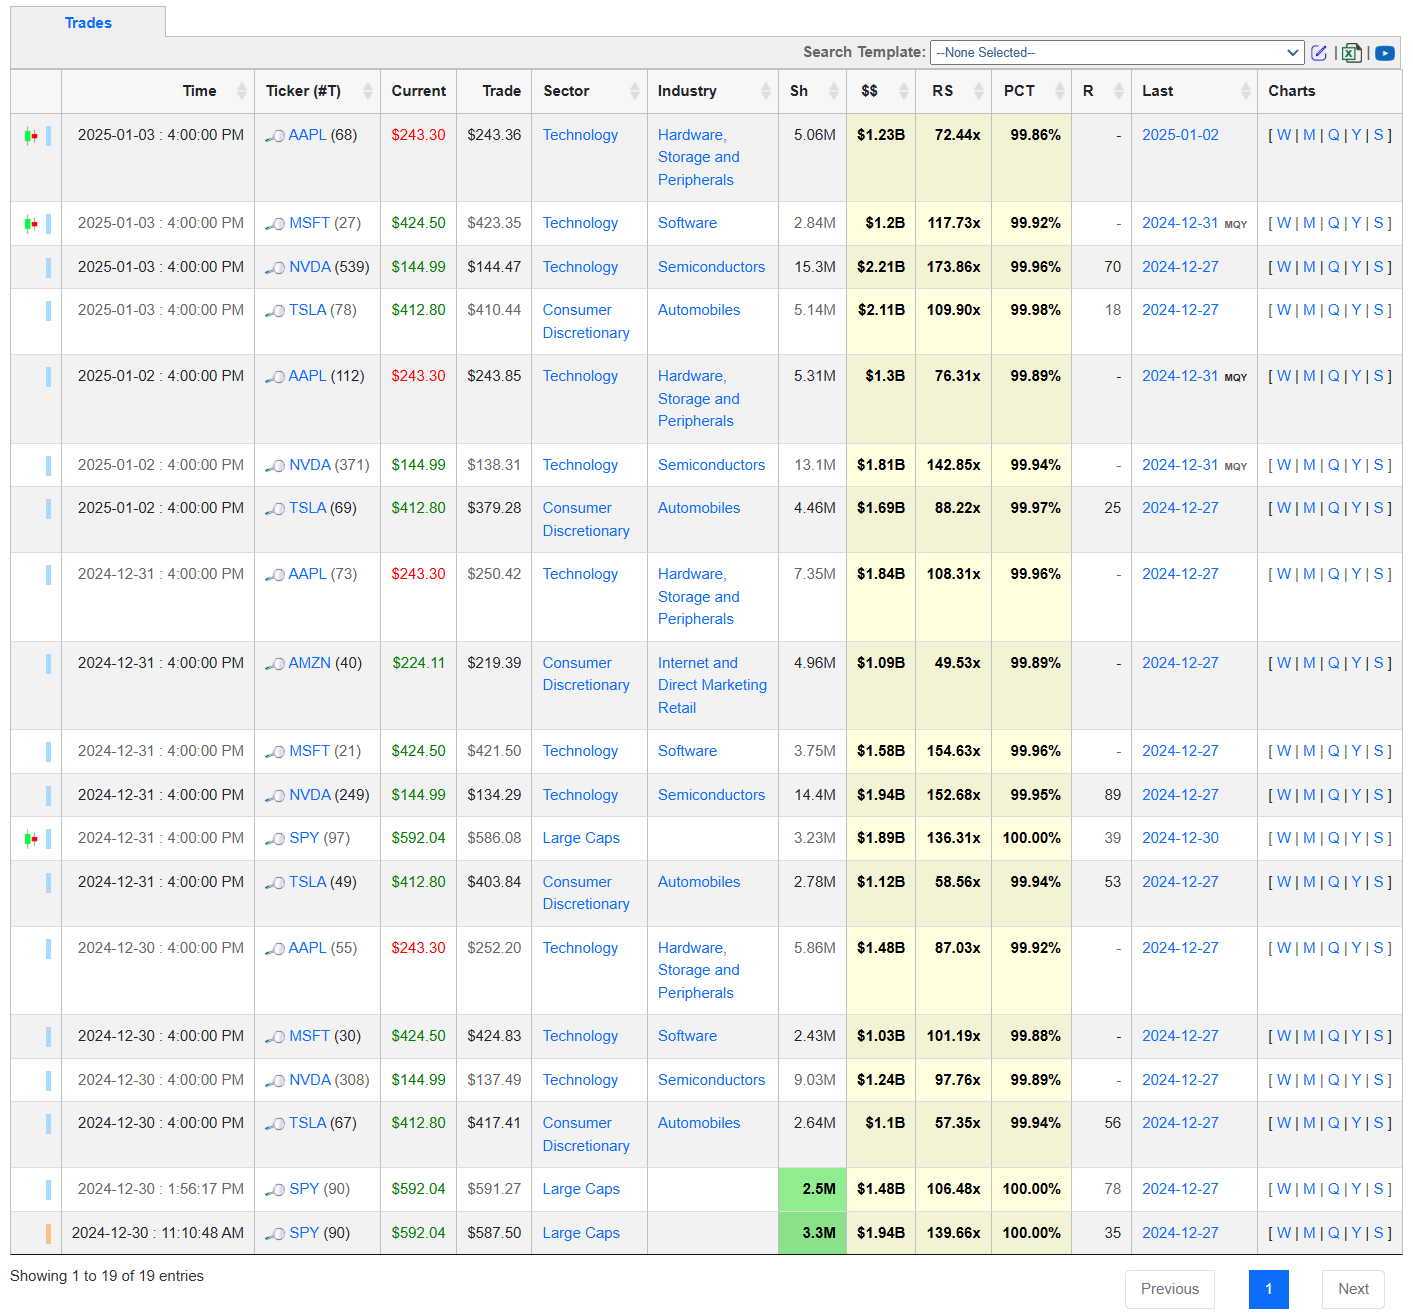
Top Institutional Order Flow In Individual Names
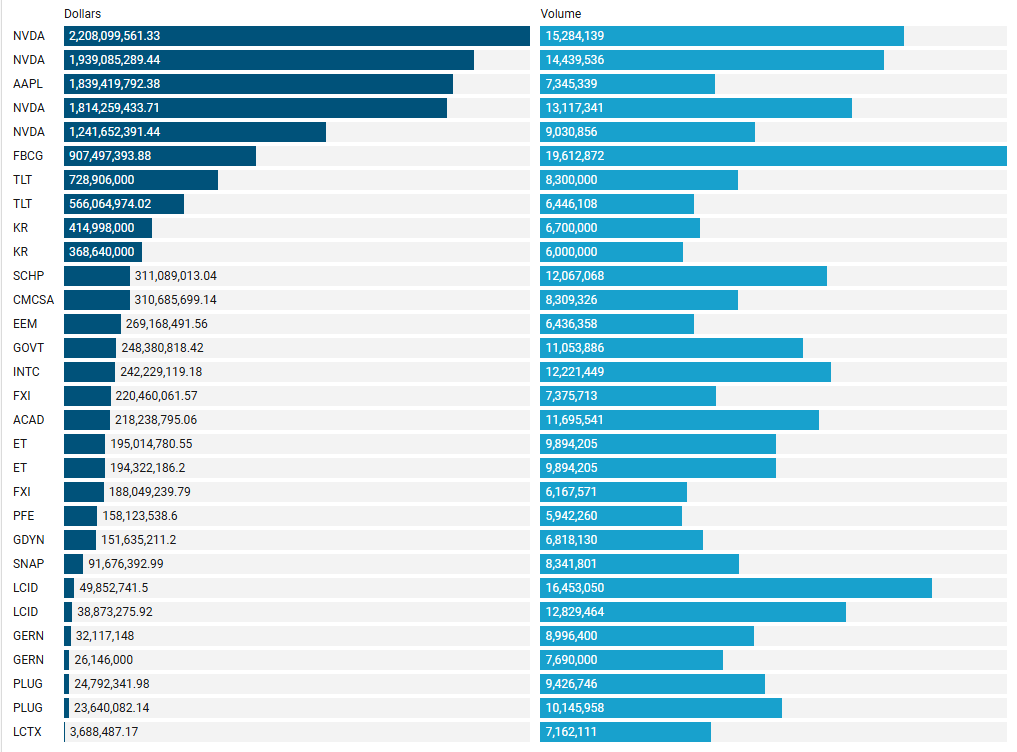
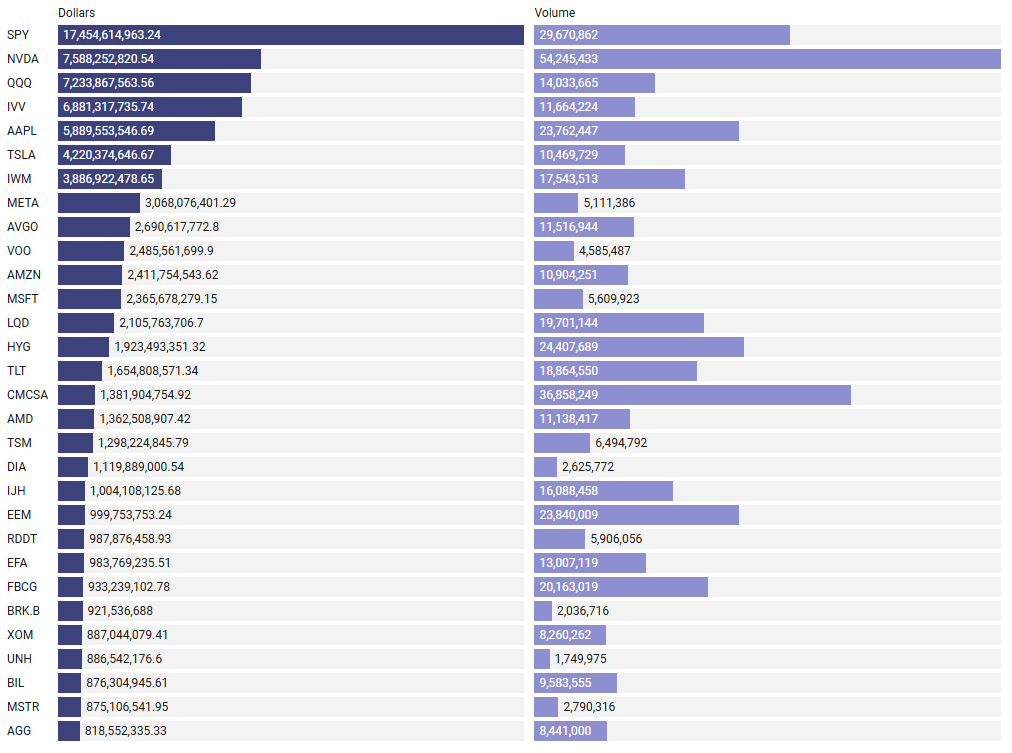
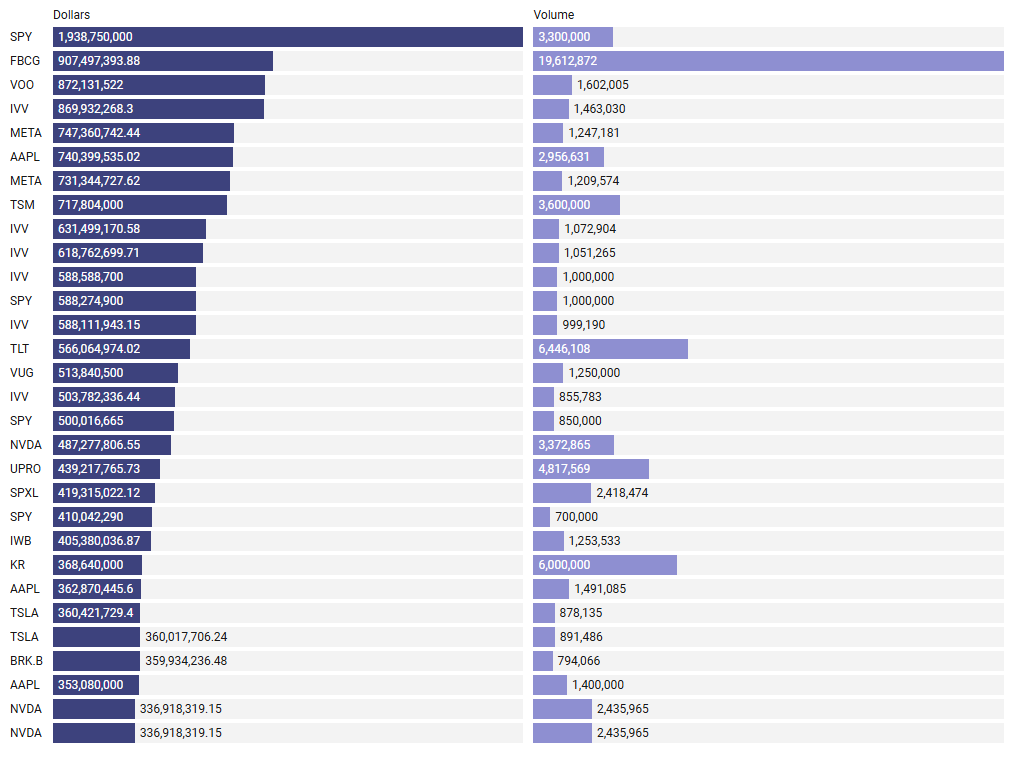
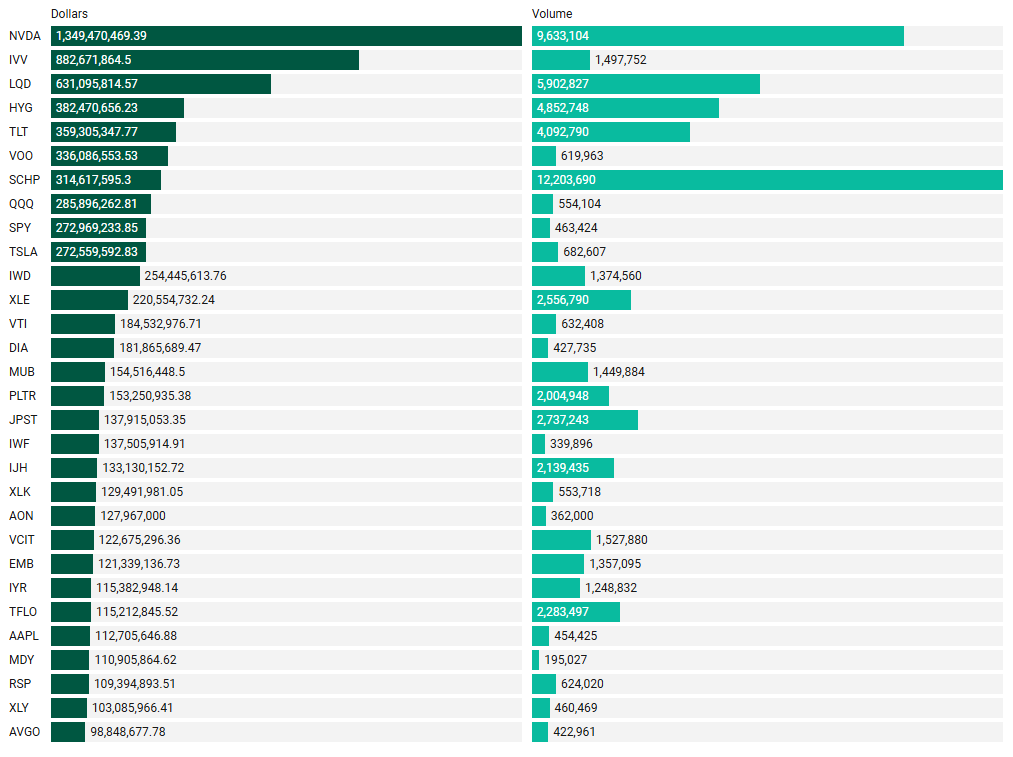
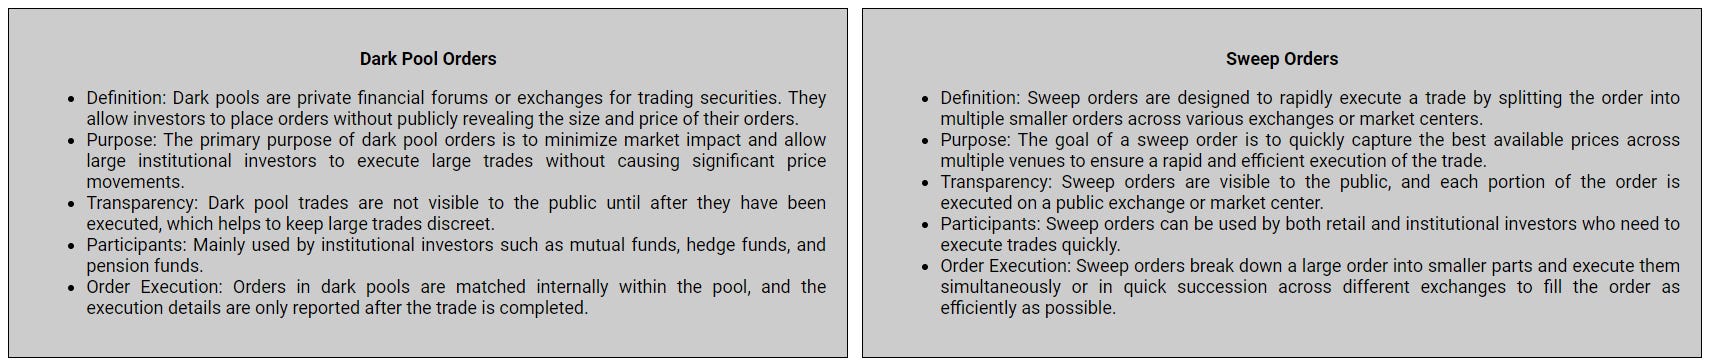
Many excellent trade ideas and sources of inspiration can be found in these prints. While only the top 30 from each group are displayed, the complete results are accessible in VolumeLeaders.com for you to explore at your convenience any time. Remember to configure trade alerts within the platform to ensure you never overlook institutional order flows that capture your interest or are significant to you. The blue charts encompass all types of trades, including blocks on lit exchanges; the purple charts exclusively depict dark pool trades; and the green charts represent sweeps only.
Largest By Aggregated Dollars Transacted
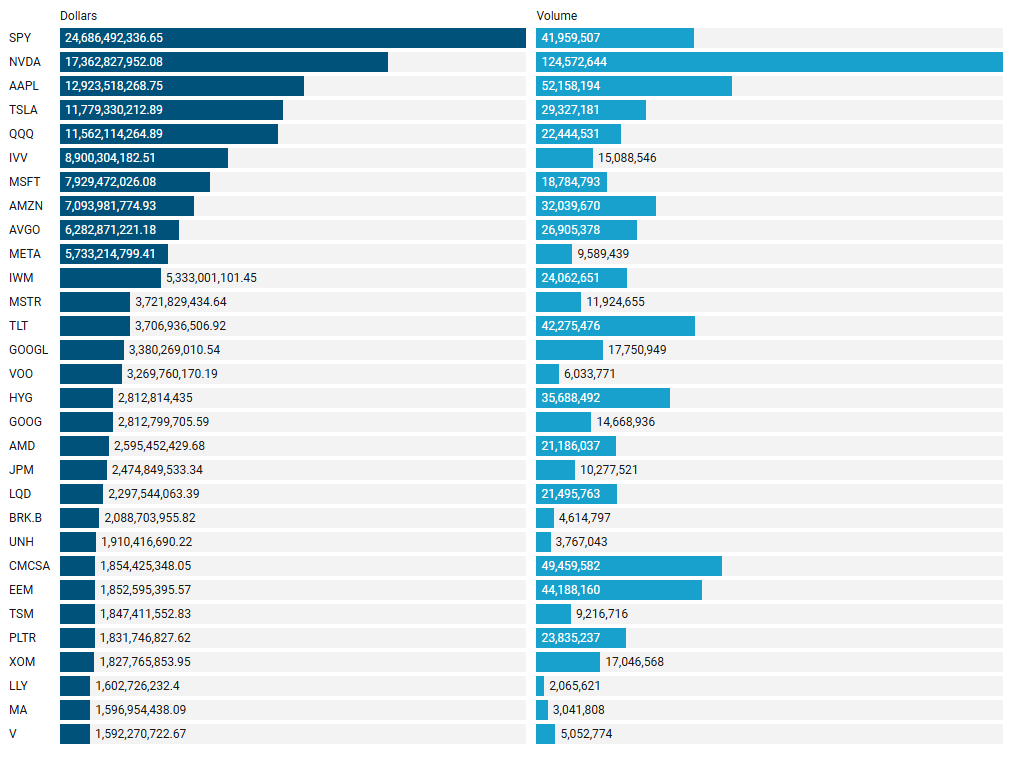
Largest Individual Trades by Dollars
Top Aggregate Dark Pool Activity by Ticker
Largest Individual Dark Pool Trades by Dollars
Top Aggregate Sweeps by Ticker
Top Individual Sweeps by Dollars Transacted
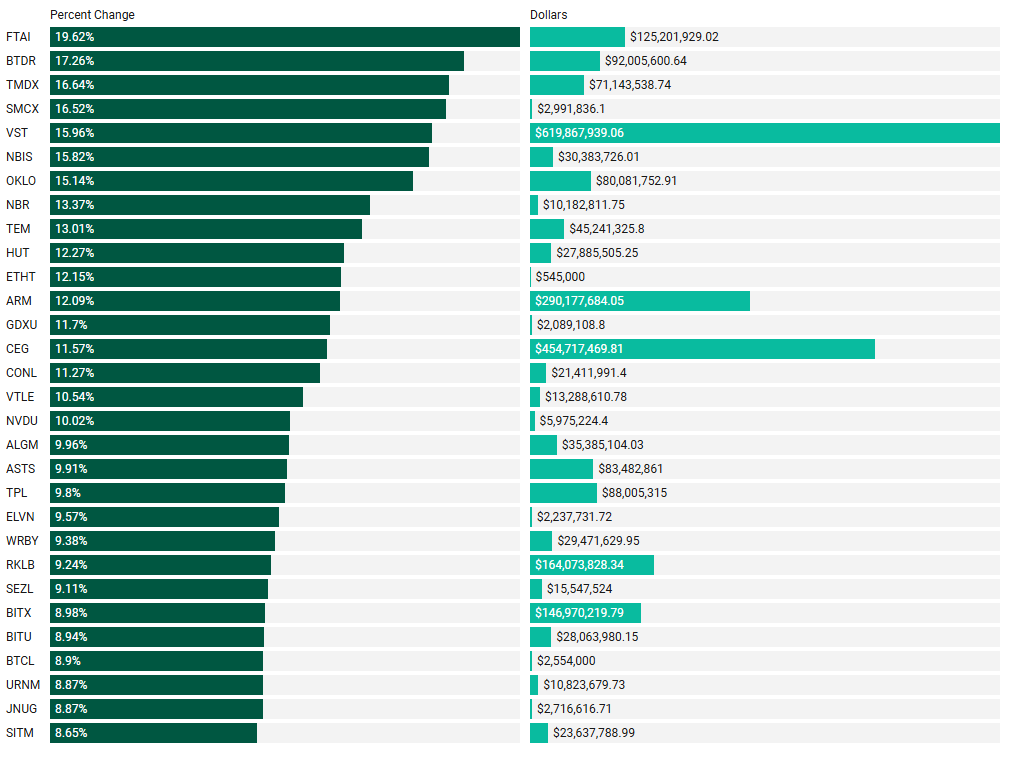
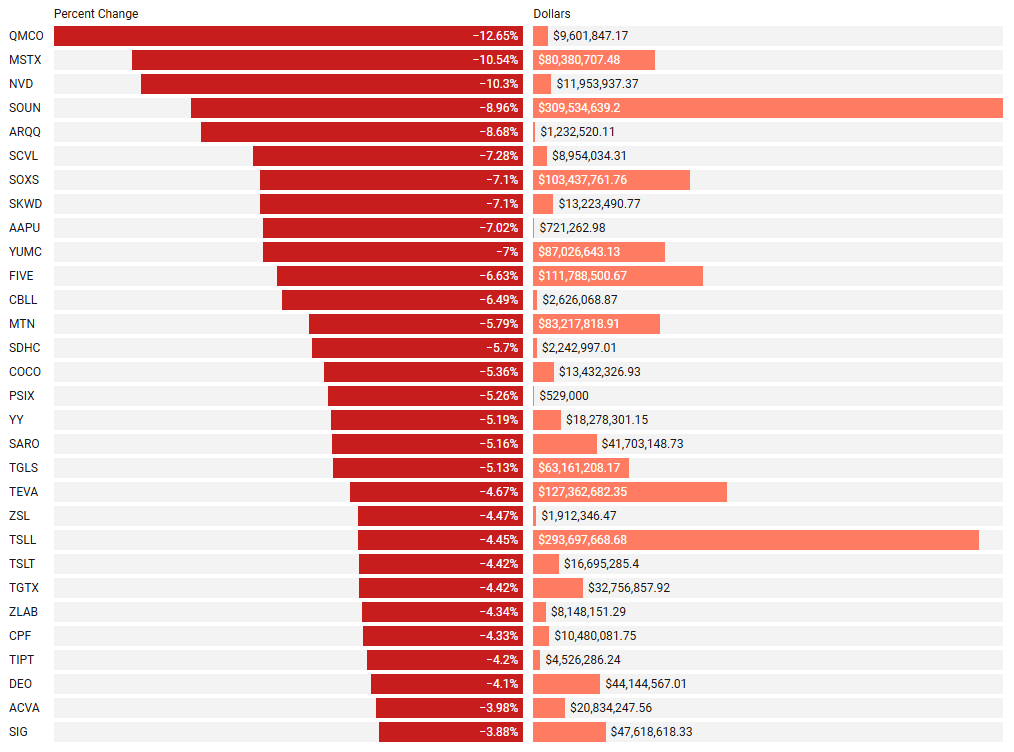
Last Week’s Institutionally-Backed Gainers & Losers
If you’re going to bet on a name, consider one that is officially endorsed by an institution! These are the top percent gainers (green) and percent losers (red) from this week’s open-to-close that had a trade price greater than $20 and institutional involvement. Continue watching tickers from this and prior stacks as these names frequently turn into multi-leg trades with a lot of movement!
Top Institutionally Backed Gainers
Top Institutionally Backed Losers
Last Week’s Billion-Dollar Prints
Tickers that printed a trade worth at least $1B last week get a special shout-out… Welcome to the club. Subs can use this convenience link to pull-up the same screen shown below. These are massive commitments by institutions that should not be ignored.
Investments In Focus: Bull vs Bear Arguments
Please read “Institutional S/R Levels For Major Indices” at the top of this stack to understand the nature and importance of what we’re looking at here visually. Institutions leave footprints that VolumeLeaders.com can illustrate for you while providing context to assess things like institutional conviction and urgency. Theses and data given below are not financial advice, just personal observations that may be wrong; consult a certified financial advisor before making any investment decisions.
JPM 0.00%↑
JPMorgan Chase & Co. (NYSE: JPM) is a leading global financial services firm offering a wide range of services, including investment banking, financial services for consumers and small businesses, commercial banking, financial transaction processing, and asset management.
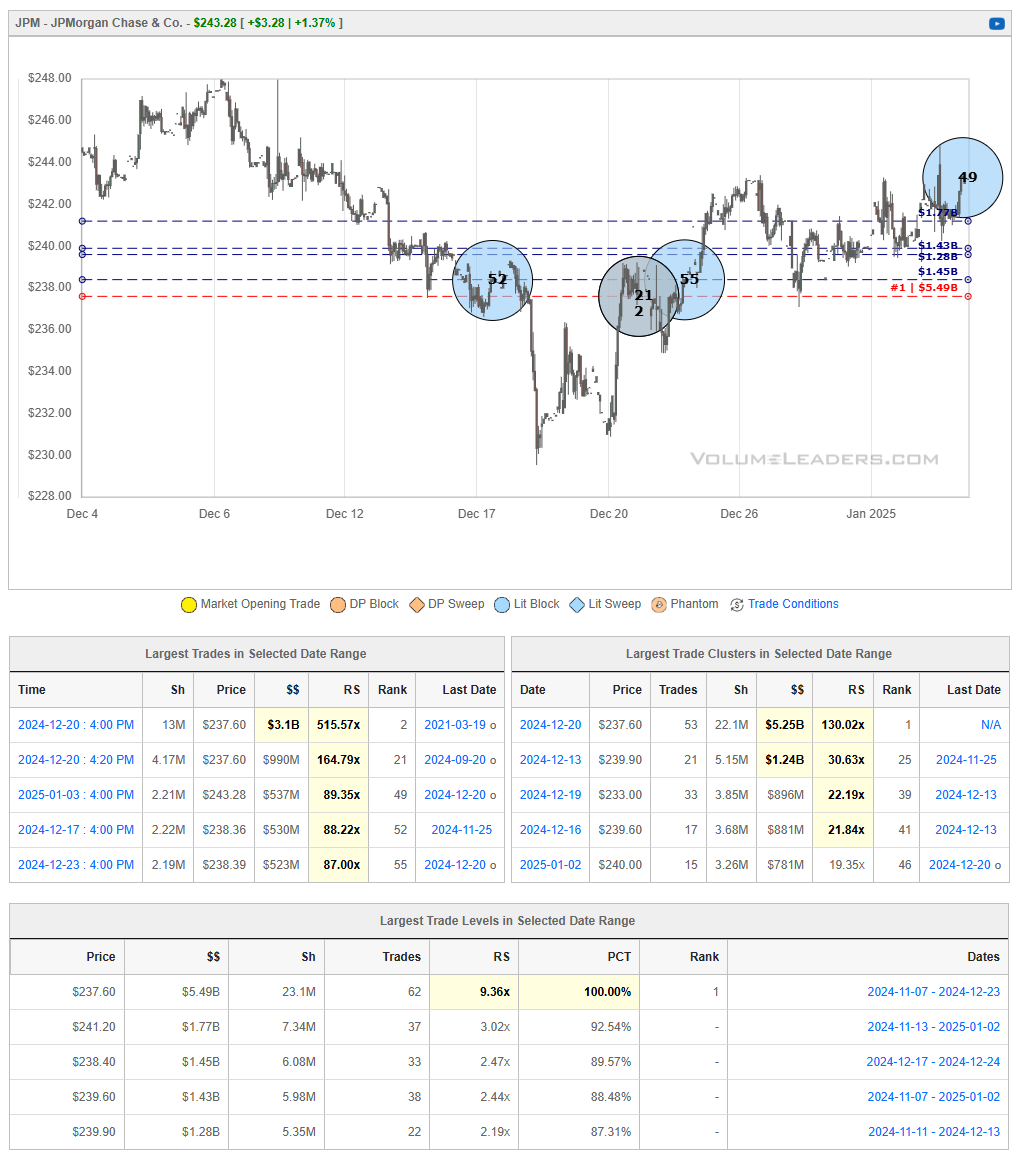
Bullish Perspective:
Robust Financial Performance: In Q3 2024, JPMorgan Chase reported a net income of $12.9 billion, reflecting strong underlying business operations.
Dominant Market Position: As one of the largest U.S. banks, JPMorgan Chase holds a significant share of industry profits, capturing 44% of the banking industry's total profits in the first nine months of 2024.
Growth in Investment Banking Fees: The bank anticipates a 45% increase in investment banking fees for Q4 2024 compared to the previous year, indicating a strong pipeline of deals and advisory services.
Strategic Enhancements in Wealth Management: JPMorgan Chase is enhancing its self-directed online brokerage with features like fractional shares and trust accounts, aiming to attract existing banking and wealth management clients.
Resilient Consumer Finances: U.S. consumer finances have shown resilience, with strengthened holiday spending, which could positively impact the bank's retail banking segment.
Bearish Perspective:
Regulatory Scrutiny and Legal Challenges: The bank has faced legal challenges, including a recent arbitration where it was ordered to pay $520,000 in legal fees to a former advisor, highlighting potential risks associated with compliance and litigation.
Withdrawal from Climate Coalition: JPMorgan Chase is considering withdrawing from the United Nations-backed Net-Zero Banking Alliance, which may attract criticism from environmentally conscious investors and stakeholders.
Market Volatility Exposure: As a major financial institution, JPMorgan Chase is exposed to market volatility, which can impact its trading revenues and overall financial performance.
Competition from Non-Bank Entities: The rise of non-bank entities in lending and mortgage markets presents competitive challenges that could affect the bank's market share in these segments.
Potential Economic Downturns: Economic downturns or recessions could lead to increased loan defaults and reduced consumer spending, adversely affecting the bank's profitability.
In summary, JPMorgan Chase & Co. demonstrates strong financial performance and a dominant market position, with growth in investment banking and strategic enhancements in wealth management. However, regulatory challenges, environmental concerns, market volatility, and competition from non-bank entities present potential risks that investors should consider.
SFM 0.00%↑
Sprouts Farmers Market, Inc. (NASDAQ: SFM) is a specialty grocery retailer headquartered in Phoenix, Arizona, focusing on fresh, natural, and organic products. As of 2024, the company operates over 400 stores across 23 states, catering to health-conscious consumers seeking high-quality, sustainably sourced groceries.
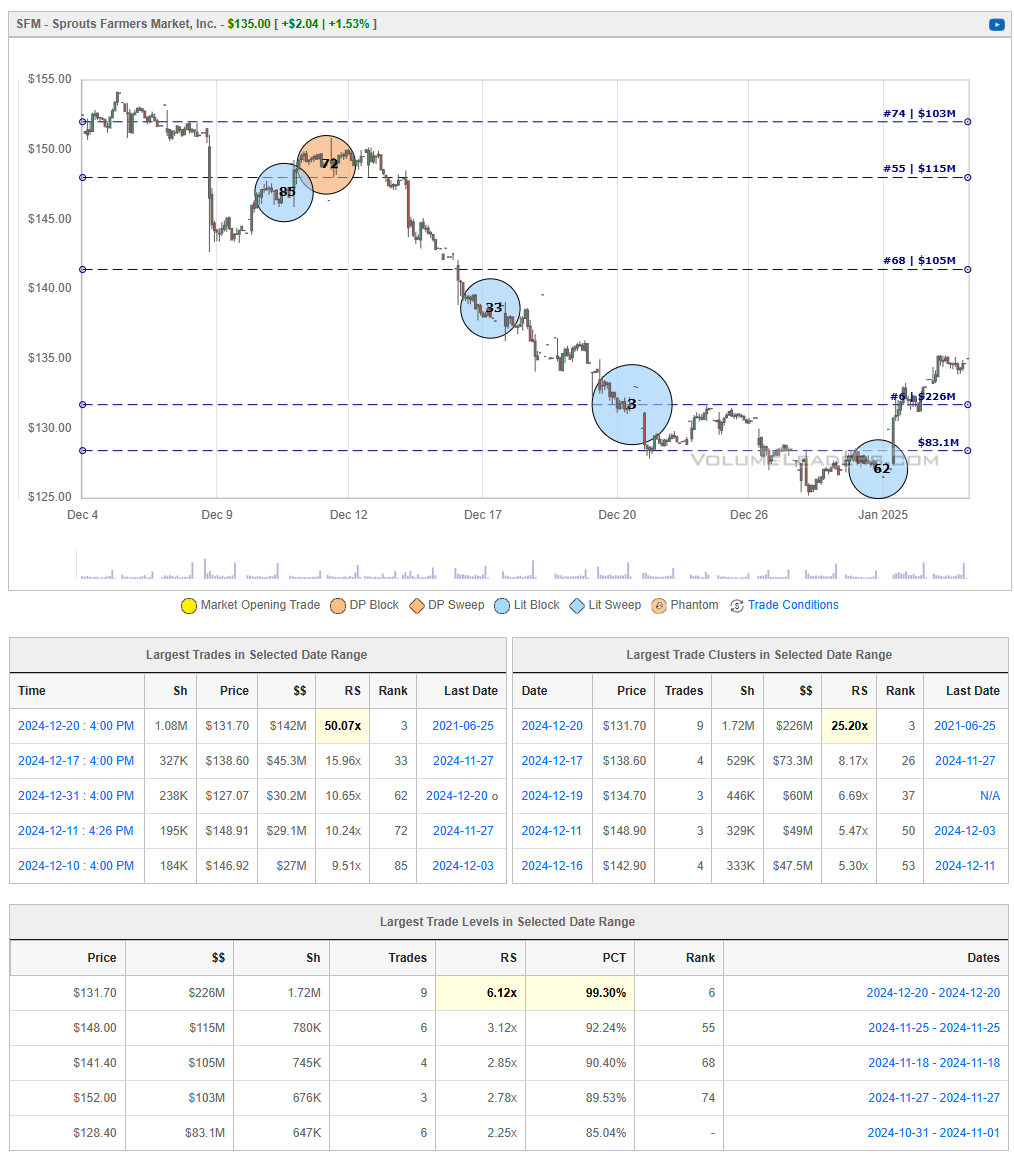
Bullish Perspective:
Strong Financial Performance: In Q2 2024, Sprouts reported net sales of $1.9 billion, a 12% increase year-over-year, with same-store sales up 6.7%. This robust growth reflects effective operational strategies and a strong consumer base.
Raised Annual Outlook: Following impressive quarterly results, Sprouts increased its full-year revenue growth projection to 9-10% and adjusted earnings per share to $3.29-$3.37, indicating confidence in sustained business momentum.
Resilient Customer Base: The company's focus on health-oriented products has cultivated a loyal customer base that remains steadfast even amid rising grocery prices, suggesting stability in revenue streams.
Strategic Store Expansion: Sprouts continues to expand its footprint, opening new stores in various states, which contributes to overall sales growth and market presence.
Positive Stock Performance: The stock has shown significant appreciation, with a notable increase over the past year, reflecting investor confidence and strong market performance.
Bearish Perspective:
Insider Selling Activity: Recent reports indicate that company insiders have sold approximately $9.1 million worth of stock in the past three months, which may raise concerns about internal confidence in the company's future prospects.
Market Saturation Risks: As Sprouts continues its rapid expansion, there is a potential risk of market saturation, which could lead to diminished returns on new store investments and increased competition among existing locations.
Valuation Concerns: Some analyses suggest that despite impressive financials, the stock may be overvalued, potentially limiting upside potential for new investors.
Competitive Retail Environment: The grocery retail sector is highly competitive, with major players and emerging specialty stores vying for market share, which could pressure Sprouts' margins and growth.
Economic Sensitivity: While the current customer base has shown resilience, broader economic downturns could impact consumer spending patterns, potentially affecting Sprouts' sales and profitability.
In summary, Sprouts Farmers Market exhibits strong financial health, strategic growth initiatives, and a dedicated customer base, positioning it favorably in the specialty grocery sector. However, potential challenges such as insider selling, market saturation, valuation concerns, and competitive pressures warrant careful consideration for prospective investors.
JNPR 0.00%↑
Juniper Networks, Inc. (NYSE: JNPR) is a prominent player in the networking industry, specializing in secure, AI-driven network solutions for enterprises and service providers.
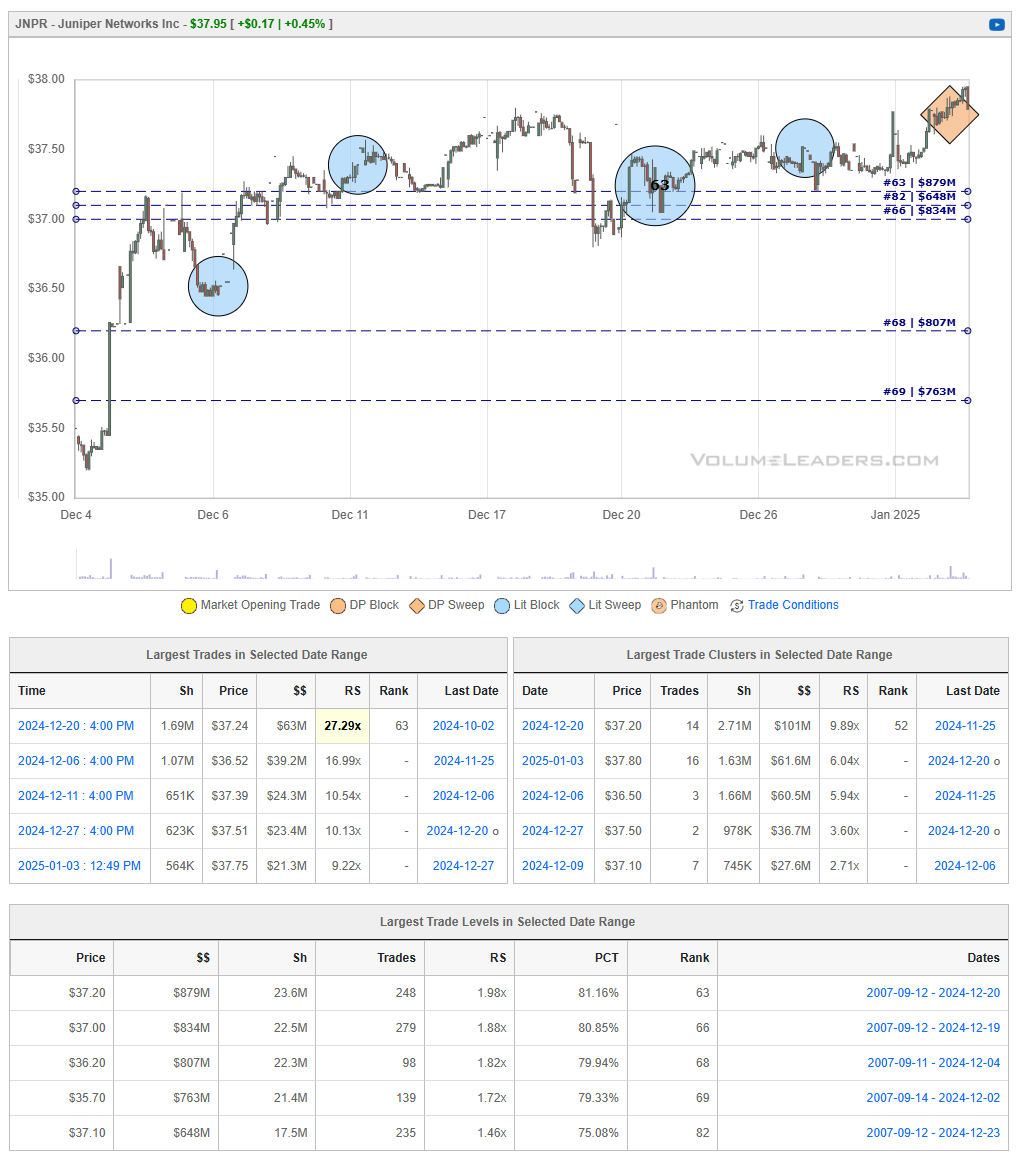
Bullish Perspective:
Strong Q3 2024 Financial Performance: Juniper reported Q3 2024 revenue of $1.33 billion, surpassing Wall Street's expectations of $1.26 billion, driven by robust demand for networking equipment, particularly from cloud customers investing in AI infrastructure.
Strategic Acquisition by Hewlett Packard Enterprise (HPE): In January 2024, HPE announced plans to acquire Juniper for approximately $14 billion ($40 per share). This acquisition is expected to enhance HPE's networking capabilities and expand its market reach, potentially benefiting Juniper's growth prospects.
Advancements in AI-Native Networking: Juniper continues to innovate in AI-driven networking solutions, recently expanding its AI-Native Networking Platform to support Wi-Fi 7. This positions the company to meet the evolving demands of high-performance networking environments.
Global Regulatory Approvals: The proposed acquisition by HPE has received approvals from regulatory bodies in the EU and the UK, indicating a clear path toward deal completion and potential operational synergies.
Resilient Stock Performance: Despite market volatility, Juniper's stock has demonstrated resilience, trading close to its 52-week high, reflecting investor confidence in the company's strategic direction and financial health.
Bearish Perspective:
Revenue Decline: While Q3 2024 revenue exceeded expectations, it represented a 5% year-over-year decline, indicating potential challenges in maintaining consistent growth amid market competition.
Increased Short Interest: As of December 2024, short interest in Juniper's stock rose by 23.6%, suggesting that a segment of investors anticipates a potential decline in the company's stock price.
Pending Acquisition Uncertainties: Although the HPE acquisition is progressing, it remains subject to regulatory approvals and customary closing conditions. Any delays or complications could introduce uncertainty and impact Juniper's market position.
Market Competition: The networking industry is highly competitive, with major players continually innovating. Juniper faces pressure to maintain its market share and technological edge against competitors.
Integration Risks Post-Acquisition: The forthcoming integration with HPE presents potential challenges, including aligning corporate cultures, systems, and strategies, which could affect operational efficiency and employee morale.
In summary, Juniper Networks exhibits strengths through its financial performance, strategic acquisition prospects, and technological advancements. However, investors should remain cognizant of potential challenges, including revenue fluctuations, market competition, and uncertainties related to the pending acquisition.
ABNB 0.00%↑
Airbnb, Inc. (NASDAQ: ABNB) is a leading global platform that connects hosts offering unique accommodations with guests seeking lodging experiences.
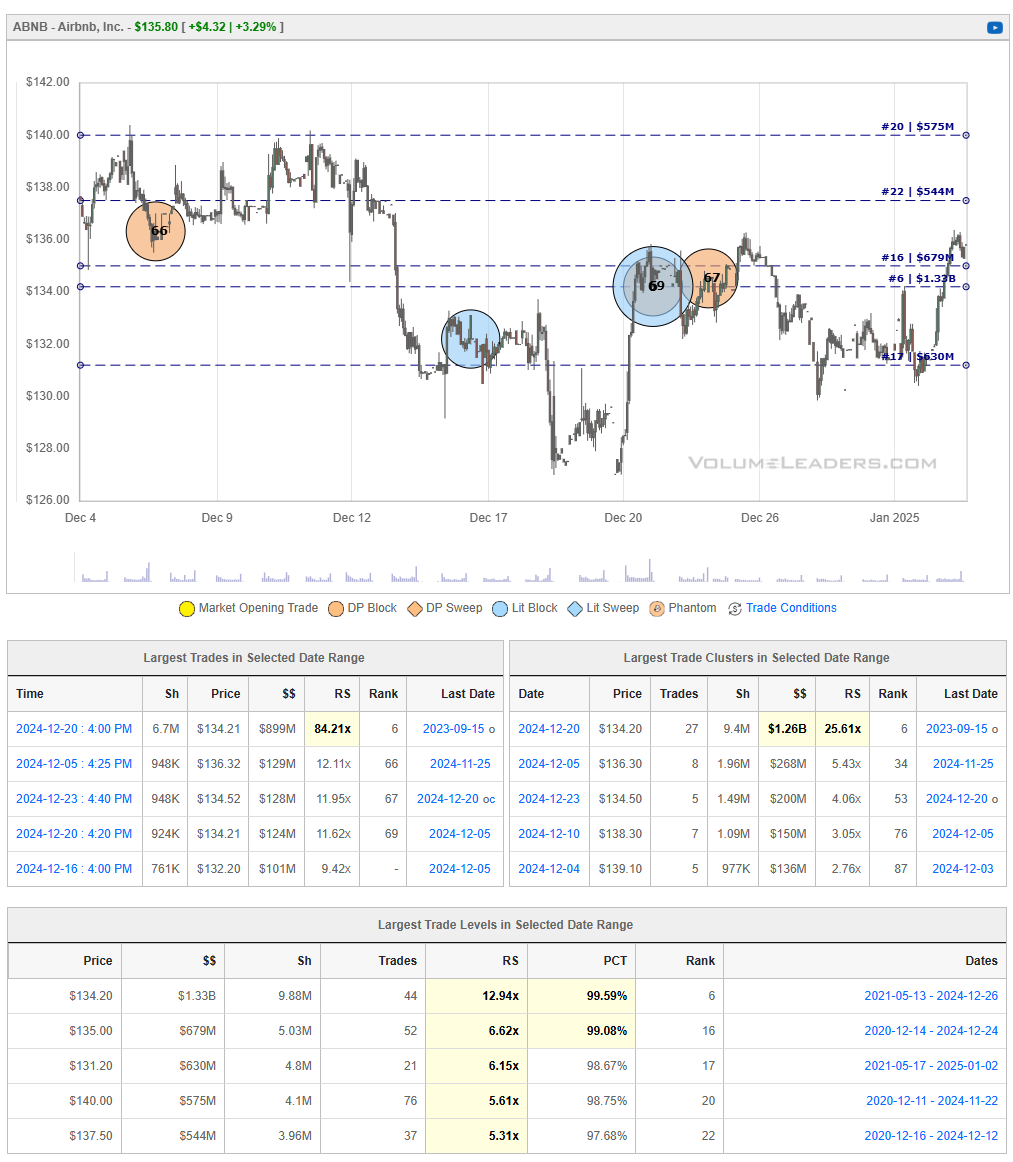
Bullish Perspective:
Strong Financial Performance: In Q3 2024, Airbnb reported revenue of $3.7 billion, a 10% increase year-over-year, driven by solid growth in nights stayed and a modest increase in Average Daily Rate (ADR).
Global Expansion: The company has seen significant growth in the Asia-Pacific and Latin American markets, with nights and experiences booked increasing by 19% and 15% respectively, indicating successful international expansion.
Innovation and Diversification: Airbnb is expanding its offerings beyond accommodations, planning to introduce new services in 2025, which could open additional revenue streams and enhance its market position.
Resilient Business Model: Despite regulatory challenges, Airbnb continues to achieve record revenues, demonstrating the resilience and adaptability of its business model.
Positive Market Reception: Analysts have noted Airbnb's potential for significant revenue and profit growth, supported by increasing global adoption of alternative accommodations and low debt levels.
Bearish Perspective:
Regulatory Challenges: Airbnb faces increasing regulatory scrutiny in various cities, which could impact its operations and growth prospects.
Profit Margin Concerns: While revenue has grown, there has been a reported 8% decrease in net income in the first nine months of 2024 compared to the same period in 2023, indicating potential profitability challenges.
Competitive Market: The short-term rental market is highly competitive, with new entrants and traditional hospitality providers enhancing their offerings, which could pressure Airbnb's market share.
Stock Volatility: Airbnb's stock has experienced fluctuations, trading below its 52-week high, which may concern risk-averse investors.
Economic Sensitivity: As a platform reliant on travel and tourism, Airbnb's performance is susceptible to economic downturns and changes in consumer spending behavior.
In summary, Airbnb's strong financial performance, global expansion, and innovative strategies present a compelling investment case. However, regulatory challenges, profitability concerns, and market competition are factors that potential investors should consider.
ZBRA 0.00%↑
Zebra Technologies Corporation (NASDAQ: ZBRA) is a leading provider of enterprise asset intelligence solutions, specializing in automatic identification and data capture technologies such as barcode scanners, mobile computers, and RFID tracking systems.
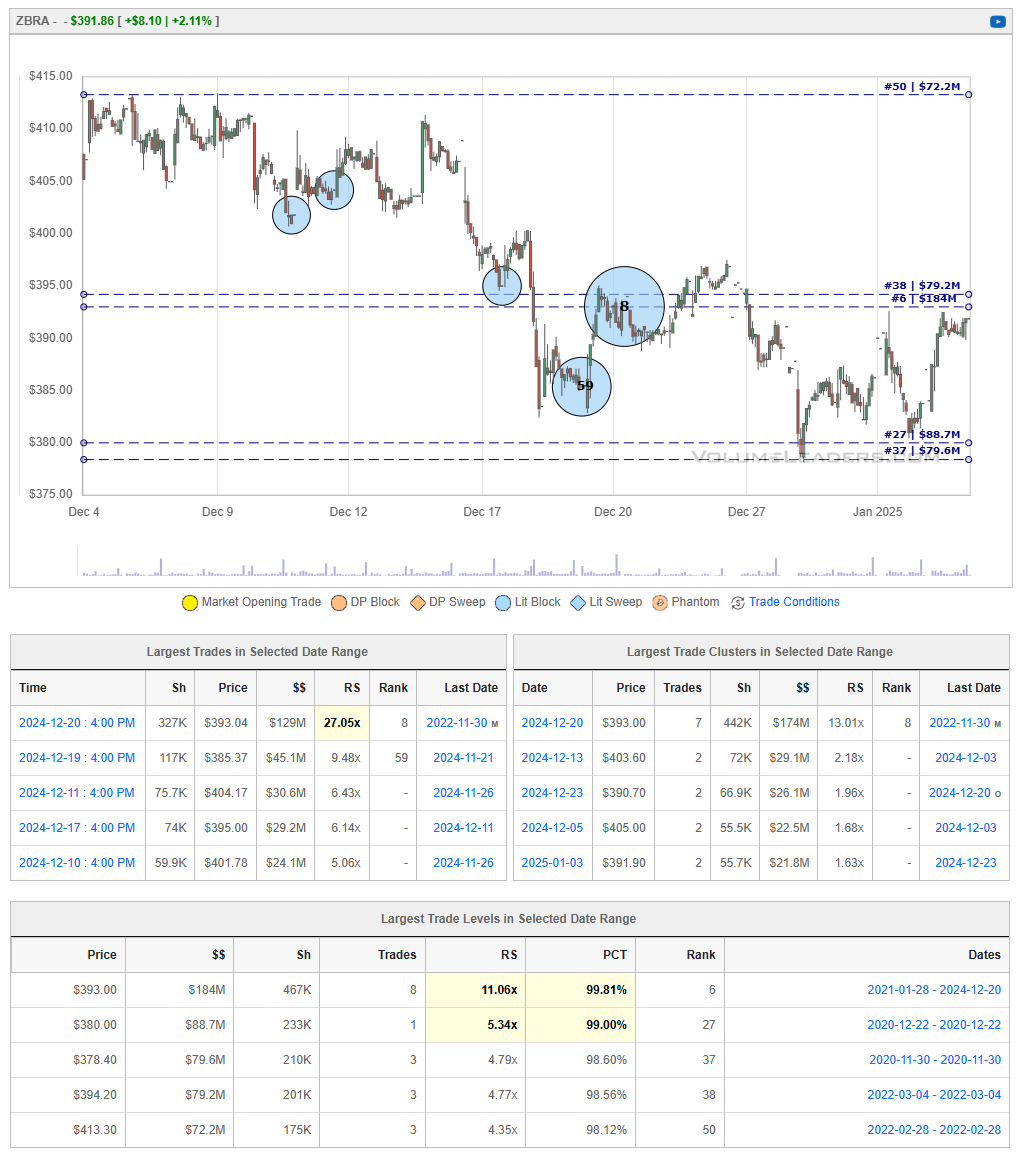
Bullish Perspective:
Strong Financial Performance: In Q3 2024, Zebra reported revenue of $1.26 billion, a 31% increase year-over-year, and adjusted earnings per share of $3.49, significantly surpassing analysts' expectations.
Upbeat Q4 Forecast: The company anticipates Q4 revenue growth between 28% and 31%, with adjusted earnings per share projected between $3.80 and $4.00, indicating sustained demand for its products and effective cost management strategies.
Strategic Acquisitions: Zebra's recent acquisition of Photoneo expands its portfolio in 3D machine vision solutions, enhancing its capabilities in automation and intelligent data capture.
Market Leadership: As a dominant player in the enterprise asset intelligence sector, Zebra benefits from increasing demand for automation and digital transformation across industries such as retail, healthcare, and manufacturing.
Positive Analyst Outlook: Analysts have raised price targets for Zebra, reflecting confidence in the company's growth prospects and market position.
Bearish Perspective:
High Valuation Metrics: Zebra's current P/E ratio of 53.31 is significantly higher than the Industrial Products sector average of 20.87, suggesting that the stock may be overvalued relative to its peers.
Market Volatility Exposure: As a technology-driven company, Zebra's stock is subject to market fluctuations, which may impact investor sentiment and stock performance.
Integration Risks: While strategic acquisitions like Photoneo offer growth opportunities, they also present integration challenges that could affect operational efficiency and profitability.
Competitive Landscape: The enterprise asset intelligence market is highly competitive, with numerous players offering similar solutions, which could pressure Zebra's market share and pricing strategies.
Economic Sensitivity: Economic downturns or reduced capital expenditures by businesses could negatively impact demand for Zebra's products and services.
In summary, Zebra Technologies demonstrates strong financial performance, strategic growth through acquisitions, and a leading market position, making it an attractive investment opportunity. However, potential risks related to high valuation, market volatility, integration challenges, and economic sensitivity should be carefully considered by investors.
TRP 0.00%↑
TC Energy Corporation (NYSE: TRP) is a leading North American energy infrastructure company, specializing in natural gas and liquids pipelines, power generation, and energy storage.
As of January 4, 2025, the stock is trading at $46.53, with a 52-week range between $34.95 and $50.37.
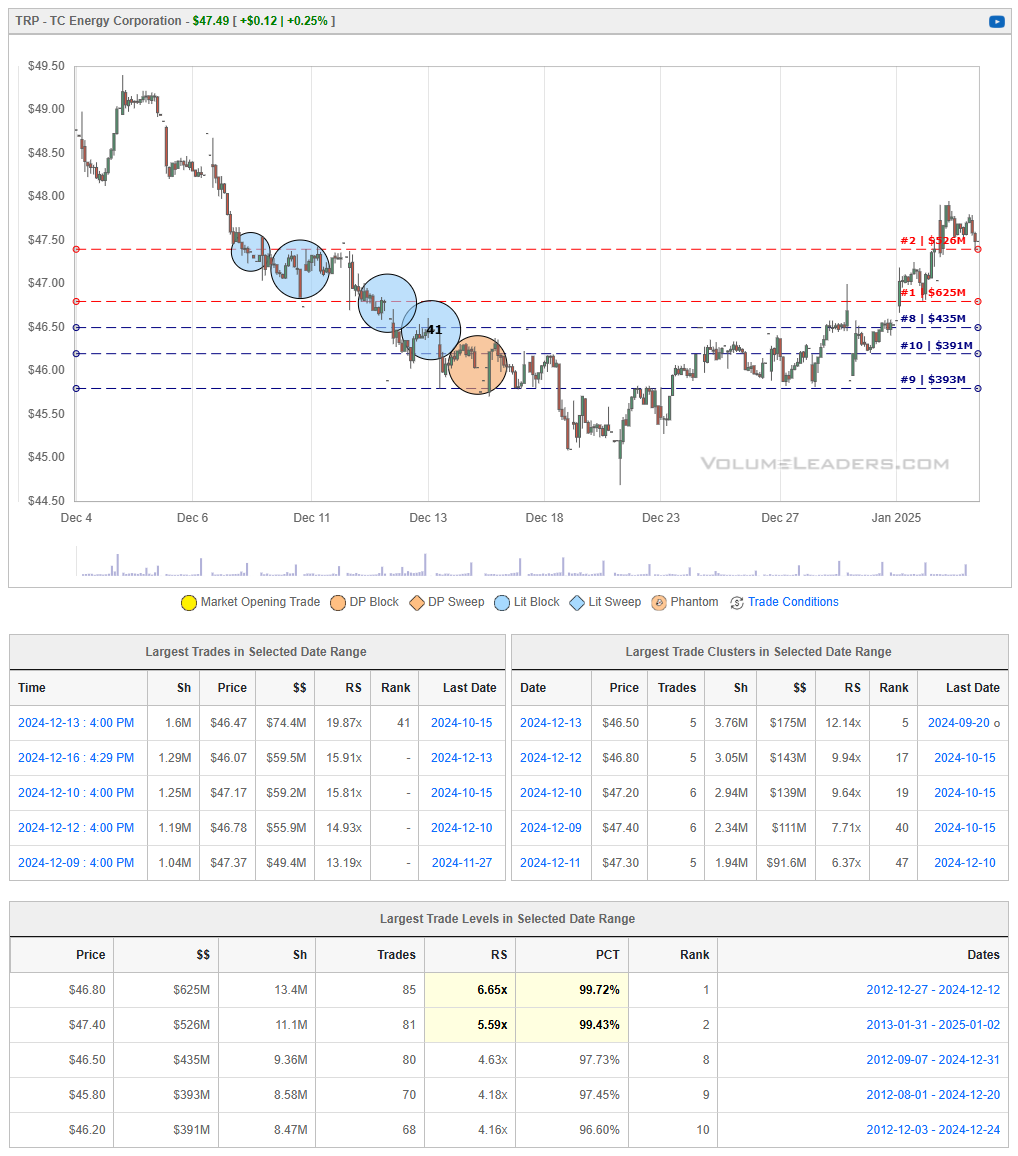
Bullish Perspective:
Stable Dividend Yield: TC Energy offers an attractive dividend yield of approximately 6.13%, appealing to income-focused investors seeking reliable returns.
Analyst Price Targets: The average 12-month price target among analysts is $55.67, suggesting a potential upside of about 19.64% from the current price.
Institutional Confidence: Approximately 79.39% of TC Energy's stock is held by institutional investors, indicating strong market trust in the company's stability and growth prospects.
Strategic Asset Portfolio: The company's diversified energy infrastructure assets across North America provide a stable revenue base and reduce exposure to regional market fluctuations.
Positive Earnings Performance: TC Energy has demonstrated strong operational efficiency, with recent earnings surpassing consensus estimates, reflecting effective management and profitability.
Bearish Perspective:
Mixed Analyst Ratings: The consensus among Wall Street analysts is a "Hold" rating, with 2 sell ratings, 2 hold ratings, and 5 buy ratings, indicating uncertainty about the company's future performance.
High Debt Levels: The company has a relatively high debt-to-equity ratio of 1.78, suggesting significant reliance on debt financing, which could pose risks, especially in a rising interest rate environment.
Regulatory Challenges: Operating in the energy sector subjects TC Energy to stringent regulatory requirements, and any changes in environmental policies could impact its operations and profitability.
Commodity Price Volatility: Fluctuations in natural gas and oil prices can affect the company's revenue and earnings, introducing an element of unpredictability.
Market Competition: The energy infrastructure industry is highly competitive, with numerous players vying for market share, potentially impacting TC Energy's growth and profitability.
In summary, TC Energy Corporation presents a compelling investment opportunity with its stable dividend yield, strategic asset portfolio, and institutional backing. However, potential investors should carefully consider the mixed analyst ratings, high debt levels, regulatory challenges, and market competition that may influence the company's future performance.
SCHP 0.00%↑
The Schwab U.S. TIPS ETF (SCHP) is an exchange-traded fund that seeks to track the Bloomberg U.S. Treasury Inflation-Linked Bond Index (Series-L), providing investors with exposure to U.S. Treasury Inflation-Protected Securities (TIPS).
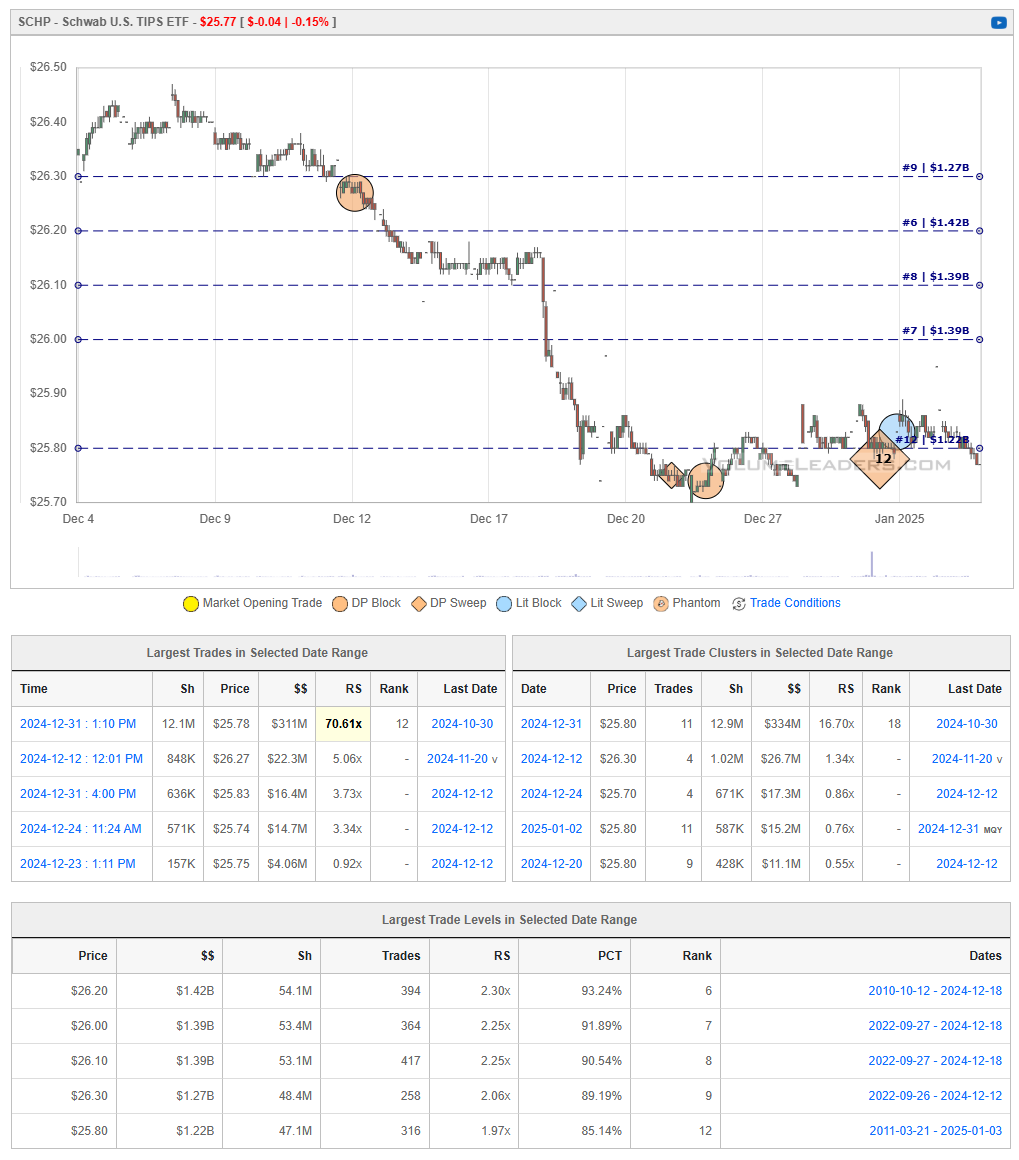
Bullish Perspective:
Inflation Protection: SCHP invests in TIPS, which adjust their principal value based on changes in the Consumer Price Index (CPI), offering a hedge against inflation.
Low Expense Ratio: With an expense ratio of 0.03%, SCHP is among the most cost-effective options in its category, allowing investors to retain more of their returns.
Diversified TIPS Exposure: The fund provides broad exposure to the U.S. TIPS market, investing in securities with at least one year remaining to maturity, which can enhance portfolio diversification.
Strong Asset Base: As of January 2, 2025, SCHP manages approximately $11.5 billion in assets, reflecting investor confidence and liquidity.
Recent Share Split: Effective October 10, 2024, SCHP underwent a 2-for-1 share split, increasing the number of shares outstanding and enhancing accessibility for investors.
Bearish Perspective:
Interest Rate Sensitivity: SCHP has an effective duration of 6.7 years, making it susceptible to interest rate fluctuations, which can negatively impact its price.
Inflation Expectations: If actual inflation is lower than anticipated, TIPS may underperform traditional Treasury securities, potentially affecting SCHP's returns.
Limited Credit Risk Diversification: SCHP exclusively holds U.S. government securities, which, while low-risk, may not provide the credit diversification some investors seek.
Potential for Negative Real Yields: In low or negative real interest rate environments, TIPS can offer minimal or negative real yields, impacting SCHP's income generation.
Market Liquidity Considerations: While SCHP generally offers high liquidity, during periods of market stress, liquidity in the TIPS market can diminish, potentially affecting fund performance.
In summary, SCHP provides a low-cost avenue for investors seeking inflation protection through exposure to U.S. TIPS. However, considerations regarding interest rate sensitivity, inflation expectations, and market liquidity are important factors for potential investors to evaluate.
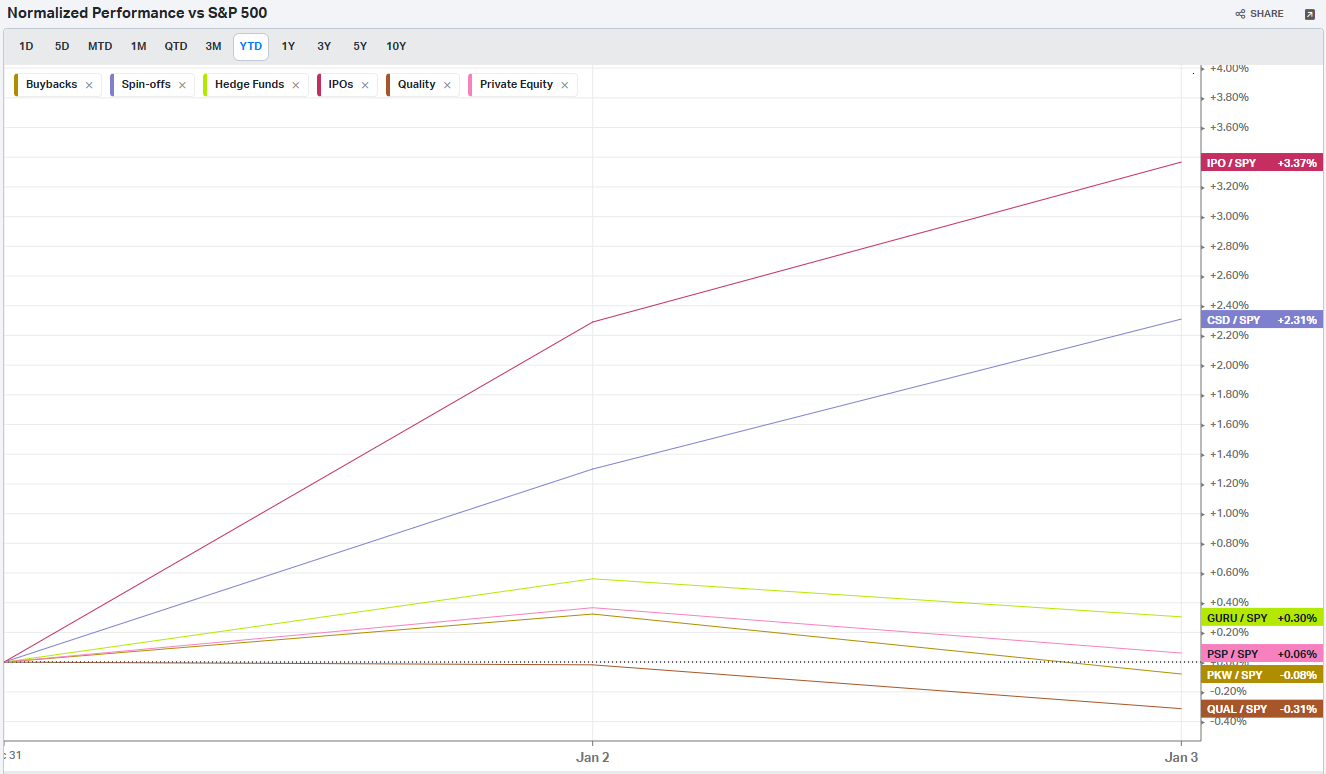
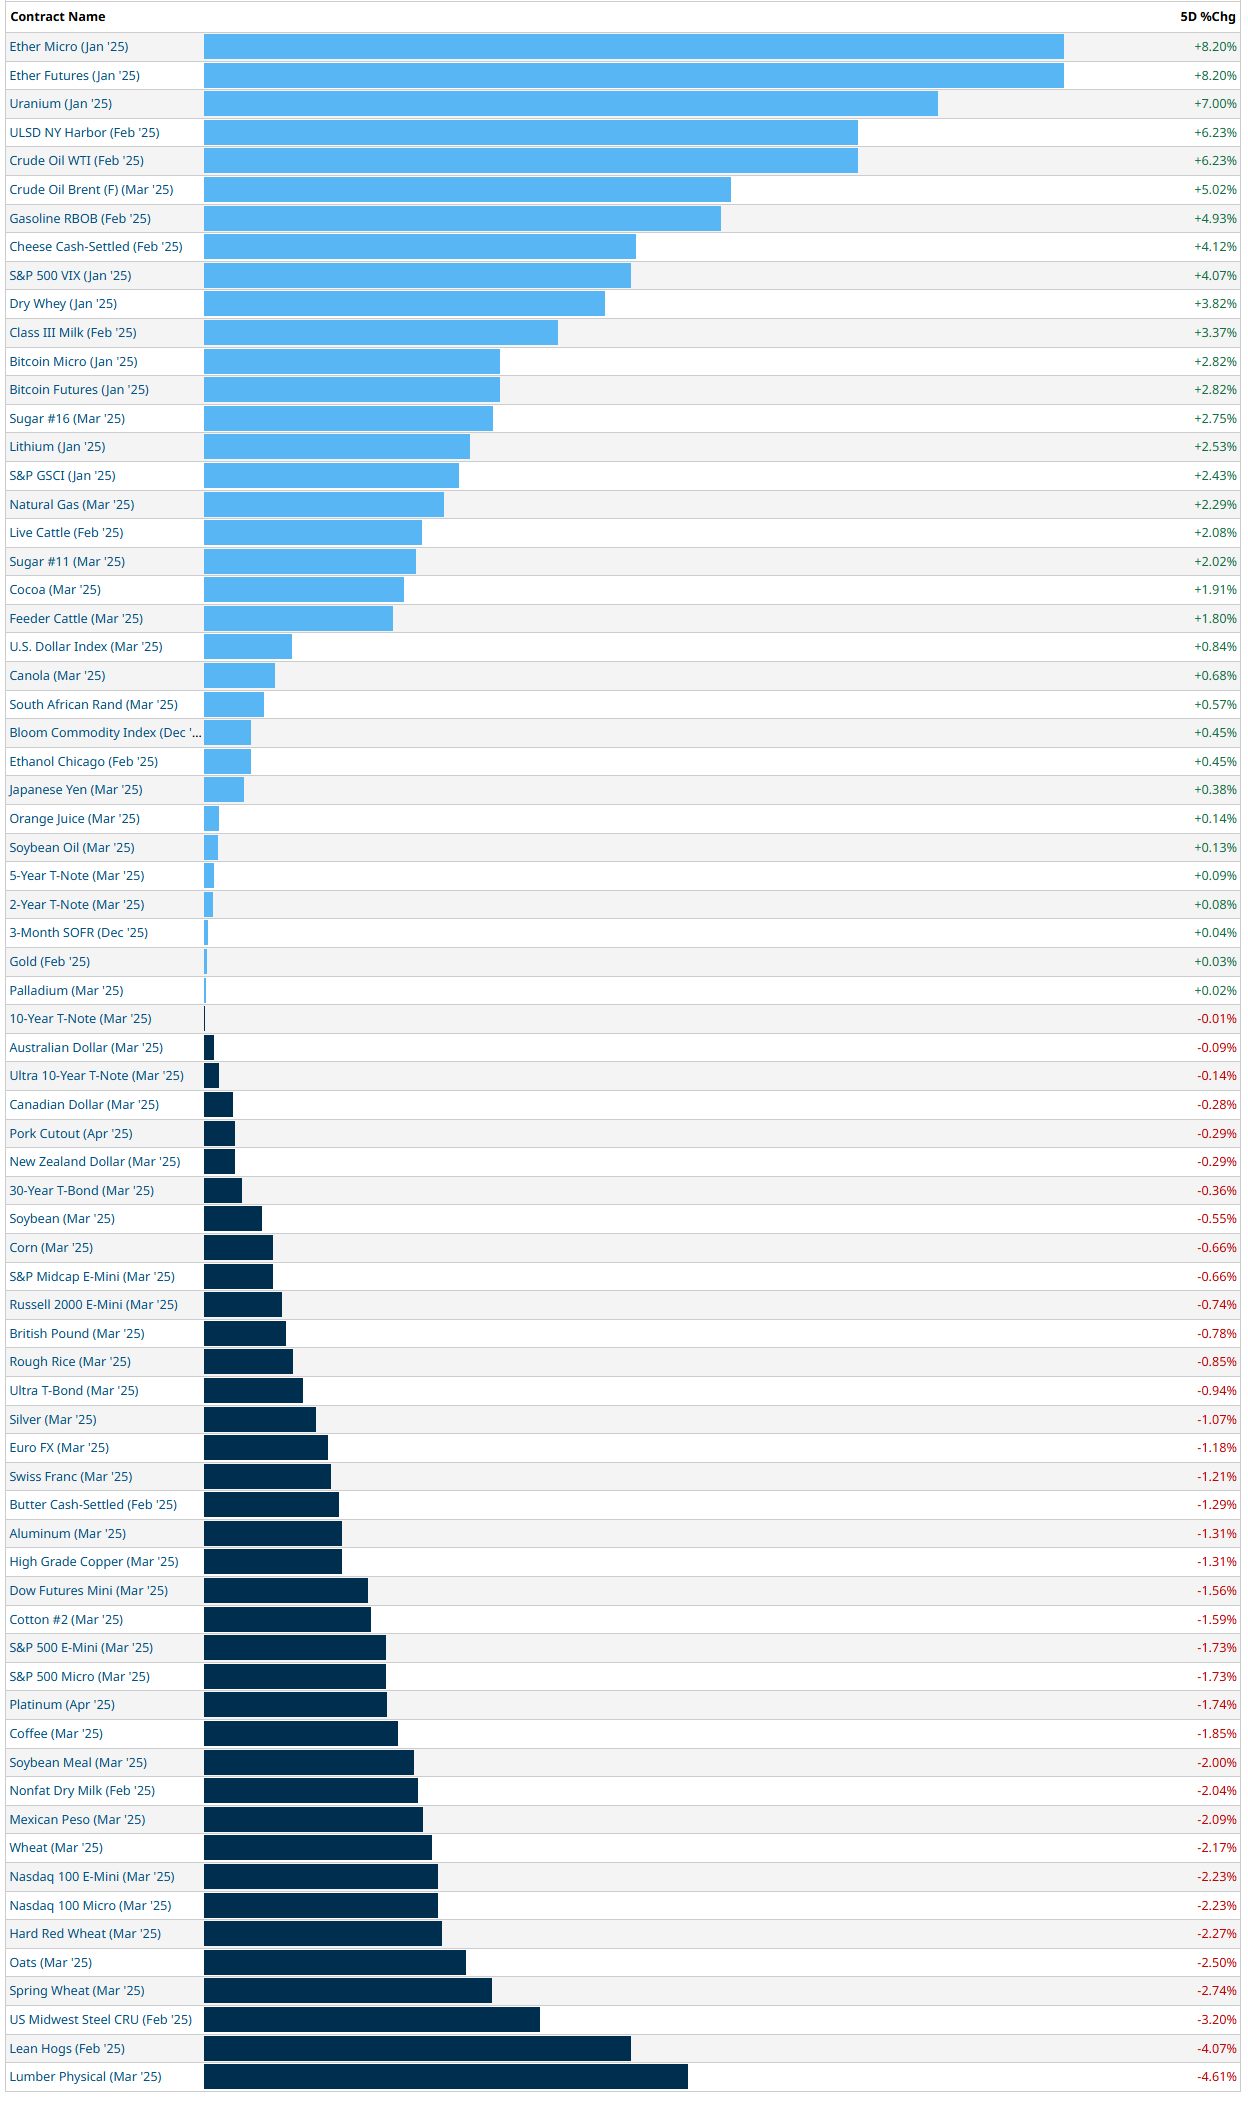
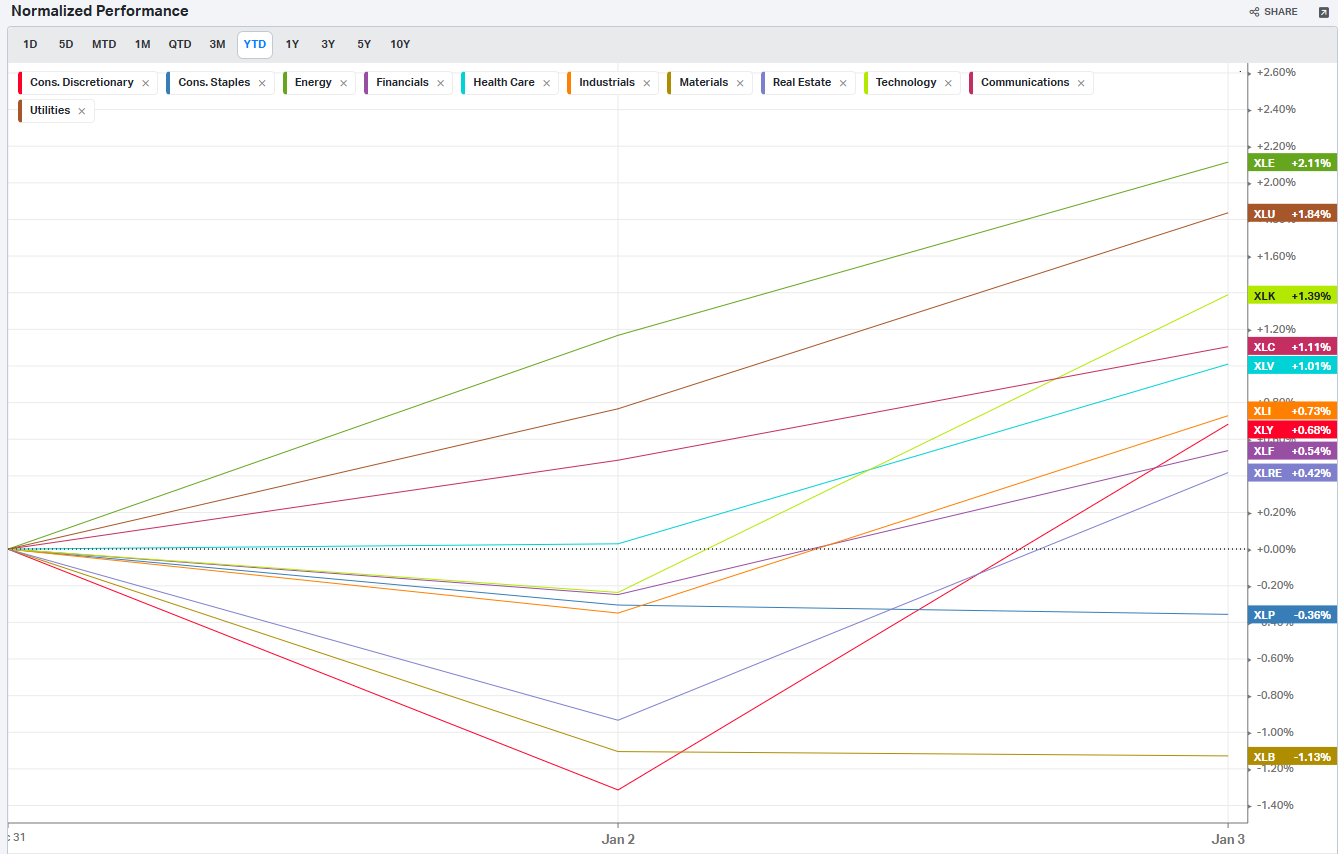
Summary Of Thematic Performance YTD
VolumeLeaders.com provides a lot of pre-built filters for thematics so that you can quickly dive into specific areas of the market. These performance overviews are provided here only for inspiration. Consider targeting leaders and/or laggards in the best and worst sectors, for example.
S&P By Sector
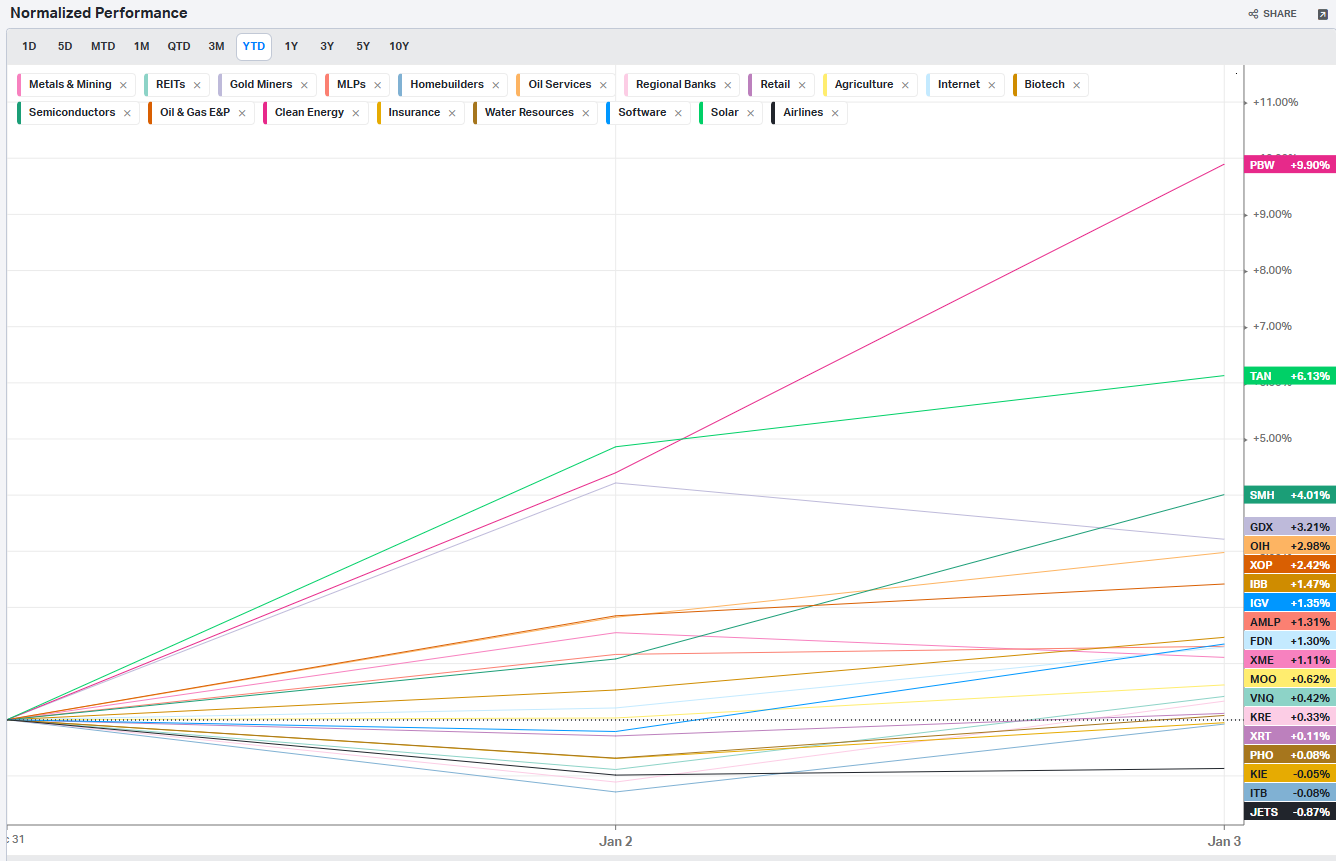
S&P By Industry
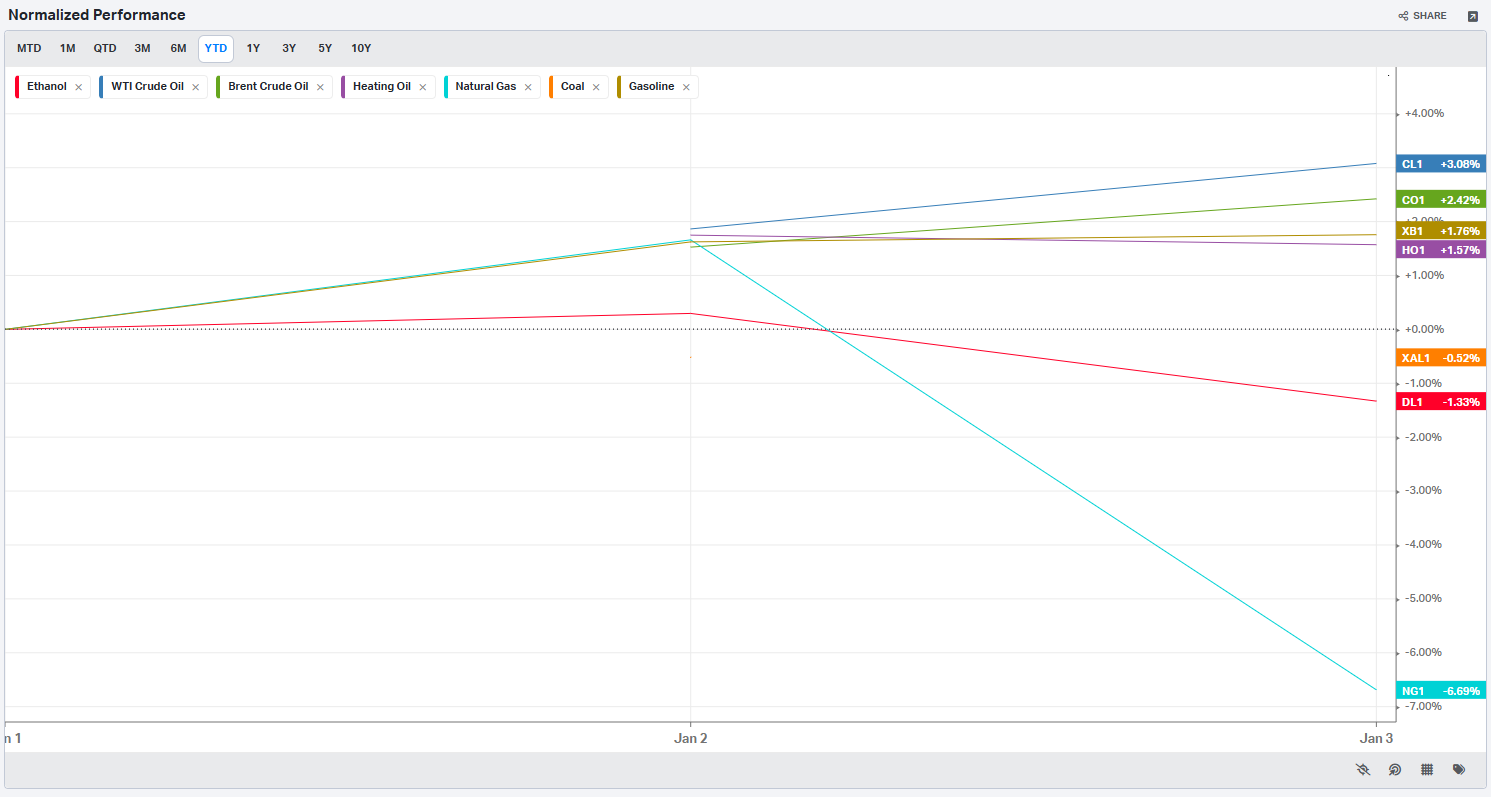
Commodities: Energy
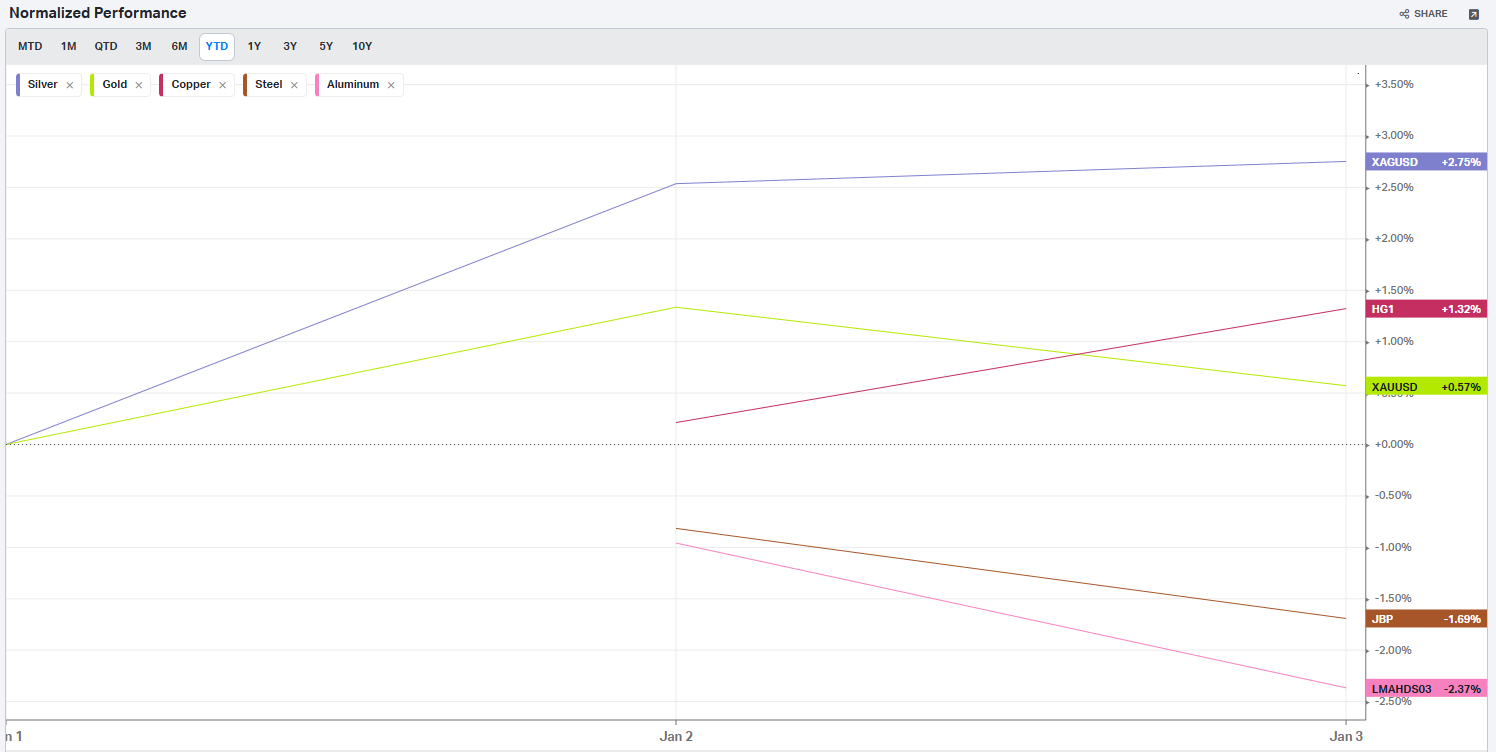
Commodities: Metals
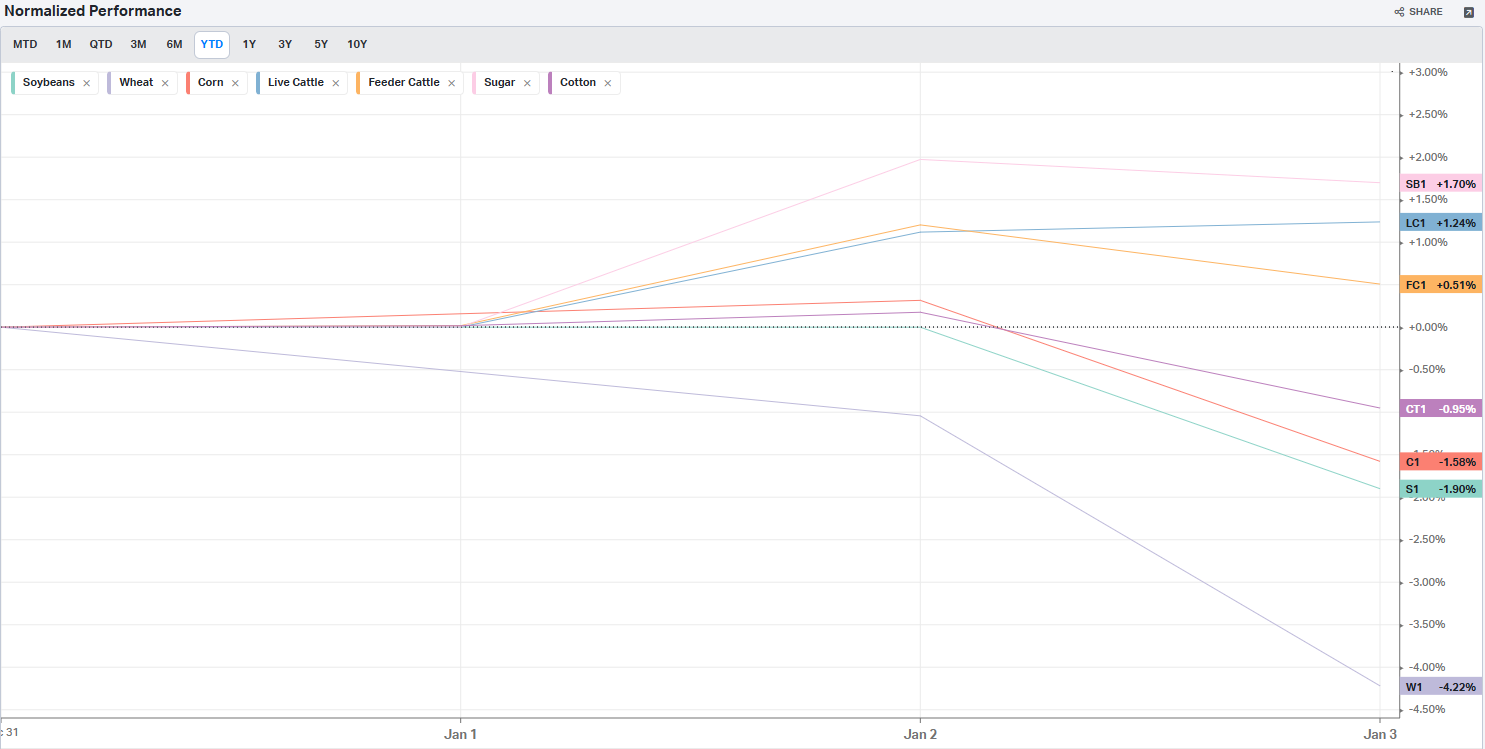
Commodities: Agriculture
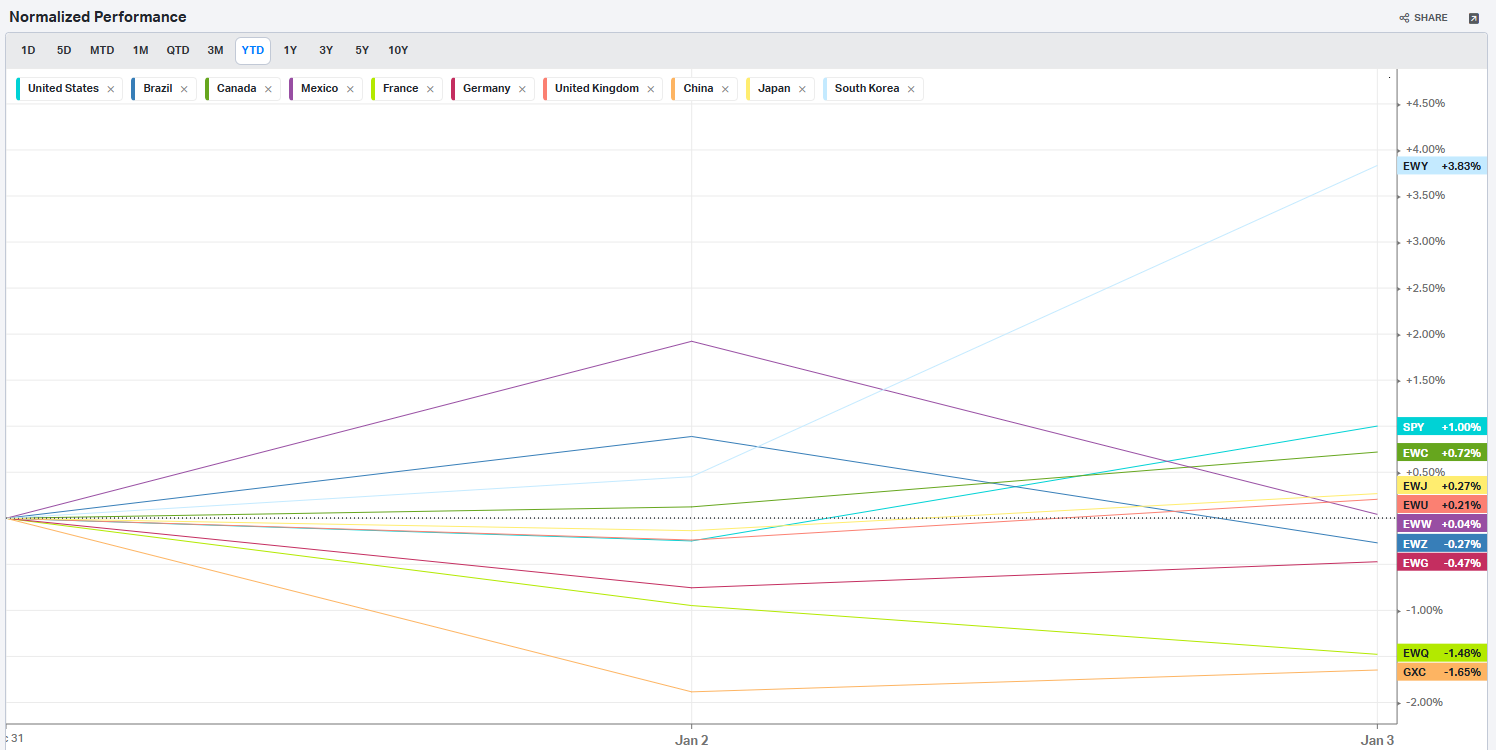
Country ETFs
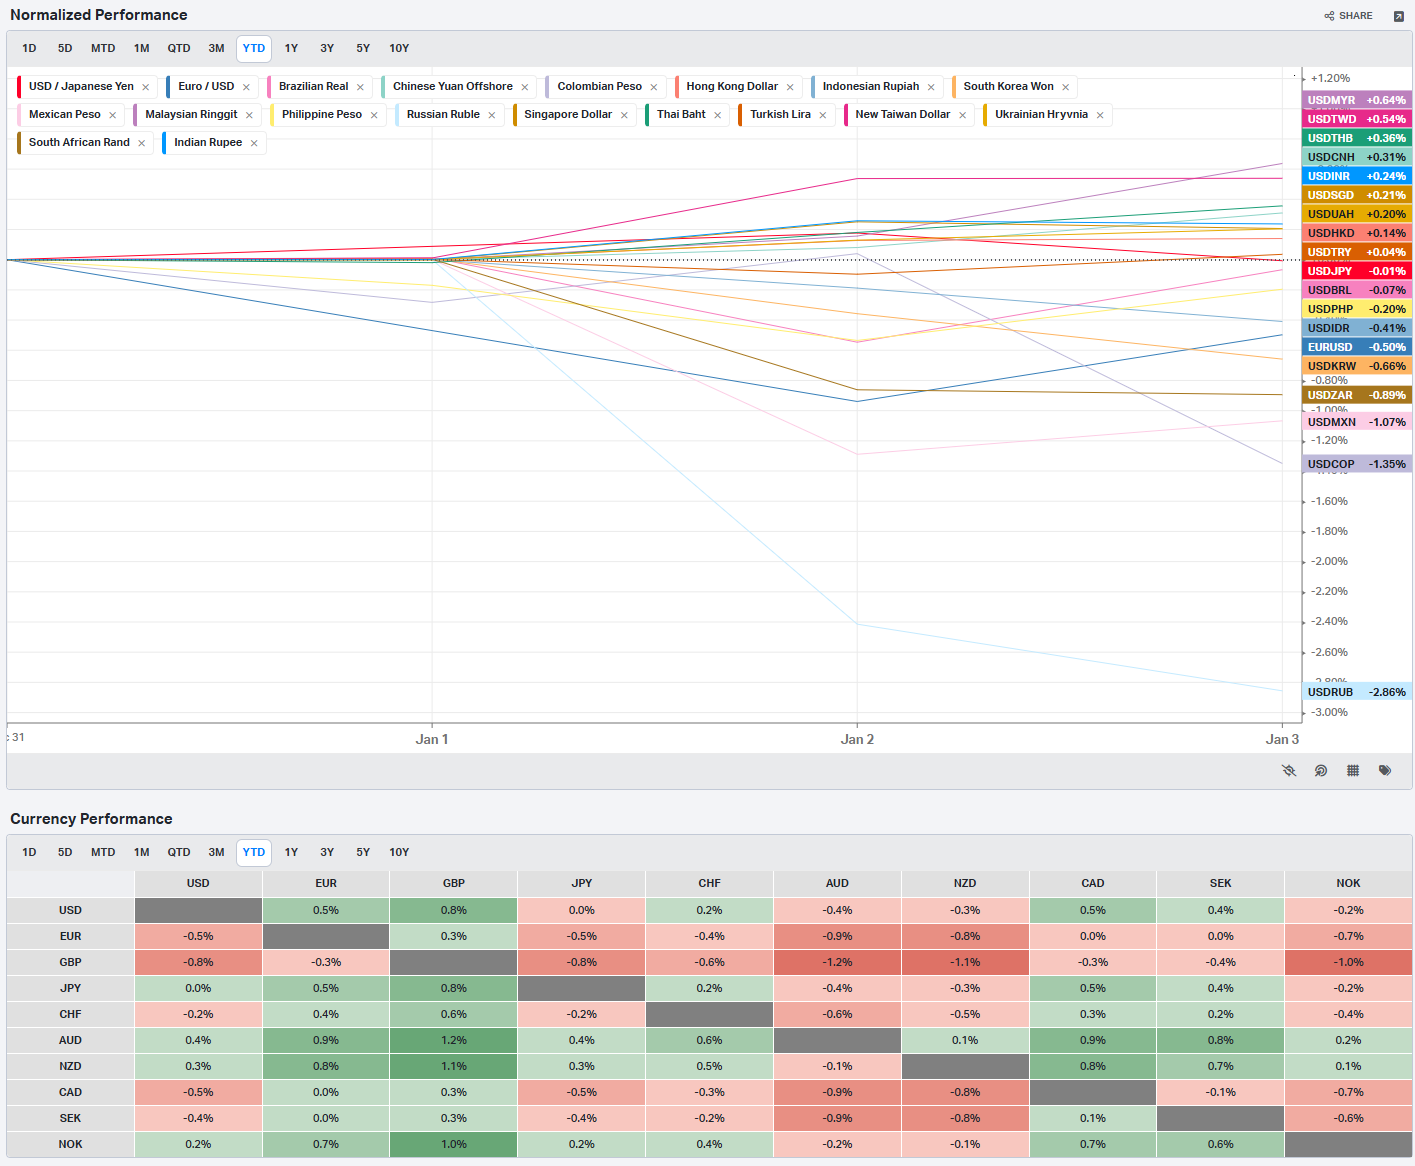
Currencies
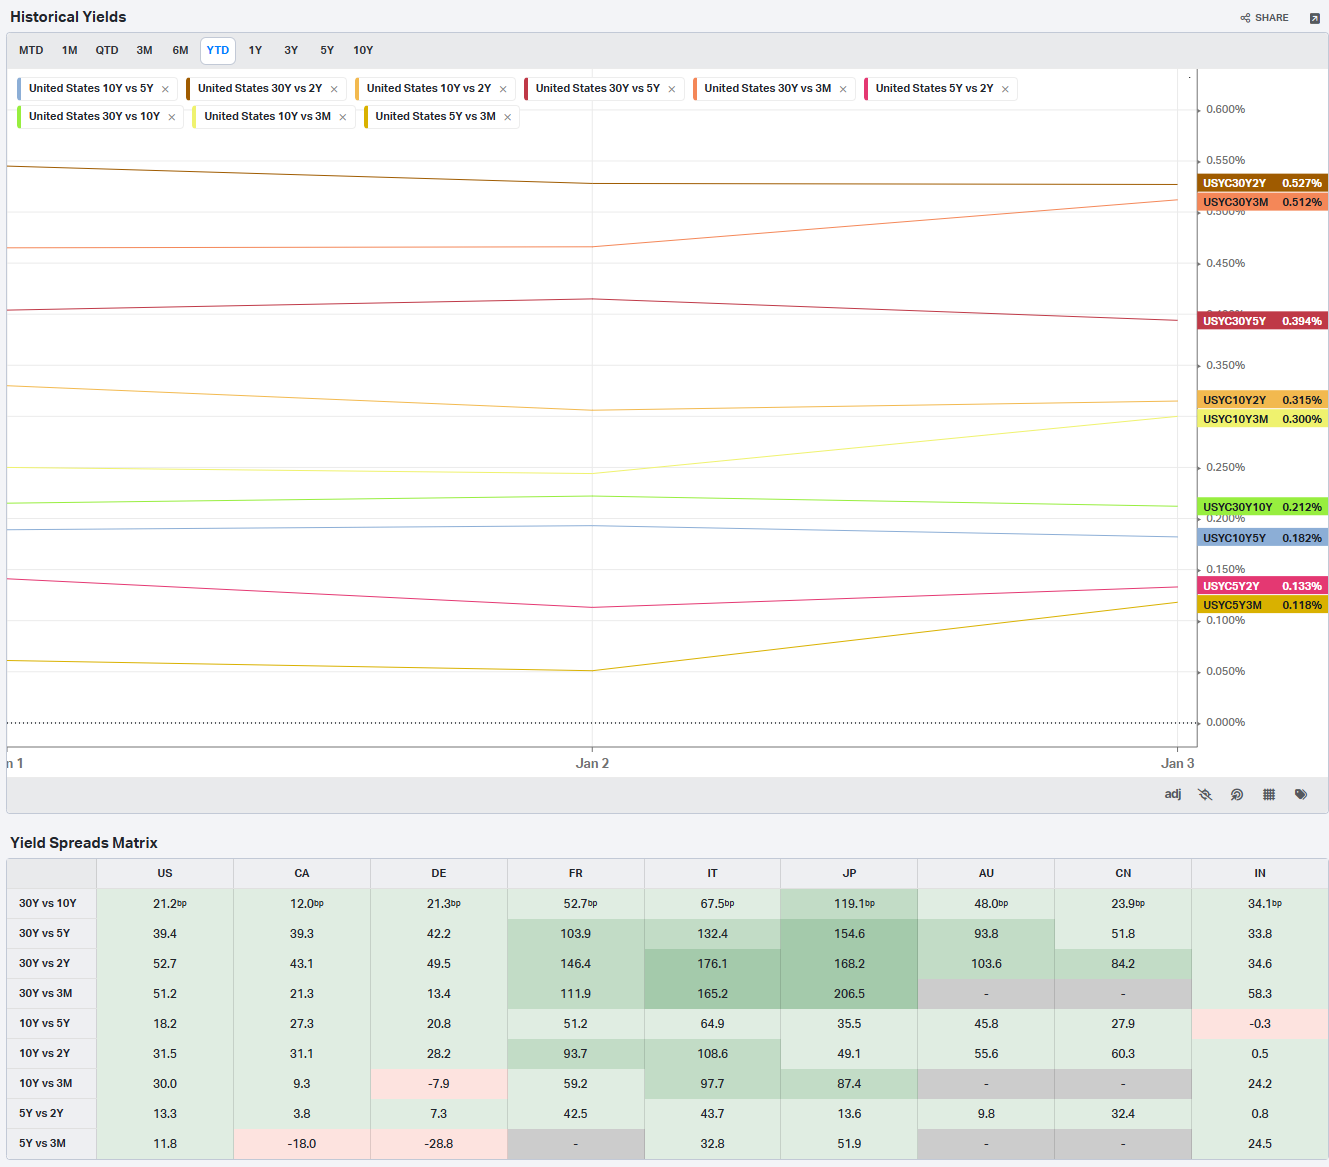
Global Yields
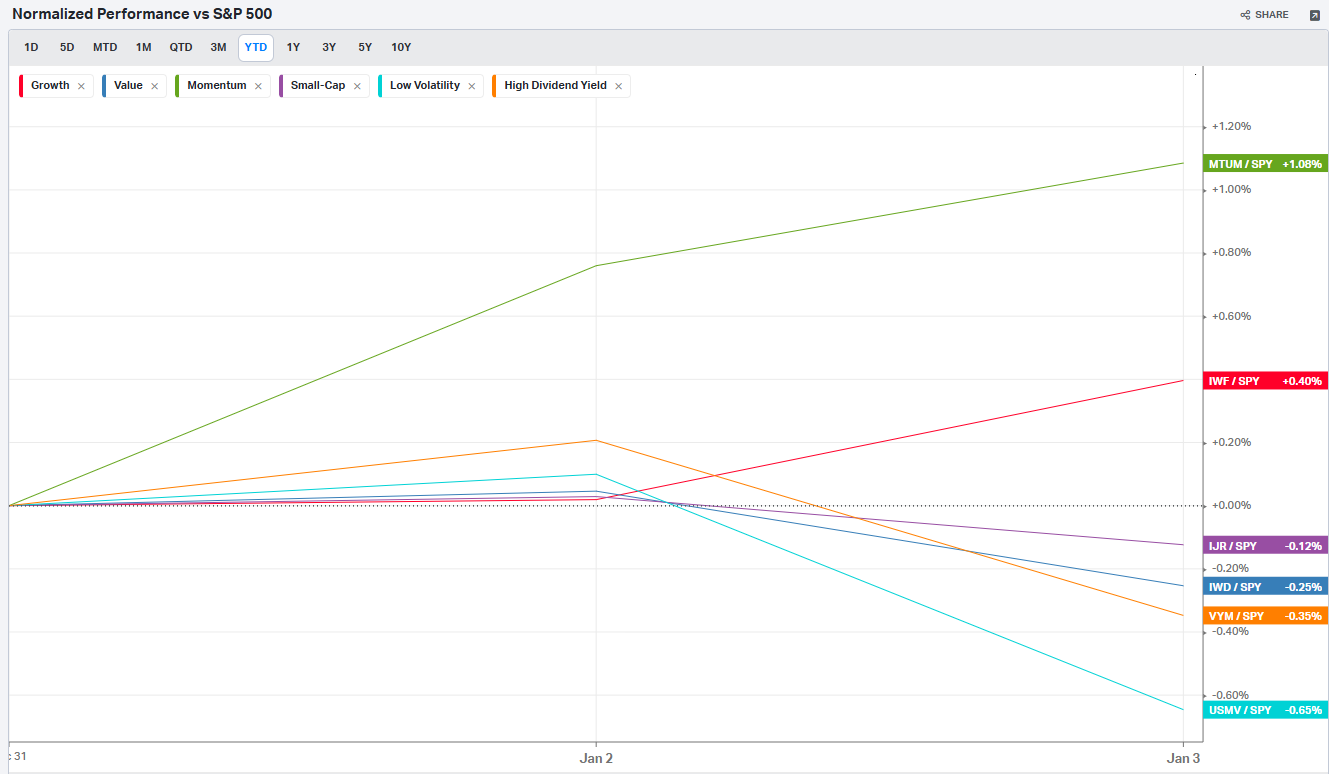
Factors: Style
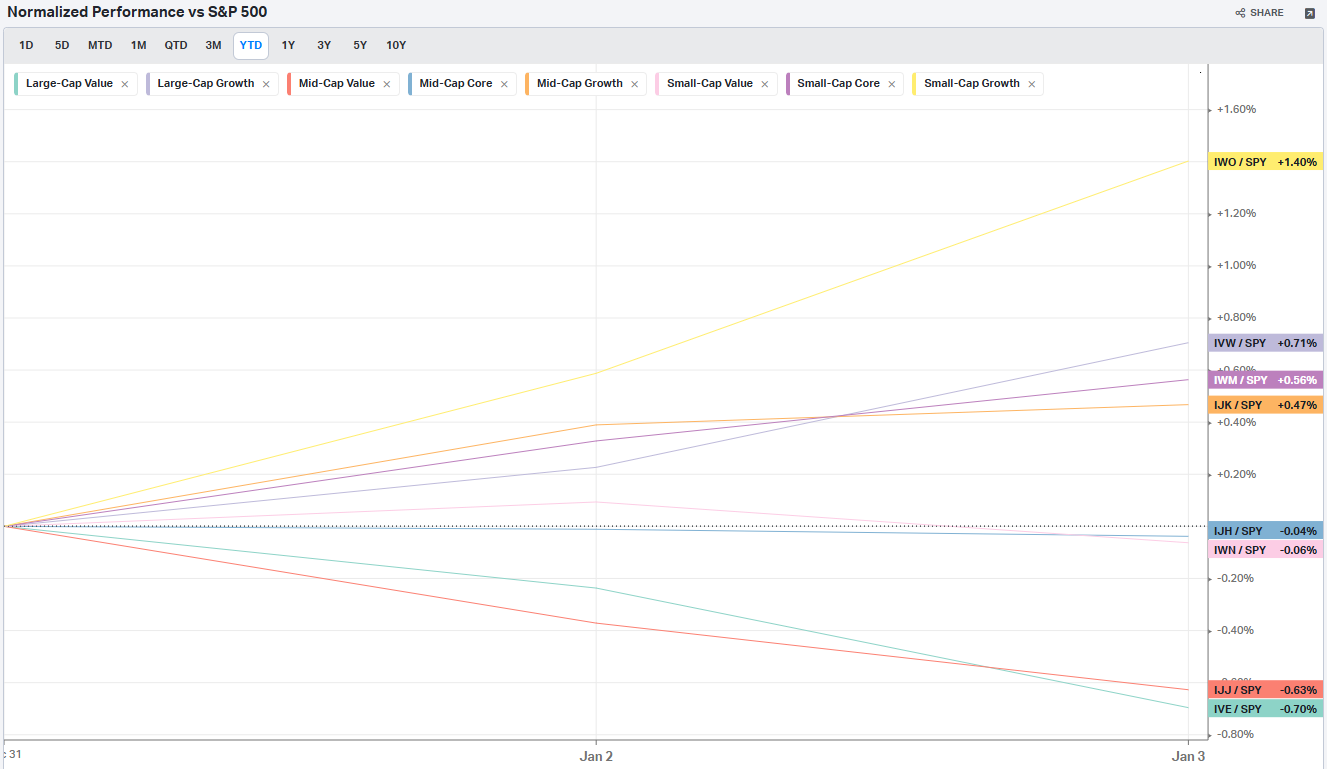
Factors: Size vs Value
Factors: Qualitative