Market Momentum: Your Weekly Financial Forecast & Market Prep
Issue 25 / What to expect Dec 16, 2024 thru Dec 20, 2024

In This Issue
Market-On-Close: All of last week’s market-moving news and macro context in under 5 minutes + futures-snapshots
Special Coverage: The Santa Claus Rally: Unpacking the Market Mechanics Behind the Year-End Surge
The Latest Investor Sentiment Readings
Institutional Support & Resistance Levels For Major Indices: Exactly where to look for a turn in markets this week in SPY, QQQ, IWM & DIA
Institutional Activity By Sector: Institutional flow by sector including the top names institutionally-backed names in those sectors
Top Institutional Orderflow In Individual Names: All of the largest sweeps and trade blocks on lit exchanges and dark pools
Investments In Focus: Bull vs Bear arguments for FTNT, VSCO, BAM, RL, MOMO, MRVL, FTXL
Top Institutionally-Backed Gainers & Losers: An explosive watchlist for day traders seeking high-volatility
Normalized Performance By Thematics YTD (Sector, Industry, Factor, Energy, Metals, Currencies, and more): which corners of the markets are beating benchmarks, which ones are overlooked and which ones are over-crowded
Key Econ Events and Earnings On-Deck For This Week

Market-On-Close
The U.S. financial markets have exhibited remarkable resilience and complexity over the past year, driven by a confluence of economic factors, corporate performance, and monetary policy shifts. Last week, this resilience was on full display as the Nasdaq Composite briefly surpassed the milestone 20,000 mark, capping off another chapter in a year characterized by strong market performance. The narrative underpinning these gains includes solid economic growth, robust corporate earnings, moderating inflation, and the initiation of monetary easing by central banks. However, as we approach 2025, signs of stalling progress in inflation improvement have introduced uncertainty into the outlook, particularly regarding the future actions of the Federal Reserve and other global central banks.
The November CPI Report: A Mixed Bag
The release of the November Consumer Price Index (CPI) offered a nuanced view of inflation's trajectory. On the one hand, the data provided some reassurance, as the results aligned with expectations, quelling fears of an inflationary resurgence. Core inflation, which excludes volatile food and energy prices, rose by 0.3%, keeping the annual rate steady at 3.3% for the third consecutive month. While this figure marks a significant decline from the 6.6% peak in 2022, it remains above the Federal Reserve's 2% target.

Notably, prices for discretionary goods and services, including cars, furniture, hotels, and airfare, accelerated during the month. This uptick likely reflects the strength of consumer spending, which has proven resilient despite economic headwinds. The impact of recent hurricanes also played a role in boosting demand and prices for certain goods, such as automobiles.

Encouragingly, shelter inflation—a key driver of price pressures in recent years—showed signs of easing. Housing costs increased by just 0.2%, the smallest monthly gain since early 2021, and the annual rate fell below 5% for the first time in over two and a half years. Market-based measures of rents and home prices suggest that this disinflationary trend may have further to go, offering hope that housing inflation will become less of a burden on the overall CPI.

Central Bank Actions: The Federal Reserve and Beyond
The Federal Reserve is widely expected to announce another rate cut following its December meeting. The November CPI data, coupled with a modest uptick in unemployment and subdued producer price inflation, have reinforced market expectations for a quarter-point reduction. Futures markets now assign a 97% probability to this outcome, reflecting heightened confidence among investors.
However, as we look ahead to 2025, the Fed faces a delicate balancing act. While the direction of monetary policy is clear—rates are expected to move lower—the pace and depth of easing remain uncertain. The Fed must navigate competing pressures, including persistent inflation, a robust labor market, and potential changes in fiscal and trade policies. Policymakers may adopt a more cautious approach in 2025, with projections suggesting a shallower rate-cutting cycle. Current forecasts point to two or three rate cuts next year, leaving the federal funds rate in the range of 3.5% to 4% by year-end.

The U.S. is not alone in grappling with these challenges. The Bank of Canada recently lowered its policy rate by half a percentage point, marking the fastest and deepest rate-cutting cycle among advanced economies. Meanwhile, the European Central Bank (ECB) and the Swiss National Bank also trimmed rates last week, citing downside risks to growth and inflation. These moves highlight the global nature of the current economic environment, where central banks are striving to strike a balance between supporting growth and containing inflation.

Market Performance: The Nasdaq Shines Amid Mixed Results
Amid these developments, the Nasdaq Composite achieved a historic milestone, briefly surpassing the 20,000 mark. This achievement underscores the strength of the technology sector, which has been a driving force behind the market's gains. Notable performers last week included semiconductor companies such as Broadcom, Nvidia, and Advanced Micro Devices, which benefited from robust demand and positive earnings results.
In contrast, the S&P 500 and Dow Jones Industrial Average faced headwinds, with the S&P posting a fractional decline and the Dow dropping nearly 2%. Large-cap growth stocks outperformed their value counterparts, continuing a year-long trend that has seen growth equities dominate. This dynamic was evident in the performance of key growth names like Tesla and Alphabet, which delivered double-digit gains last week.
Despite these gains, market breadth remains a concern. The Russell 2000 Index of smaller-cap stocks underperformed the S&P 500 for a second consecutive week, reflecting uneven participation in the rally. Sector performance was similarly mixed, with communication services and consumer discretionary leading the way, while other sectors lagged.
Inflation and Labor Market Dynamics
The interplay between inflation and labor market trends remains a focal point for policymakers and investors alike. While headline CPI ticked higher to 2.7% in November, the underlying trend suggests a deceleration in price pressures. Producer price inflation, which often serves as a leading indicator, rose by just 0.4%, and leading indicators point to a moderation in future inflation.
On the labor front, the past week's data painted a mixed picture. Initial jobless claims surged to a two-month high, raising concerns about potential softening in the labor market. Continuing claims also climbed, suggesting that unemployed individuals are taking longer to find jobs. These developments, combined with a slight uptick in the unemployment rate in November, indicate a cooling labor market that may provide the Fed with additional justification for easing monetary policy.
The Strength of the U.S. Dollar and Its Implications
The strength of the U.S. dollar has emerged as a defining feature of the current economic environment. Divergent monetary policy paths between the U.S. and other major economies have bolstered the dollar against a basket of currencies, providing both opportunities and challenges. On the one hand, a strong dollar makes imported goods cheaper, helping to moderate inflation. On the other hand, it poses headwinds for U.S. exporters and multinational companies, which must contend with reduced competitiveness abroad.
From an investment perspective, the dollar's strength has supported U.S. equities, which tend to outperform during periods of currency appreciation. However, it has weighed on international and emerging market stocks, contributing to their relative underperformance.
Investor Sentiment and Market Outlook
Investor sentiment has remained buoyant, supported by strong economic data and the prospect of pro-growth policies following the U.S. presidential election. The NFIB Small Business Optimism Index recorded its largest monthly jump in three decades, reflecting renewed confidence among business owners. Capital spending, which had been delayed due to election uncertainty, is expected to rebound, potentially sustaining economic momentum into 2025.

However, elevated sentiment comes with risks. As expectations rise, the market becomes more vulnerable to periodic disappointments. The third year of a bull market is historically choppier, and with borrowing costs expected to remain relatively high, valuations may face limitations.
Conclusion: A Winning Formula Amid Uncertainty
As we close the year, the U.S. financial markets continue to demonstrate resilience in the face of uncertainty. The winning formula—comprising strong economic growth, rising corporate profits, moderating inflation, and monetary easing—remains largely intact. While challenges lie ahead, including the potential for slower disinflation and a more cautious Fed, the backdrop remains broadly supportive of balanced and diversified portfolios.
Looking ahead, the direction of monetary policy, the trajectory of inflation, and the health of the labor market will be key determinants of market performance. For investors, the focus should remain on long-term fundamentals, with an eye toward managing risks and capitalizing on opportunities in a dynamic and evolving landscape.
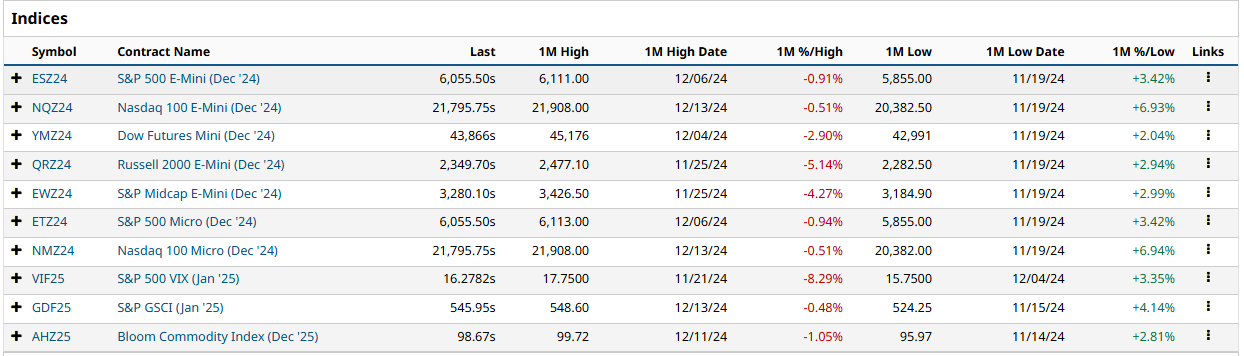
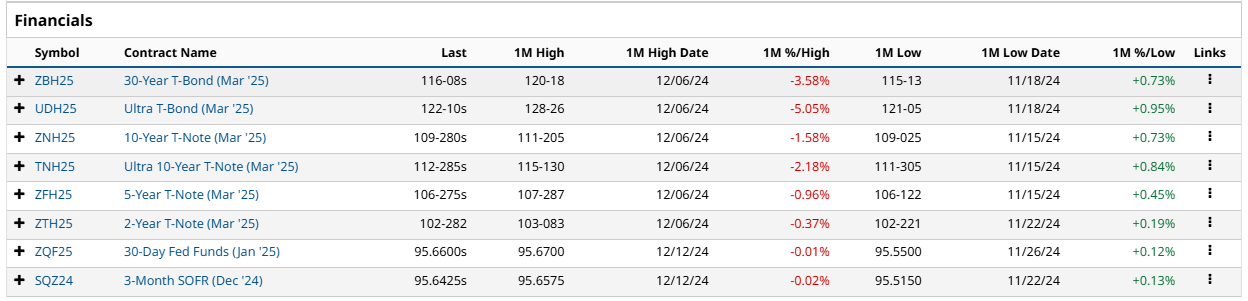
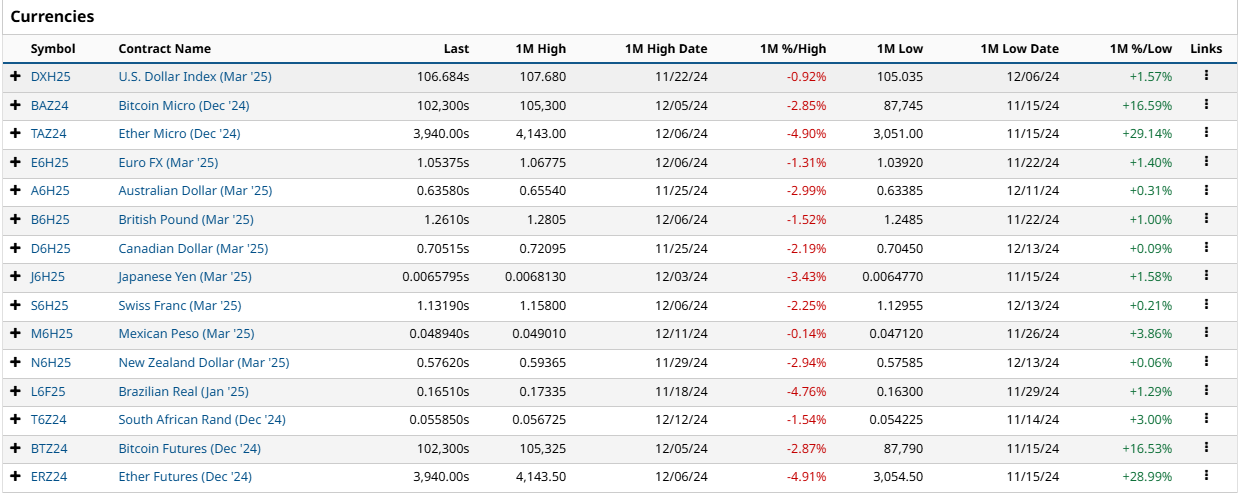
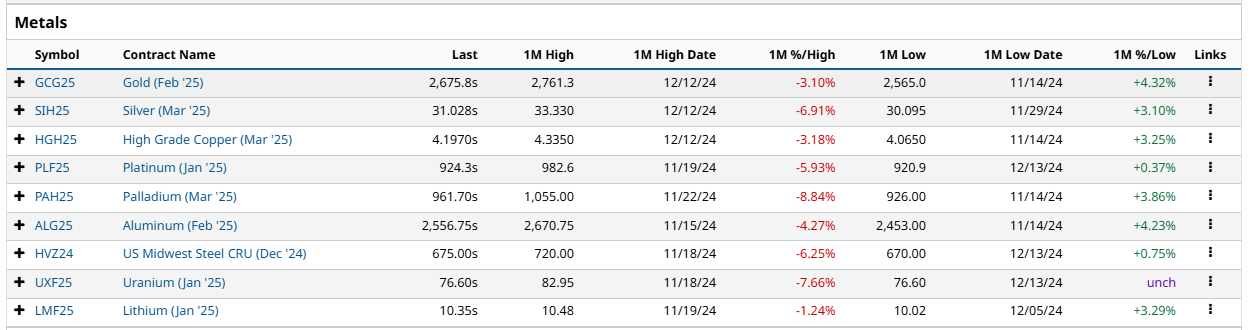
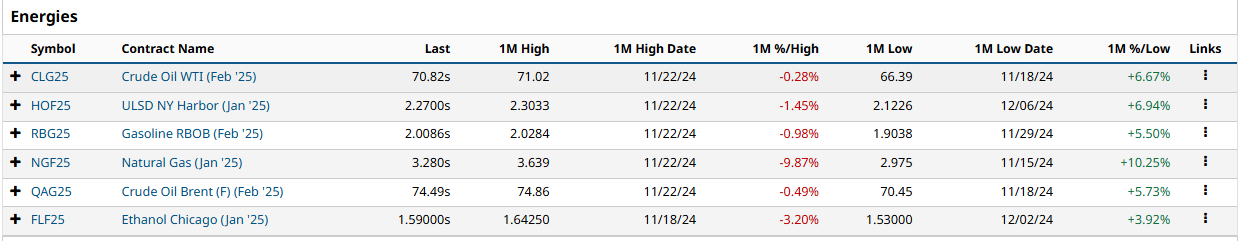
Futures Markets Snapshots
S&P 500: Sector Insights
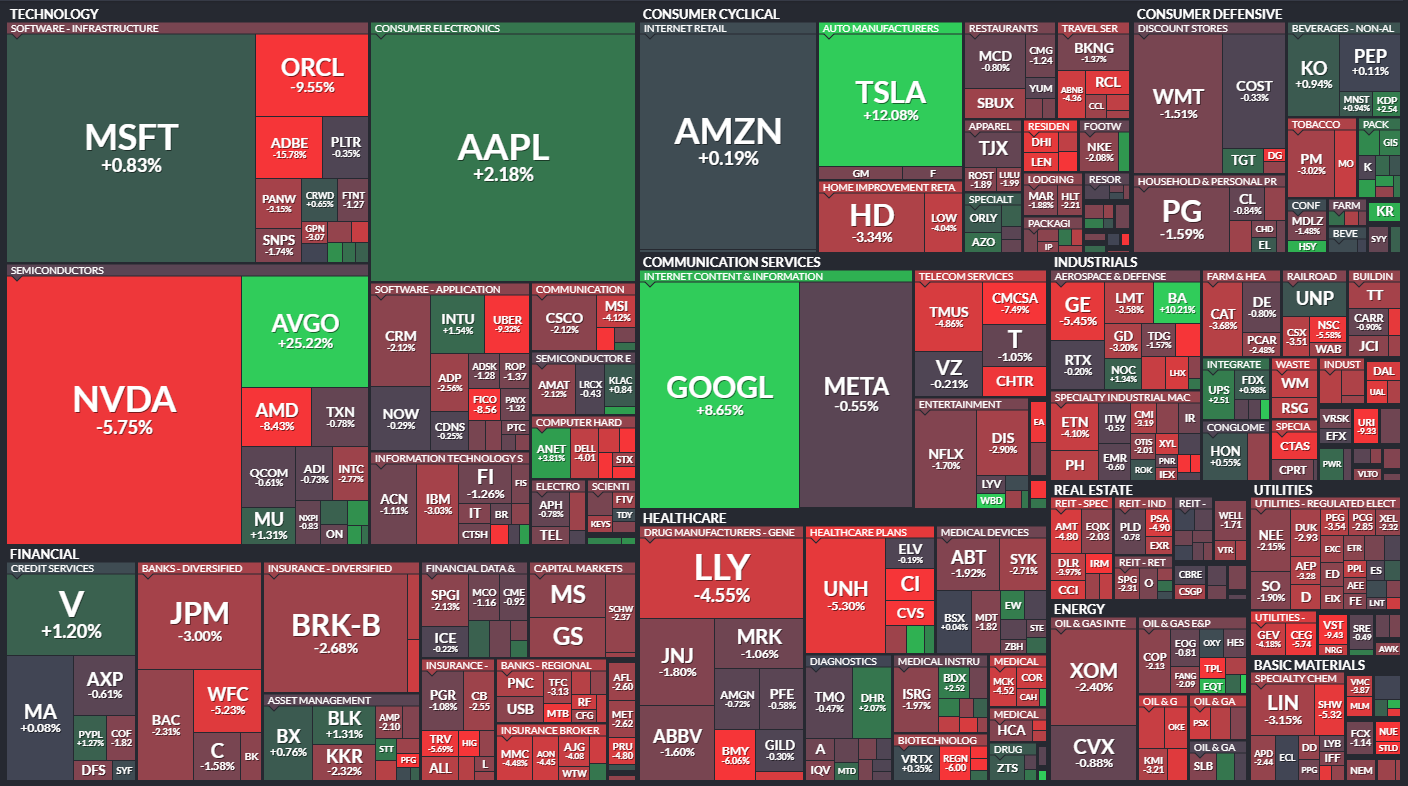
Technology Sector:
Broadcom (AVGO): Shares surged 24.4% to a record high, elevating its market capitalization above $1 trillion. This leap was driven by robust earnings and a significant increase in AI-related sales.
Nvidia (NVDA): Despite the sector's overall strength, Nvidia's stock declined by 2.2%, potentially due to rising competition in the AI chip market.
Consumer Discretionary Sector:
Tesla (TSLA): The stock jumped 5.9% to a record high, bolstered by plans to develop a more affordable vehicle and favorable analyst ratings.
Lamb Weston (LW): Shares rose 6.8% amid buyout discussions with Post Holdings.
Healthcare Sector:
Walgreens Boots Alliance (WBA): The stock gained 6.8% following reports of potential acquisition talks with Sycamore Partners.
Industrials Sector:
Nucor (NUE): Shares fell nearly 4.7% after a downgrade from UBS, reflecting concerns over the steelmaker's valuation.
Communication Services Sector:
Alphabet (GOOG): The stock declined by 1.1%, contributing to the sector's underperformance.
Overall, the S&P 500 remained relatively flat for the week, with gains in technology and consumer discretionary sectors offset by declines in others.
ETF Insights
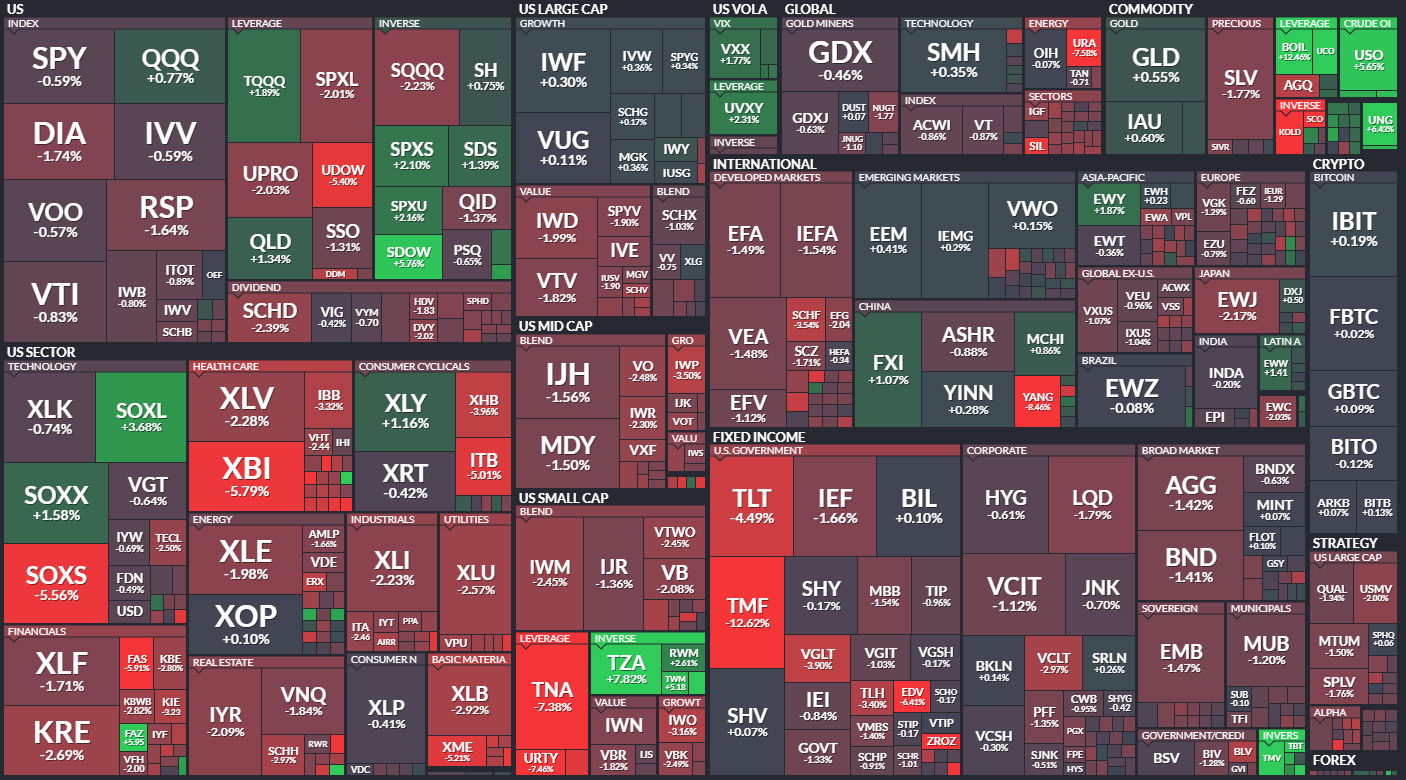
US Large Cap ETFs:
QQQ (+0.77%): The Nasdaq-focused ETF showed resilience, driven by strong performances in the technology sector, particularly in AI-related stocks. Microsoft (MSFT) and Nvidia (NVDA), key components of QQQ, remained influential despite mixed individual performances.
SPY (-0.59%) and VOO (-0.57%): The broader S&P 500 ETFs dipped slightly, reflecting overall market caution amid mixed sector performance. The weakness in financials and healthcare weighed heavily.
Leveraged ETFs:
SOXL (+3.68%): This triple-leveraged semiconductor ETF outperformed, boosted by a rebound in chip stocks like Broadcom (AVGO) and improved sentiment in AI-related industries.
SOXS (-5.56%): The inverse semiconductor ETF tumbled as bullish momentum in semiconductors took hold this week.
TNA (-7.38%): The small-cap leveraged ETF faced significant losses, as small-cap stocks continued to underperform in a challenging market environment, reflecting broader economic concerns.
US Sector ETFs:
XLY (+1.16%): Consumer discretionary ETFs gained modestly, led by strong performances from Tesla (TSLA) and other cyclical names. However, homebuilders like ITB (-5.01%) faced headwinds due to concerns over higher interest rates impacting housing demand.
XLV (-2.28%): The healthcare ETF saw significant declines, dragged down by underperformance in major pharmaceutical stocks like Eli Lilly (LLY) and UnitedHealth (UNH).
XLE (-1.98%): Energy ETFs declined as oil prices softened slightly despite volatility earlier in the week. Major names like ExxonMobil (XOM) and Chevron (CVX) faced selling pressure.
Global Markets:
EFA (-1.24%) and IEFA (-1.12%): Developed market ETFs posted losses amid ongoing concerns about slower growth in Europe and weaker-than-expected data from Japan.
MCHI (+0.86%): China-focused ETFs saw modest gains as Beijing announced additional stimulus measures to boost economic activity, aiding sentiment around Chinese equities.
Fixed Income:
TLT (-4.49%) and TMF (-12.62%): Long-duration Treasury ETFs fell sharply as bond yields surged, reflecting the market's ongoing adjustment to a higher-for-longer rate environment.
IEF (-1.66%): Intermediate-term Treasury ETFs were also under pressure, albeit to a lesser extent, as investors reassessed fixed-income positions.
BND (-1.41%): Broad bond ETFs declined across the board, weighed by rising yields and concerns about future rate hikes.
Commodity and Energy ETFs:
USO (+5.65%): Crude oil ETFs gained strongly, supported by geopolitical tensions in the Middle East and OPEC+ production cut talks, although broader energy stocks failed to capitalize.
GLD (+0.55%) and SLV (-1.77%): Gold held steady, reflecting a modest safe-haven bid, while silver struggled, pressured by industrial demand concerns.
Cryptocurrency ETFs:
BITO (+0.19%) and GBTC (+0.02%): Crypto-linked ETFs were flat to slightly positive as Bitcoin stabilized after recent gains, reflecting investor caution amid regulatory uncertainty.
The ETF landscape this week showcased divergent performances, with technology and consumer discretionary sectors leading gains while small caps, healthcare, and fixed-income ETFs underperformed. Rising bond yields and mixed global economic signals weighed on broader markets, creating a challenging environment for most equity and bond ETFs. Semiconductors and energy commodities were bright spots, highlighting selective areas of strength.

[Special Coverage] The Santa Claus Rally: Unpacking the Market Mechanics Behind the Year-End Surge
The "Santa Claus Rally" is a well-documented phenomenon in financial markets, describing the tendency for stock markets to rise during the last week of December and the first two trading days of January. This seemingly magical year-end surge has fascinated traders and investors for decades, prompting many to seek out the underlying mechanics driving this seasonal trend. While the rally might appear to be a quirk of holiday cheer, it is rooted in a mix of behavioral, seasonal, and structural market factors—including institutional options positioning, tax considerations, and investor sentiment. We cover some of these dynamics and shed light on why the Santa Claus Rally occurs and how it continues to influence market behavior.
Behavioral and Seasonal Factors
1. Tax-Loss Harvesting and Portfolio Rebalancing
One of the most prominent drivers of the Santa Claus Rally is the phenomenon of tax-loss harvesting. Investors often sell underperforming stocks at year-end to offset capital gains and reduce their tax liabilities. This selling pressure, which peaks in early December, temporarily depresses prices. As the tax-loss harvesting season concludes, the absence of selling pressure allows markets to rebound.
Simultaneously, institutional investors engage in portfolio rebalancing, aligning their holdings with annual targets or client mandates. This activity often involves buying high-performing stocks to "window dress" portfolios, making them appear more attractive in year-end reports. Combined, these actions create a favorable environment for a year-end rally.
2. Positive Holiday Sentiment
The holiday season is a time of optimism and goodwill, which often extends to investor behavior. Positive sentiment—fueled by end-of-year festivities and anticipation for the new year—can drive buying activity. This sentiment-driven behavior reinforces upward market momentum.
3. Retail Investor Activity
The holiday season often brings year-end bonuses and tax refunds, some of which find their way into the stock market. Retail investors, encouraged by holiday optimism and spare cash, contribute to increased buying pressure during this period.
Market Structure and Options Dynamics
1. Gamma Squeezes: Dealers and Hedging Dynamics
A significant yet often overlooked contributor to the Santa Claus Rally is the impact of institutional options positioning. Dealers, who sell options contracts to traders, manage their risk through hedging.
Gamma Exposure: When dealers are short gamma (as they often are when selling options), they must buy the underlying asset as prices rise to maintain a delta-neutral position. During the holiday season, as positive sentiment and low liquidity push stock prices upward, dealer hedging amplifies the rally through continuous buying.
2. Low Volatility and Charm Effects
The holiday season typically features reduced trading volumes as institutional desks slow down for the year-end break. Lower liquidity often coincides with lower implied volatility (IV) in the options market. This dynamic creates two key effects:
Charm: As options near expiration, their delta (sensitivity to price changes) decreases due to time decay. Dealers must adjust their hedges by buying the underlying stock, reinforcing upward pressure.
Vanna: Declining implied volatility reduces the need for dealers to hedge their positions, which often involves buying back underlying assets, further boosting prices.
3. Options Expiration and Roll Effects
The month of December is crucial for the options market, as it marks the expiration of quarterly and annual options contracts. These expirations often necessitate significant adjustments:
Hedging for Expiration: As options near expiration, institutions and dealers unwind positions, leading to increased trading in the underlying assets. In bullish environments, this can amplify upward price movements.
Rolling Positions: Investors and institutions roll their expiring options into future months, creating demand for both options and the underlying stocks.
The cumulative effect of these adjustments can provide an additional tailwind for stocks heading into the new year.
4. Window Dressing by Institutions
Window dressing—the practice of adding well-performing stocks to portfolios for year-end reporting—is another structural factor. This institutional buying creates additional demand for already strong stocks, driving their prices higher and contributing to the broader rally.
These flows are particularly pronounced in December due to the confluence of options expirations and reduced liquidity.
Sentiment and Anticipation for the January Effect
The "January Effect," a related seasonal phenomenon, describes the tendency for stocks—particularly small-cap stocks—to outperform in the first month of the year. Investors anticipating this trend often position themselves in late December, contributing to the Santa Claus Rally.
Additionally, market participants may front-run expected inflows from pension funds and other institutional investors, creating a virtuous cycle of buying that feeds the rally.
Conclusion
The Santa Claus Rally is more than just a seasonal curiosity—it is a reflection of deep-seated market mechanics, behavioral tendencies, and structural dynamics. From tax-loss harvesting and retail buying to the complex interplay of options hedging and institutional rebalancing, a myriad of factors converge to create the year-end surge. Understanding these forces provides traders and investors with a roadmap to navigate and capitalize on this seasonal phenomenon.
By appreciating the underlying mechanics—especially the role of institutional options positioning—market participants can better prepare for the opportunities and risks that accompany the rally. While the Santa Claus Rally may be steeped in tradition, its drivers are anything but magical; they are rooted in the very structure of financial markets, making it a predictable and exploitable pattern for those who understand its nuances.

US Investor Sentiment
Insider Trading
Insider trading occurs when a company’s leaders or major shareholders trade stock based on non-public information. Tracking these trades can reveal insider expectations about the company’s future. For example, large purchases before an earnings report or drug trial results might indicate confidence in upcoming good news.
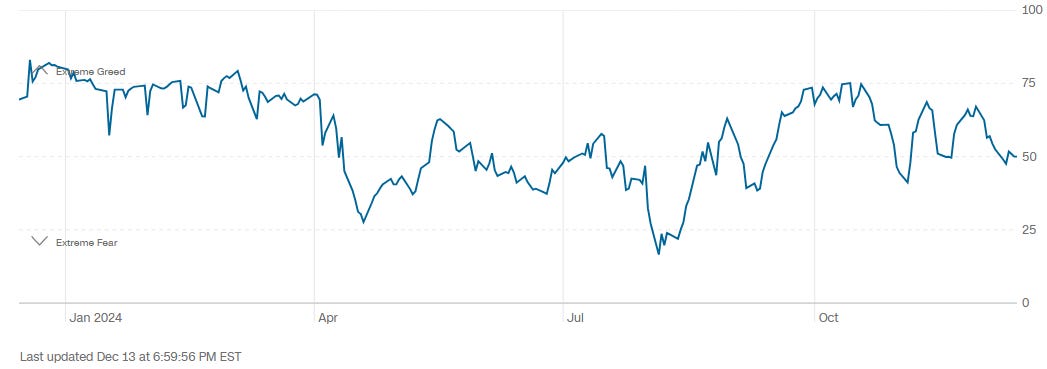
%Bull-Bear Spread
The %Bull-Bear Spread chart is a sentiment indicator that shows the difference between the percentage of bullish and bearish investors, often derived from surveys or sentiment data, such as the AAII (American Association of Individual Investors) sentiment survey. This spread tells investors about the prevailing mood in the market and can provide insights into market extremes and potential turning points.
Bullish or Bearish Sentiment:
When the spread is positive, it means more investors are bullish than bearish, indicating optimism about the market’s direction.
A negative spread indicates more bearish sentiment, meaning more investors expect the market to decline.
Contrarian Indicator:
The %Bull-Bear Spread is often used as a contrarian indicator. For example, extremely high levels of bullish sentiment might suggest that the market is overly optimistic and could be due for a correction.
Similarly, when bearish sentiment is extremely high, it might indicate that the market is overly pessimistic, and a rally could be on the horizon.
Market Extremes and Reversals:
Historically, extreme values of the spread (both positive and negative) can signal turning points in the market. A very high positive spread can signal market exuberance, while a very low or negative spread may indicate fear or capitulation.
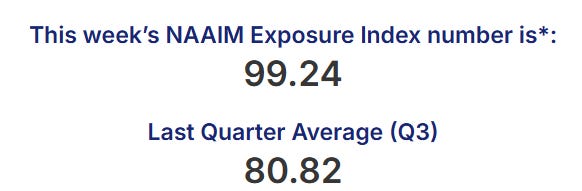
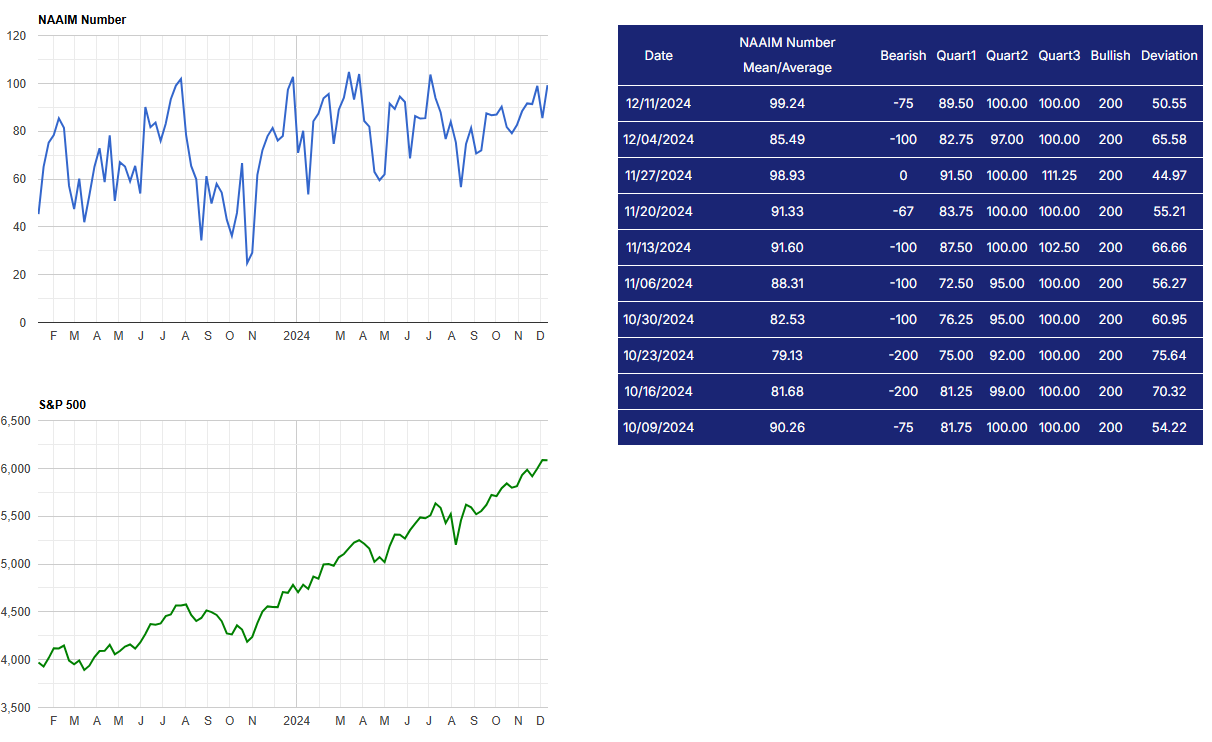
NAAIM Exposure Index
The NAAIM Exposure Index (National Association of Active Investment Managers Exposure Index) measures the average exposure to U.S. equity markets as reported by its member firms. These are typically active money managers who provide their equity exposure levels weekly. The index offers insight into how much these managers are investing in equities at any given time, ranging from being fully short (-100%) to leveraged long (up to +200%).
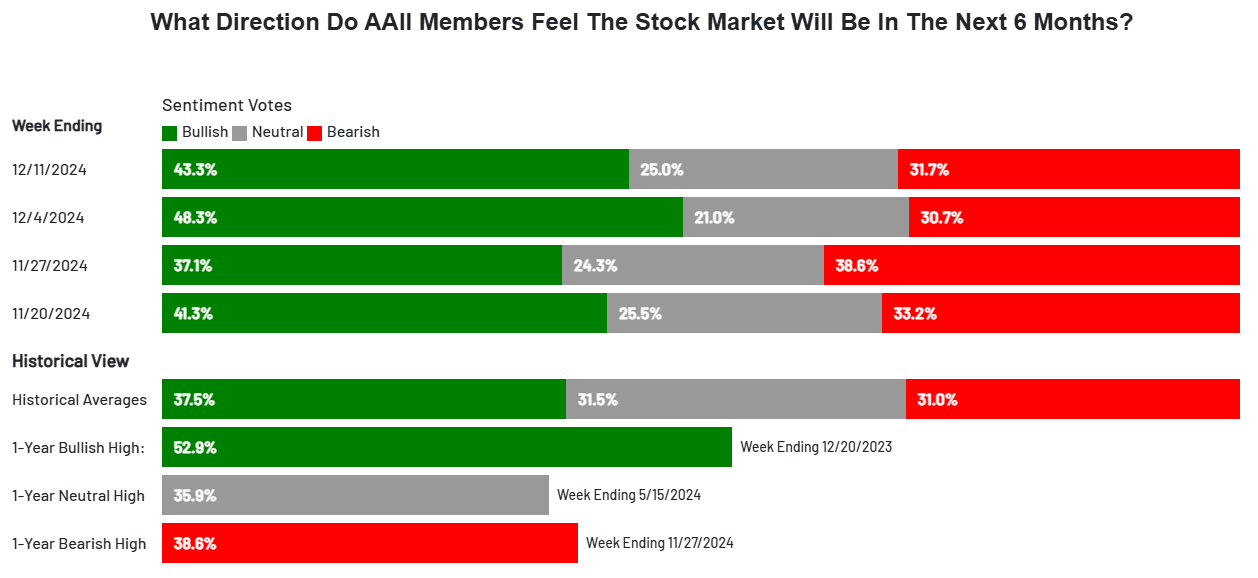
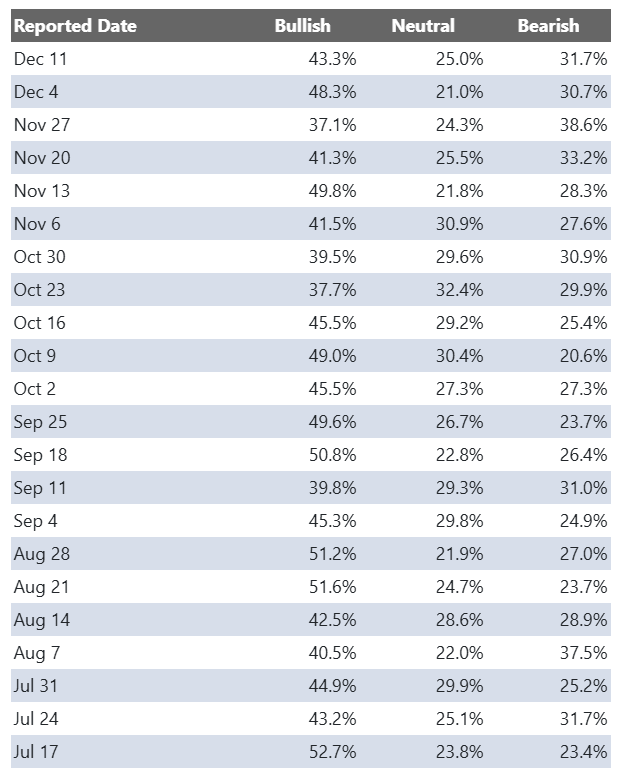
AAII Investor Sentiment Survey
The AAII Investor Sentiment Survey is a weekly survey conducted by the American Association of Individual Investors (AAII) to gauge the mood of individual investors regarding the direction of the stock market over the next six months. It provides insights into whether investors are feeling bullish (expecting the market to rise), bearish (expecting the market to fall), or neutral (expecting the market to stay about the same).
Key Points:
Bullish Sentiment: Reflects the percentage of investors who believe the stock market will rise in the next six months.
Bearish Sentiment: Represents those who expect a decline.
Neutral Sentiment: Reflects investors who anticipate little to no market movement.
The survey is widely followed as a contrarian indicator, meaning that extreme levels of bullishness or bearishness can sometimes signal market turning points. For example, when a large number of investors are overly optimistic (high bullish sentiment), it could suggest a market top, while excessive pessimism (high bearish sentiment) may indicate a market bottom is near.
SPX Put/Call Ratio
The SPX Put/Call Ratio is an indicator that is used to gauge market sentiment. This is calculated as the ratio between trading S&P 500 put options and S&P call options. A high put/call ratio can indicate fear in the markets, while a low ratio indicates confidence. For example, in 2015, the Put-Call ratio was as high as 3.77 because of market fears stemming from various global economic issues like a GDP growth slowdown in China and a Greek debt default.
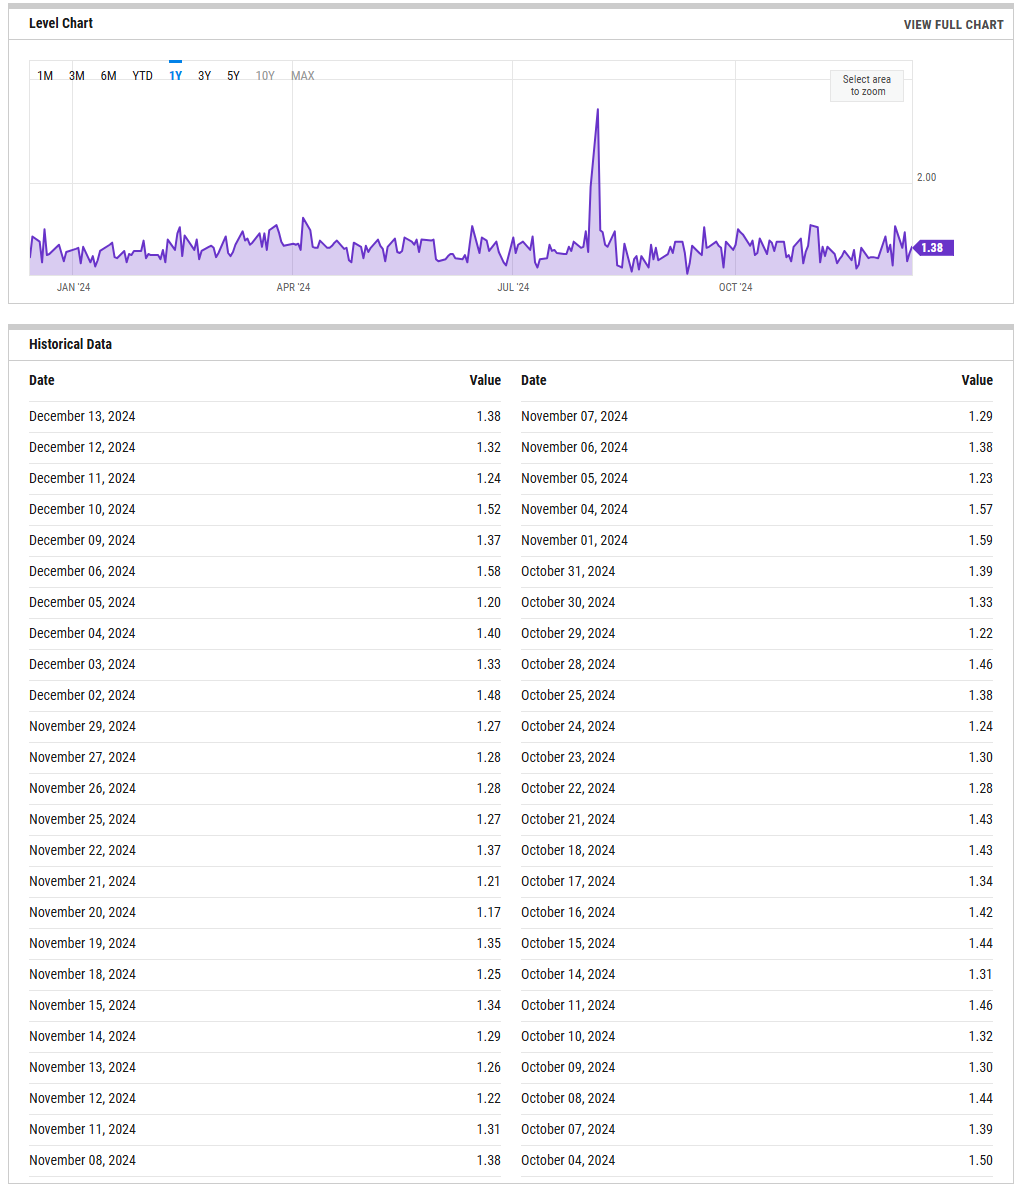
CBOE Equity Put/Call Ratio
The CBOE (Chicago Board Options Exchange) equity put/call ratio is a sentiment indicator used by traders and analysts to gauge market sentiment and potential shifts in investor behavior. It is calculated by dividing the volume of put options by the volume of call options on equities. Here’s what it reveals and how it is generally interpreted:
High Put/Call Ratio: When the put/call ratio is high (above 1.0), it suggests that there is more demand for put options than call options. This typically reflects a more bearish sentiment, as investors may be hedging against potential declines or expecting the market to fall.
Low Put/Call Ratio: Conversely, a low put/call ratio (below 0.7) indicates a higher volume of call options compared to puts, reflecting bullish sentiment. Investors may be expecting upward momentum and are positioning themselves to profit from price gains
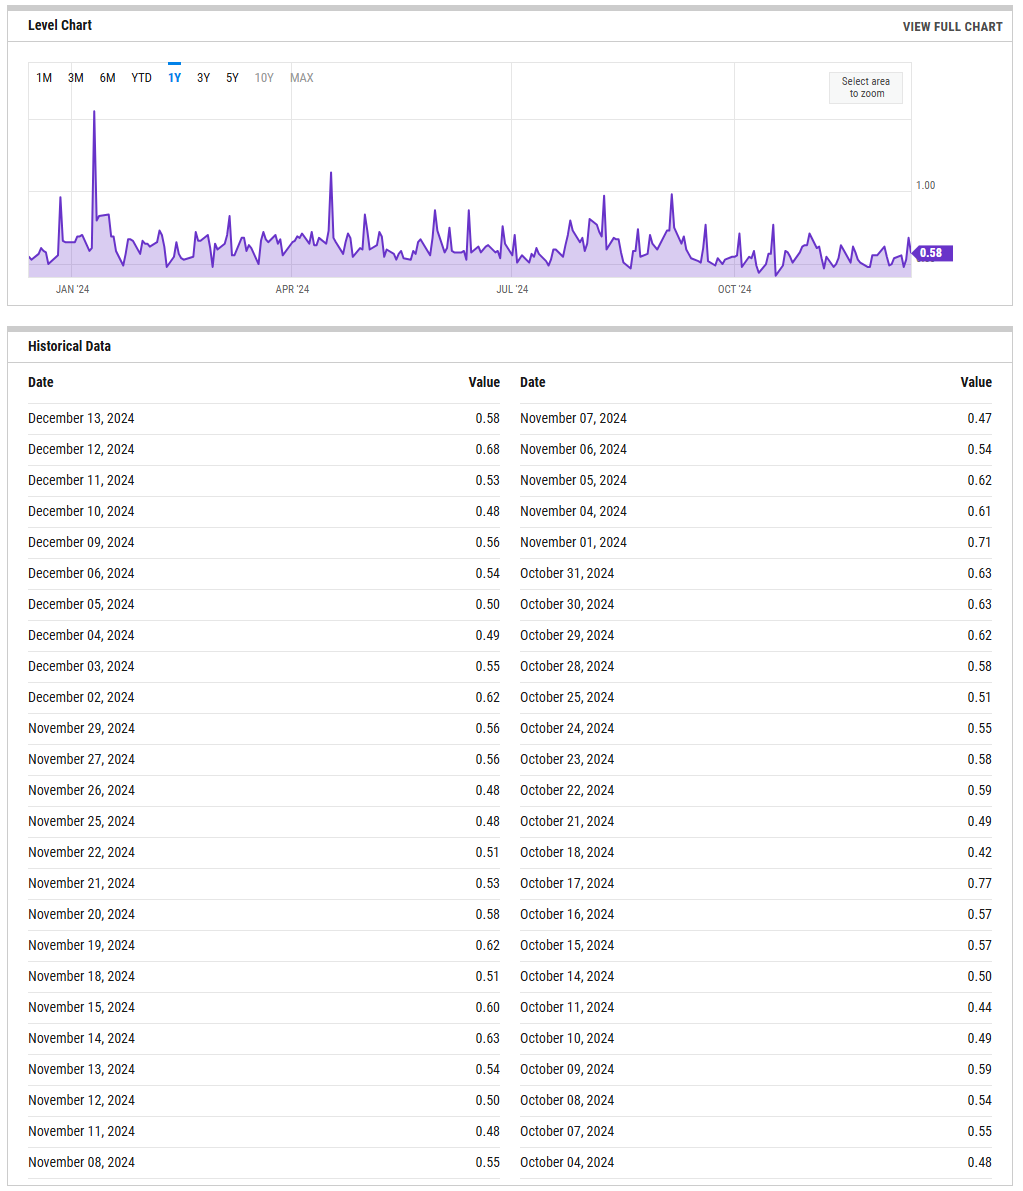
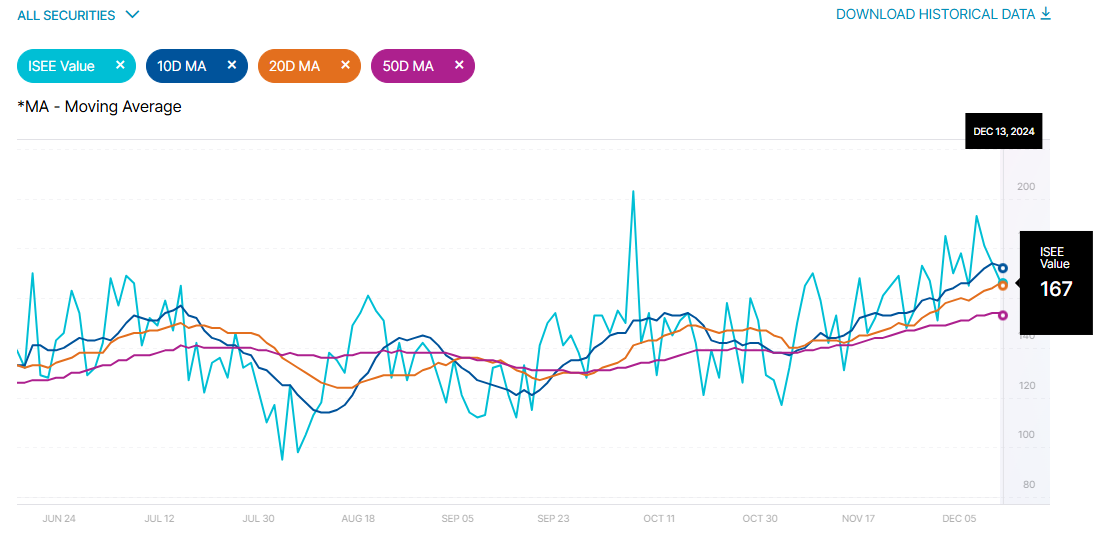
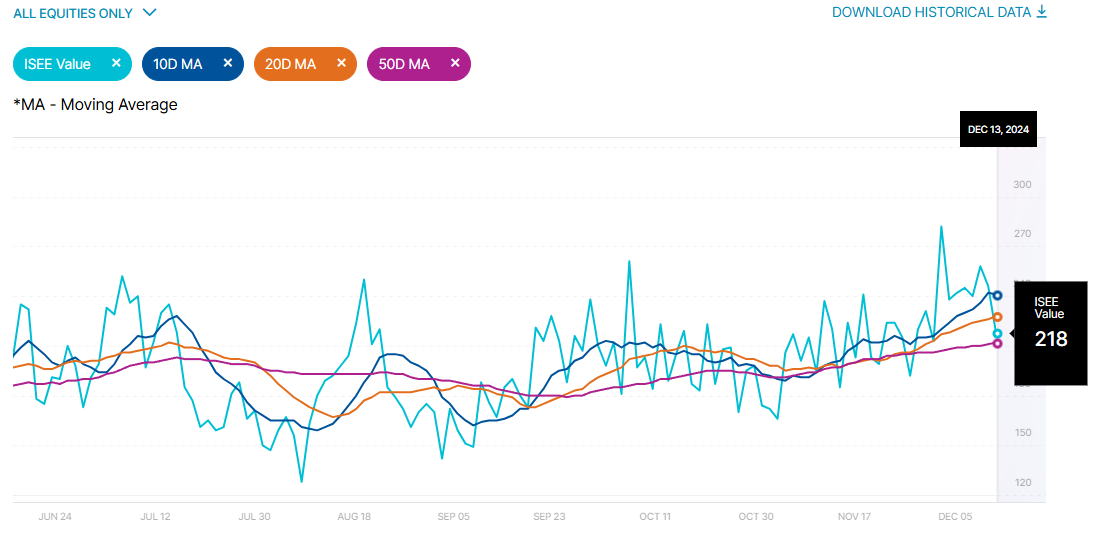
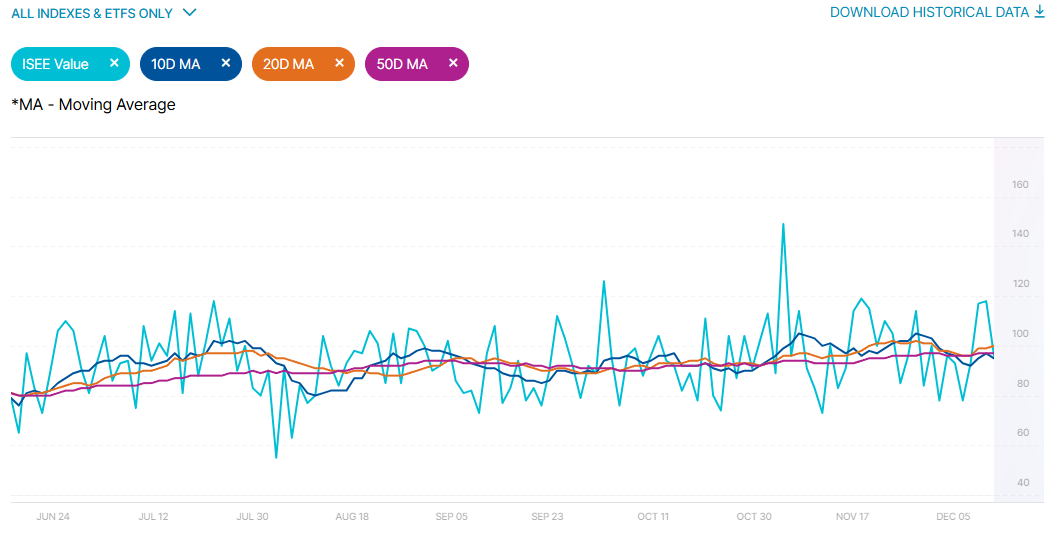
ISEE Sentiment Index
The ISEE (International Securities Exchange Sentiment) Index is a measure of investor sentiment derived from options trading. Unlike traditional put/call ratios, the ISEE Index focuses only on opening long customer transactions and is adjusted to remove market-maker and firm trades, providing a purer sentiment reading.
The ISEE Index typically ranges from 0 to 200, with readings above 100 indicating more call options being bought relative to put options, suggesting bullish sentiment. Conversely, readings below 100 suggest bearish sentiment, with more puts being purchased relative to calls.
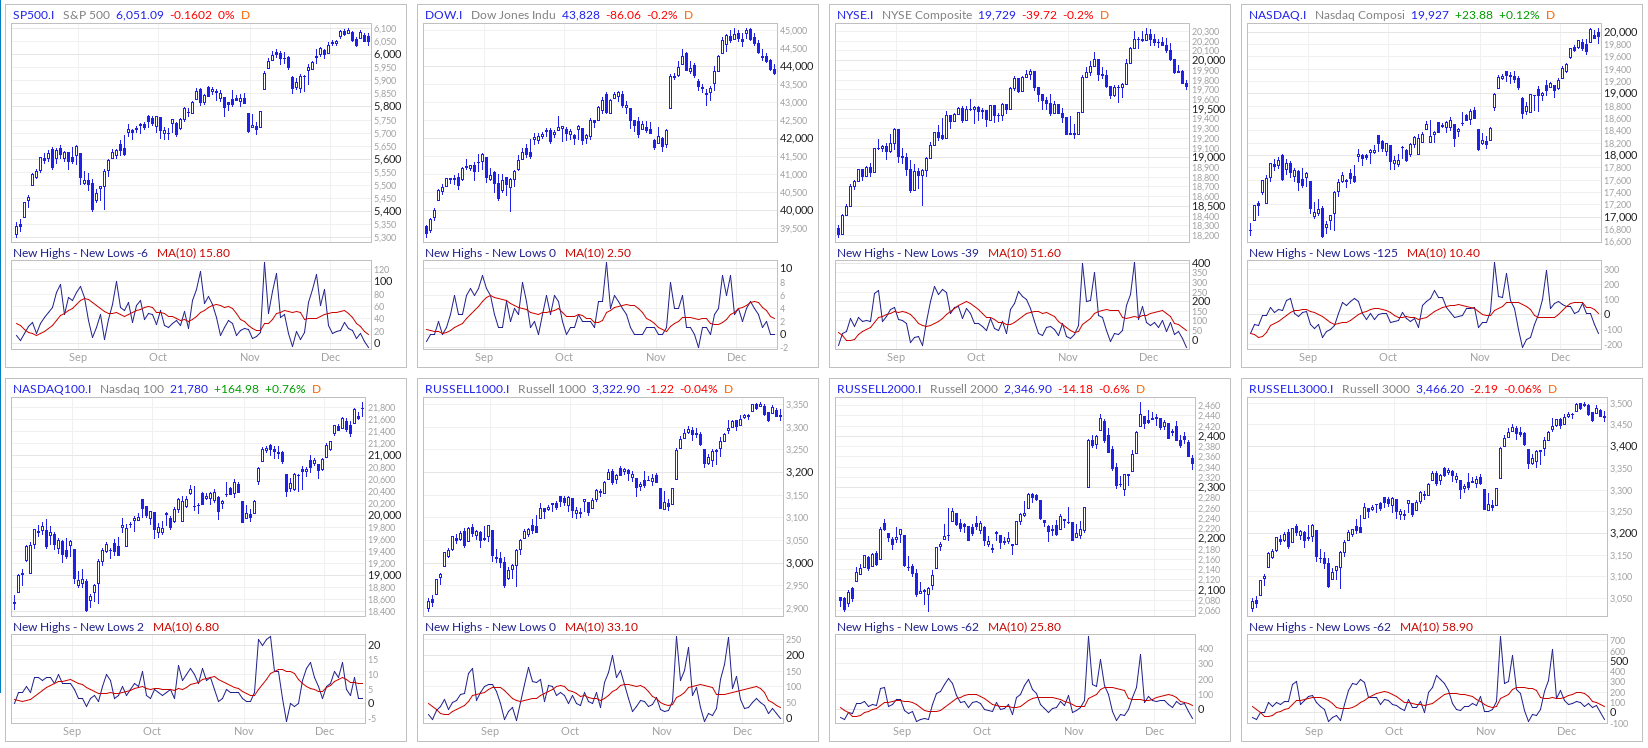
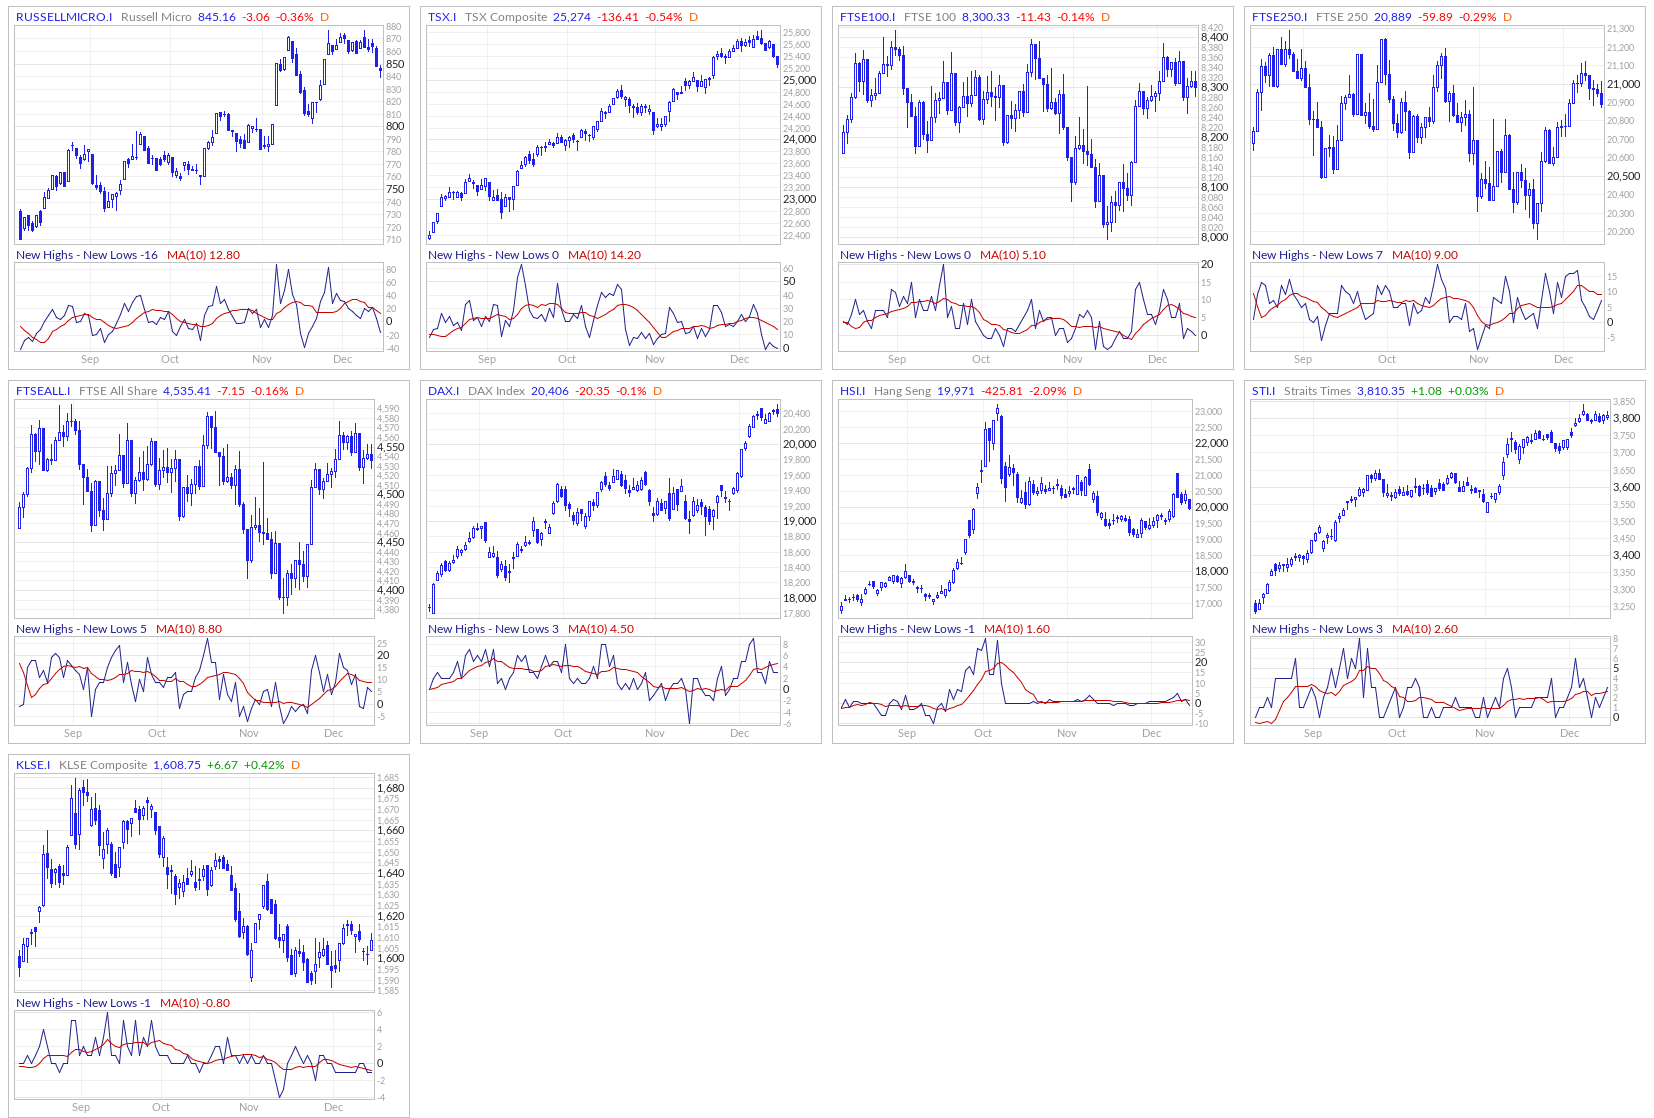
New Highs - New Lows
The New Highs - New Lows indicator (NH-NL) displays the daily difference between the number of stocks reaching new 52-week highs and the number of stocks reaching new 52-week lows. The NH-NL indicator generally reaches its extreme lows slightly before a major market bottom. As the market then turns up from the major bottom, the indicator jumps up rapidly. During this period, many new stocks are making new highs because it's easy to make a new high when prices have been depressed for a long time. The NH-NL indicator oscillates around zero. If the indicator is positive, the bulls are in control. If it is negative, the bears are in control. As the cycle matures, a divergence often occurs as fewer and fewer stocks are making new highs (the indicator falls), yet the market indices continue to reach new highs. This is a classic bearish divergence that indicates that the current upward trend is weak and may reverse.
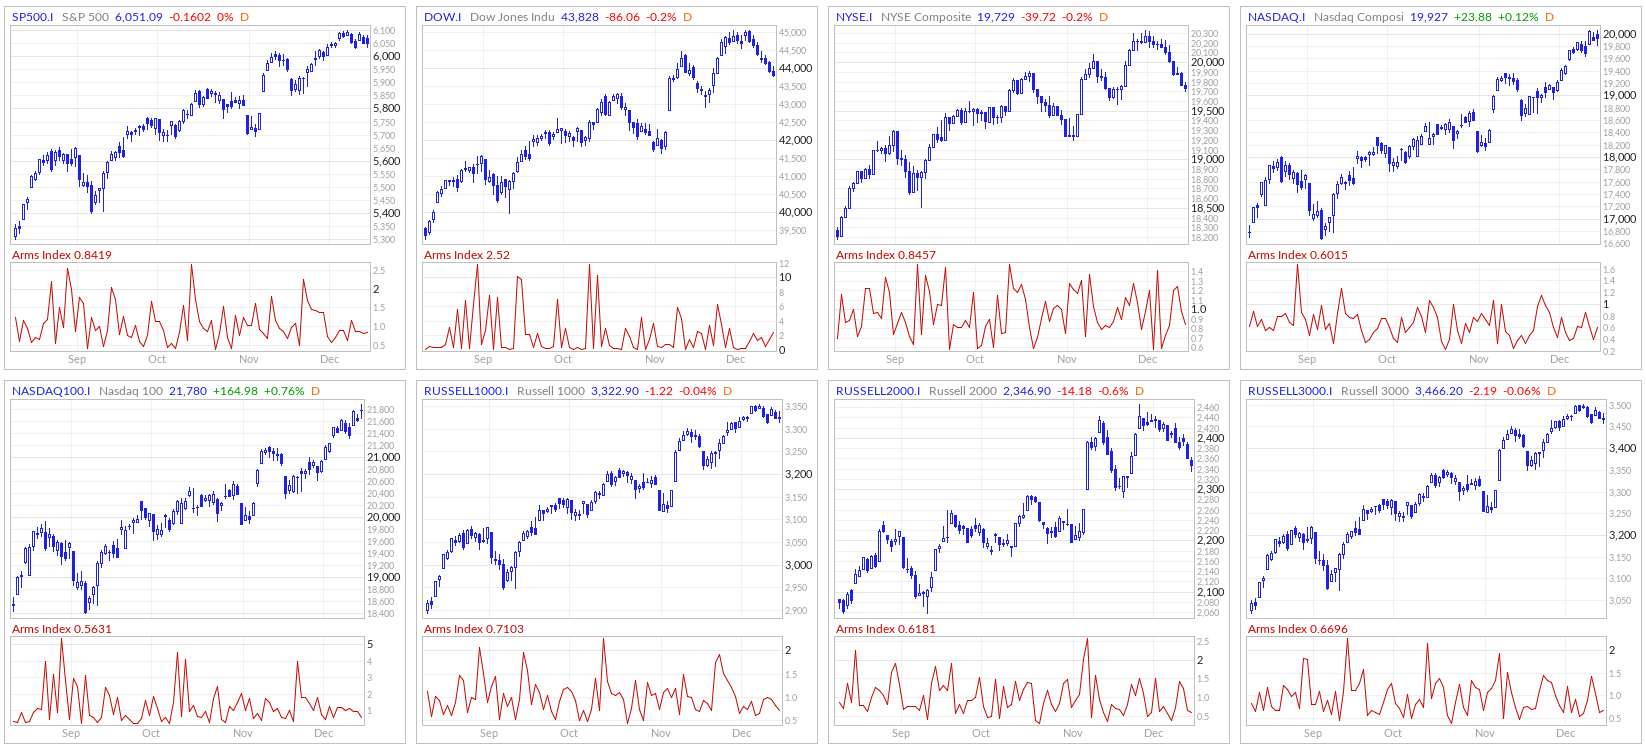
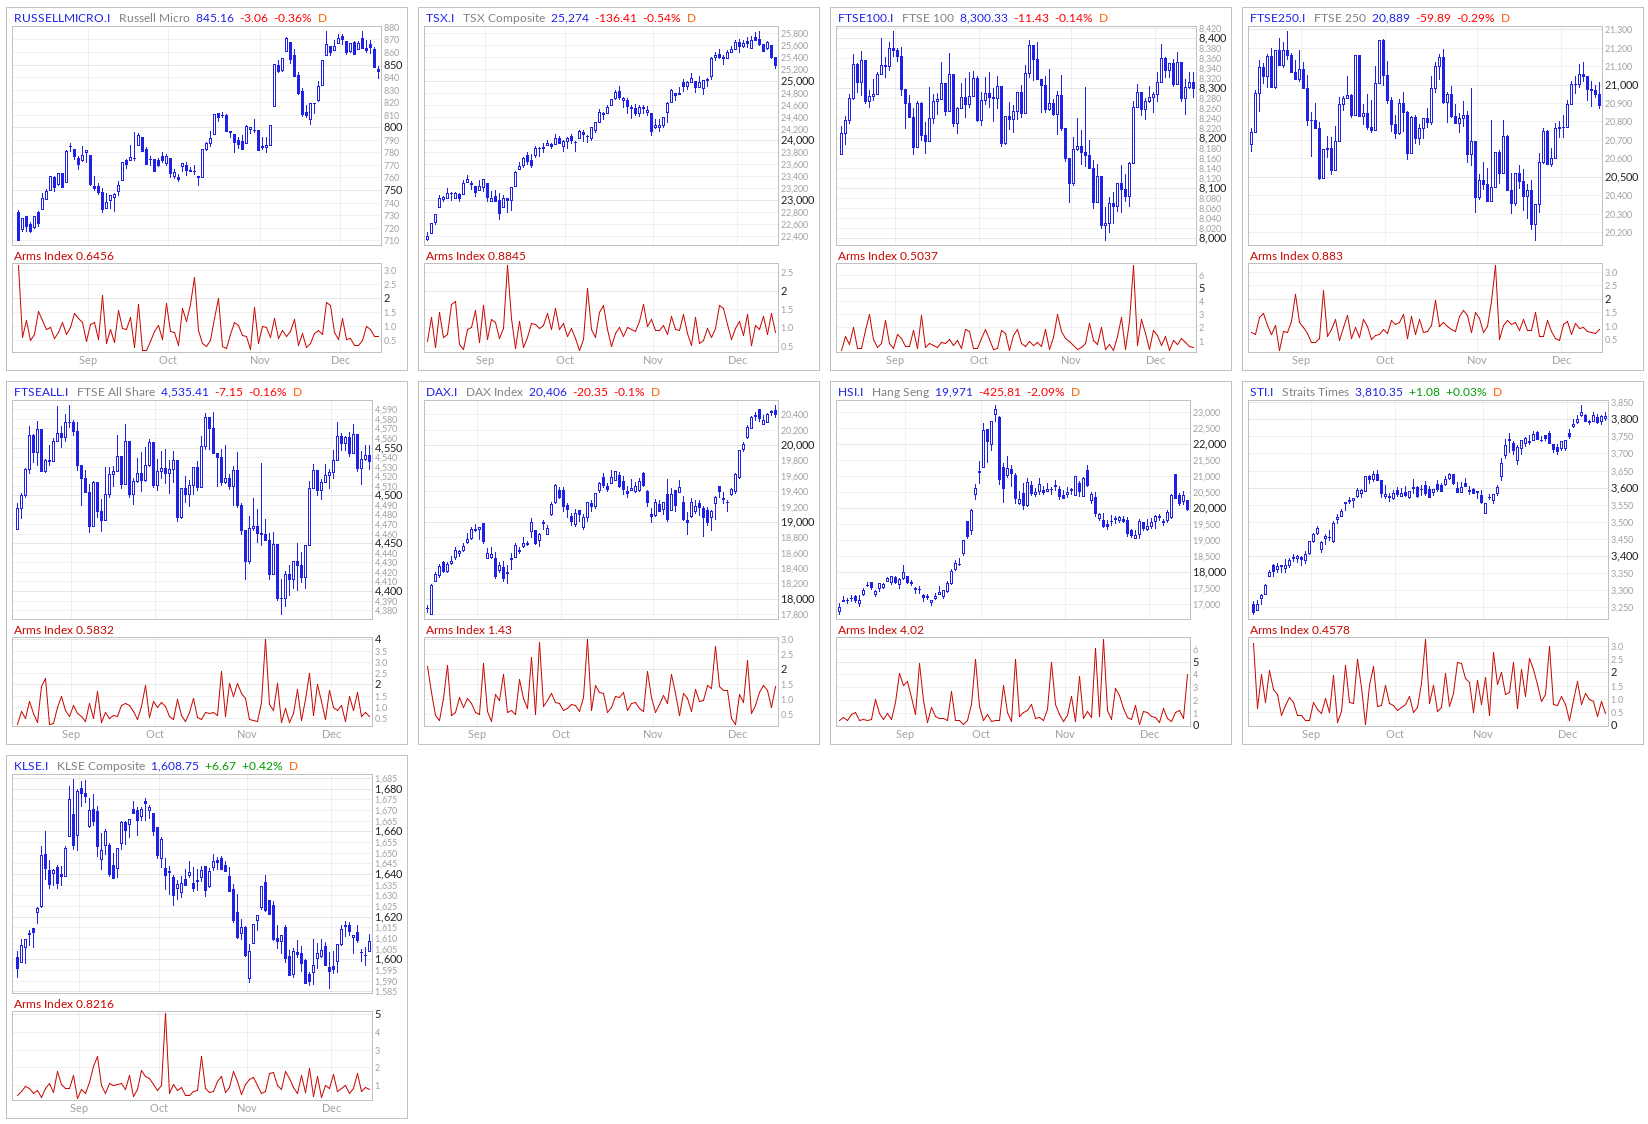
ARMS Index
The Arms Index, also known as the TRIN (Short-Term TRading INdex), was developed by Richard Arms in the 1960s. It is calculated by dividing the ratio of advancing stocks to declining stocks by the ratio of advancing volume to declining volume. Interpreting the Arms Index involves looking at its value in relation to certain thresholds. A value below "1" is considered bullish, indicating that advancing stocks and volume dominate the market. Conversely, a value above "1" is considered bearish, suggesting that declining stocks and volume are more prevalent. Extremely low values (below 0.5) or high values (above 2) are often seen as potential reversal signals.
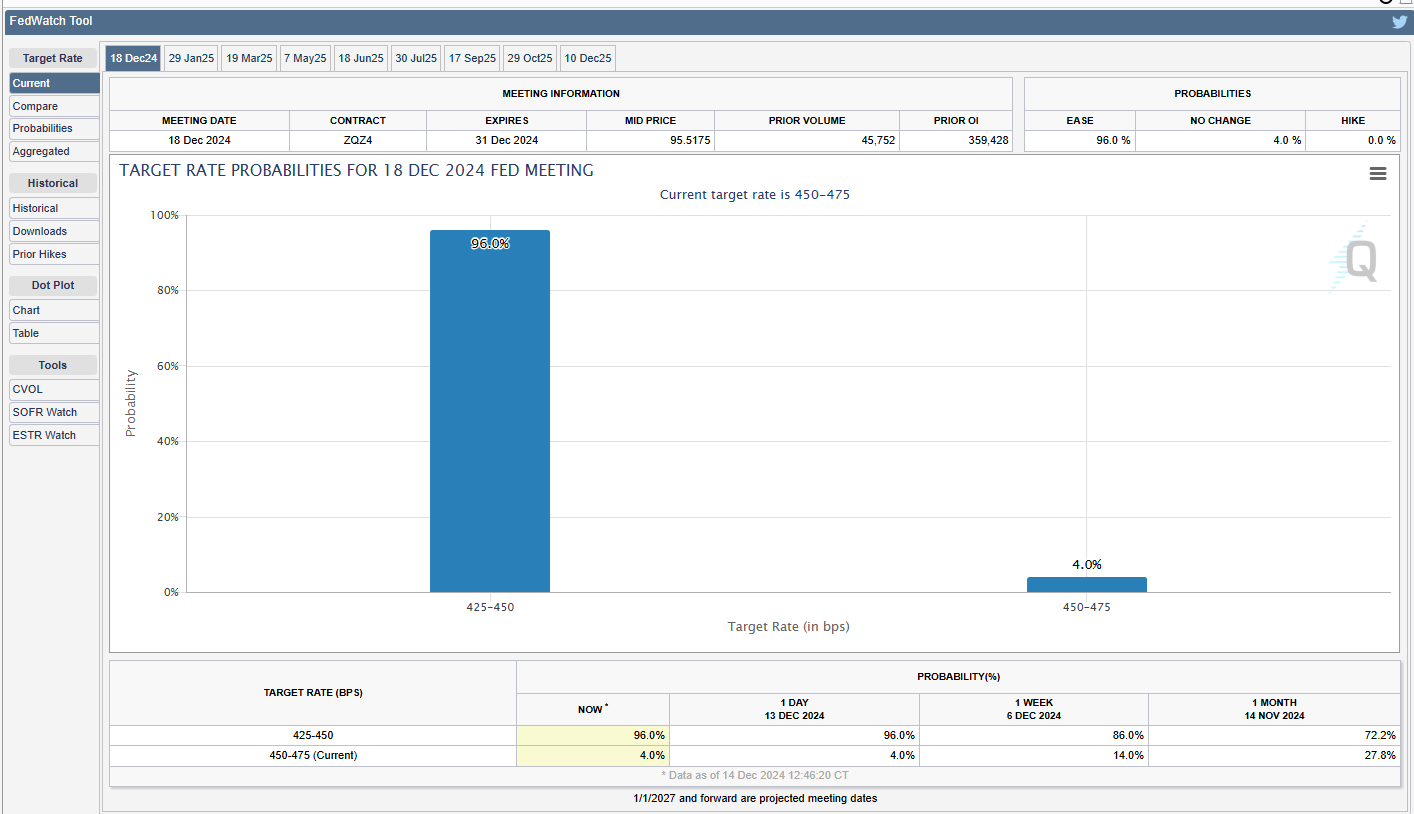
CME Fedwatch
What is the likelihood that the Fed will change the Federal target rate at upcoming FOMC meetings, according to interest rate traders? Use CME FedWatch to track the probabilities of changes to the Fed rate, as implied by 30-Day Fed Funds futures prices.
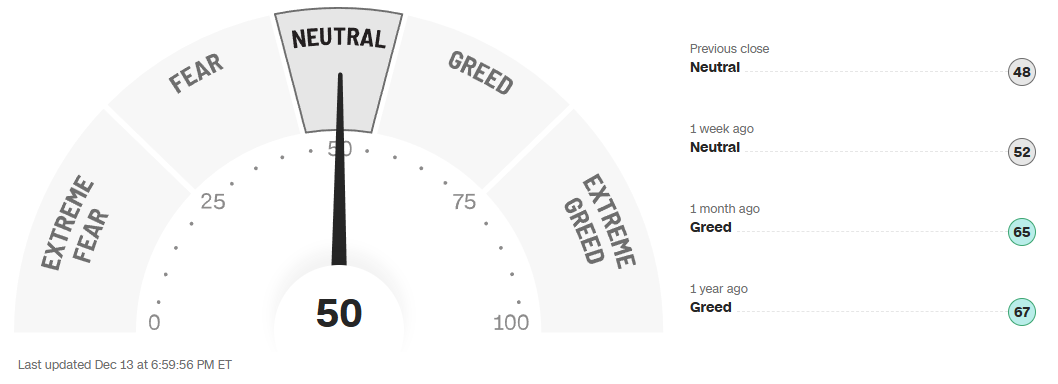
CNN Fear & Greed Constituent Data Points & Composite Index
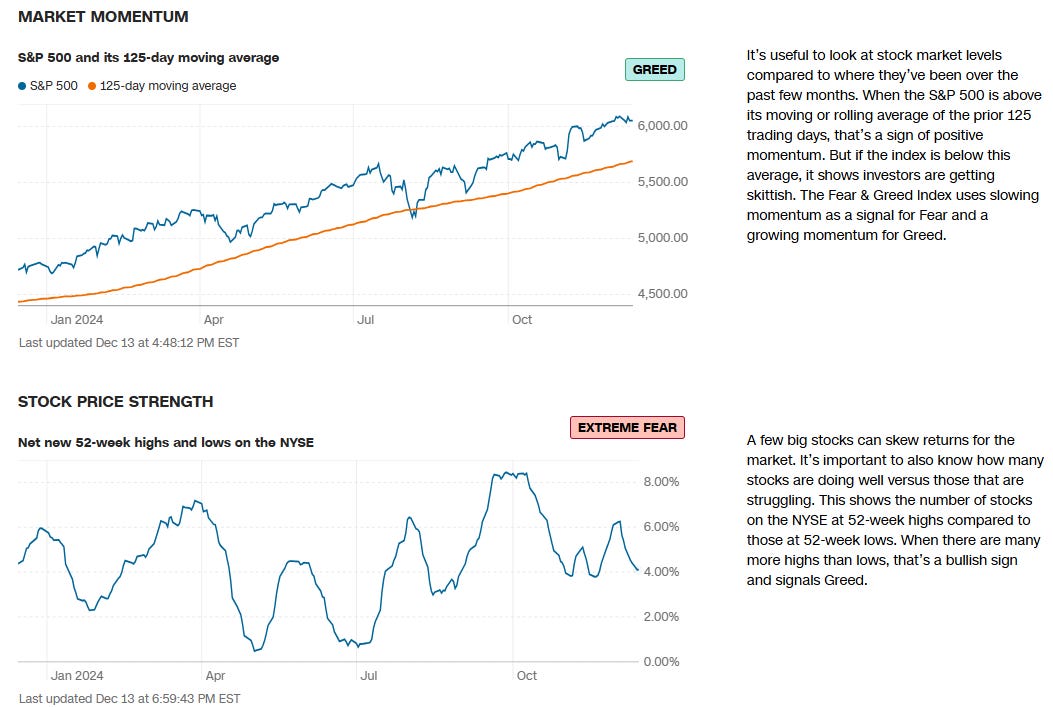
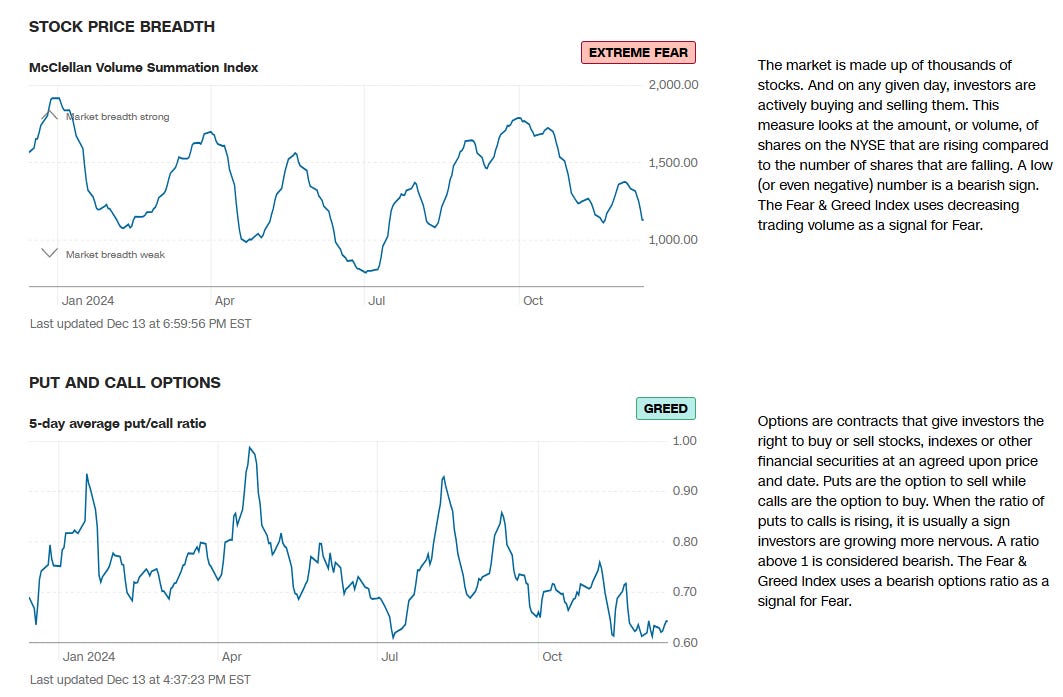
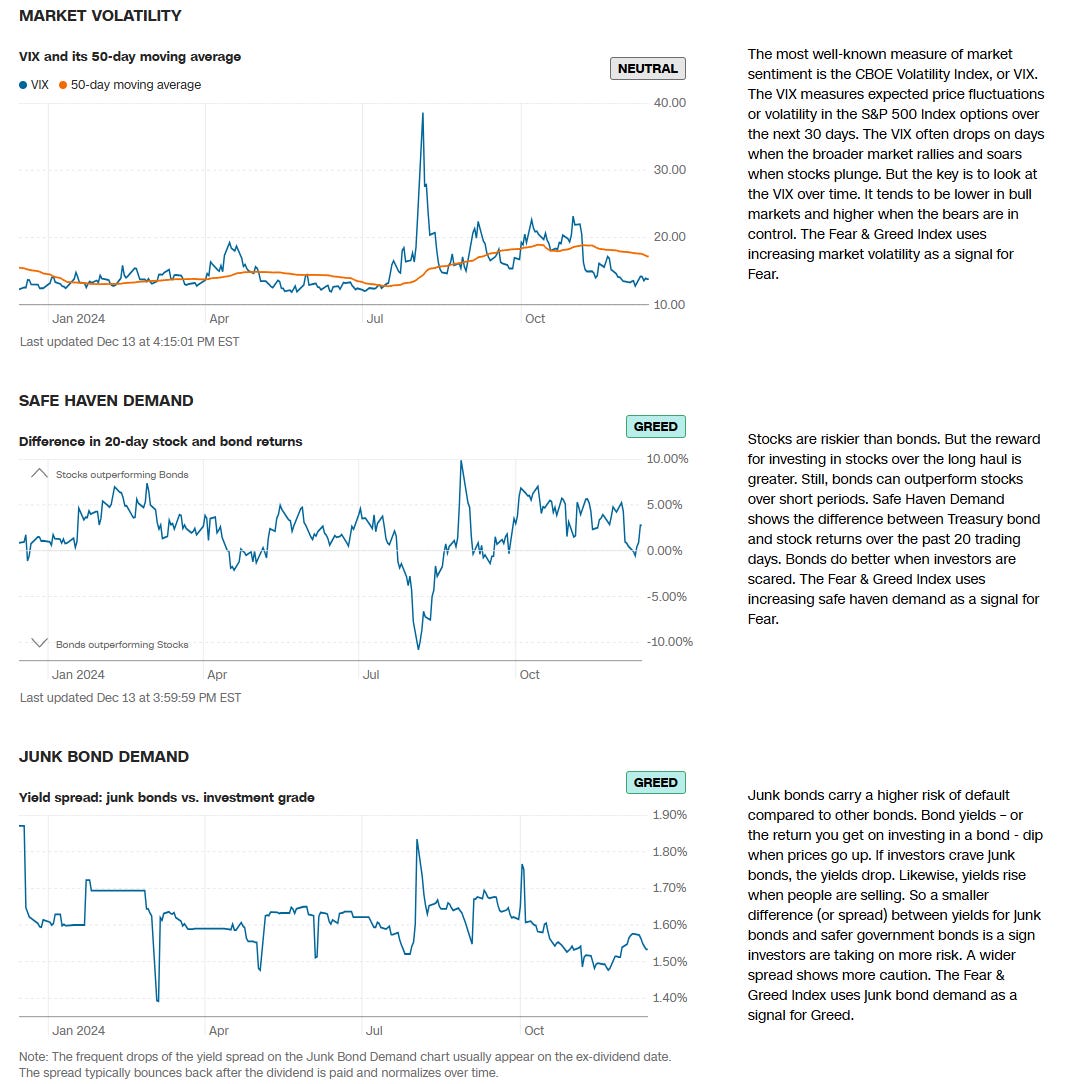
Final Composite Fear & Greed Index Reading
Institutional S/R Levels for Major Indices
When you’re a large institutional player, your primary goal is to find liquidity - places to do a ton of business with the least amount of slippage possible. VolumeLeaders.com automatically identifies and visually plots the exact spots where institutions are doing business and where they are likely to return for more. It’s one of the primary reasons “support” and “resistance” concepts work and truly one of the reasons “price has memory”.
Levels from the VolumeLeaders.com platform can help you formulate trades theses about:
Where to add or take profit
Where to de-risk or hedge
What strikes to target for options
Where to expect support or resistance
And this is just a small sample; there are countless ways to leverage this information into trades that express your views on the market. The platform covers thousands of tickers on multiple timeframes to accommodate all types of traders. Observe for yourself how accurate the levels are by marking-up your charts with the information in the “Trade Levels” boxes and play-along in real-time this week.
SPY -0.00%↓
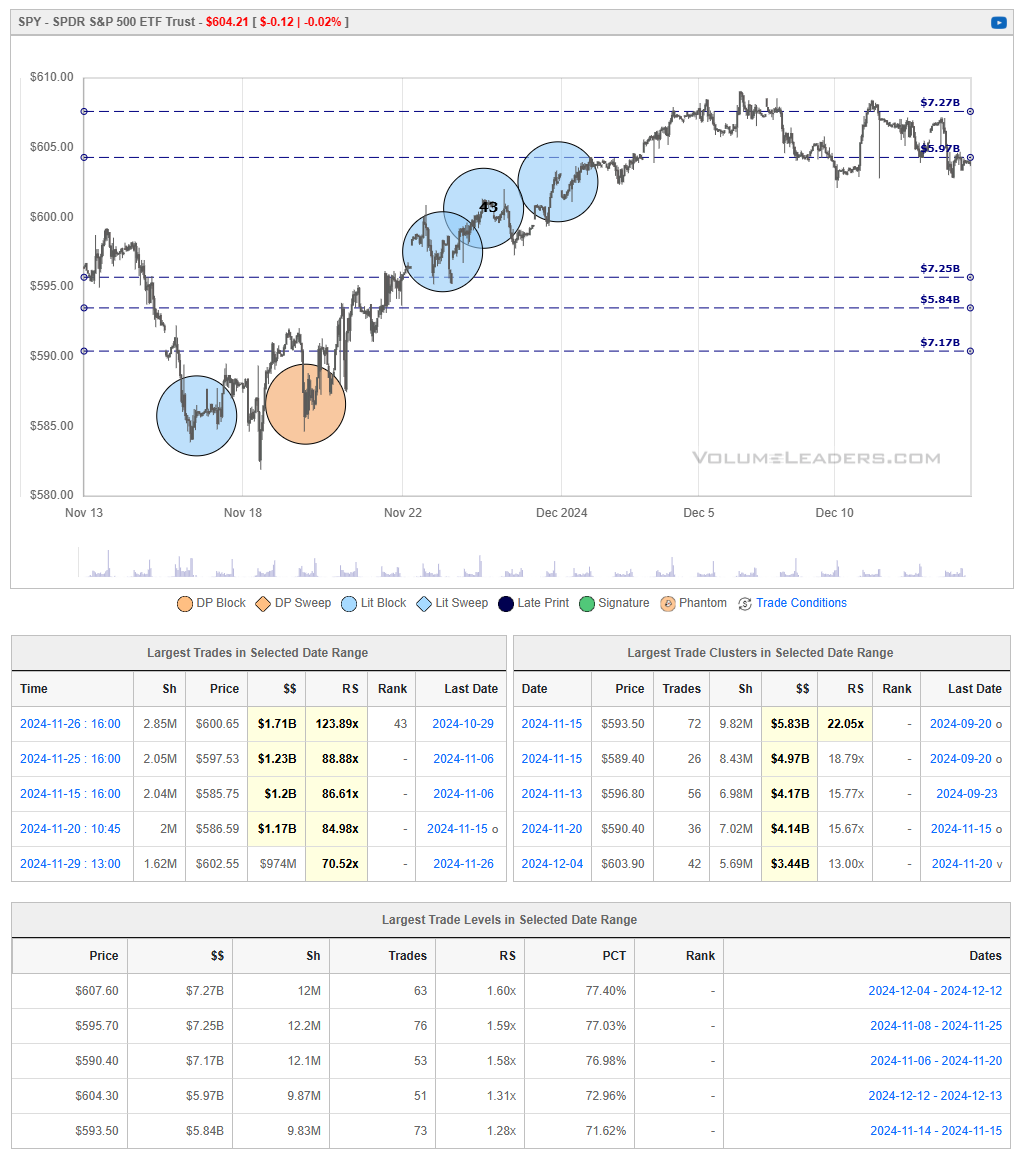
SPY’s earlier uptrend took it above several key institutional trade clusters—areas of large-volume transactions that can act as support and resistance. Notably, after pushing through significant volume levels at $593.50, $598.40, and $604.30, the ETF reached as high as $610 before encountering renewed selling pressure. The inability to hold above the uppermost, high-dollar-volume level near $607–$610 suggests that supply remains concentrated at these elevated prices.
Currently, SPY appears to be testing support around the $603–$605 region, where substantial previous activity may now act as a potential floor. If buyers step in here, the market could stabilize and attempt another run toward the $607–$610 zone. A decisive break back above that level would signal a resumption of the prior uptrend and show that the supply at higher prices has been absorbed. Conversely, if the ETF fails to maintain footing above its mid-level support, it may slip lower and revisit the $598 and $593 areas, where prior trade clusters could once again influence price action. In short, SPY is at a tactical inflection point, with the outcome at these volume-based thresholds likely to set the near-term direction.
QQQ -0.02%↓
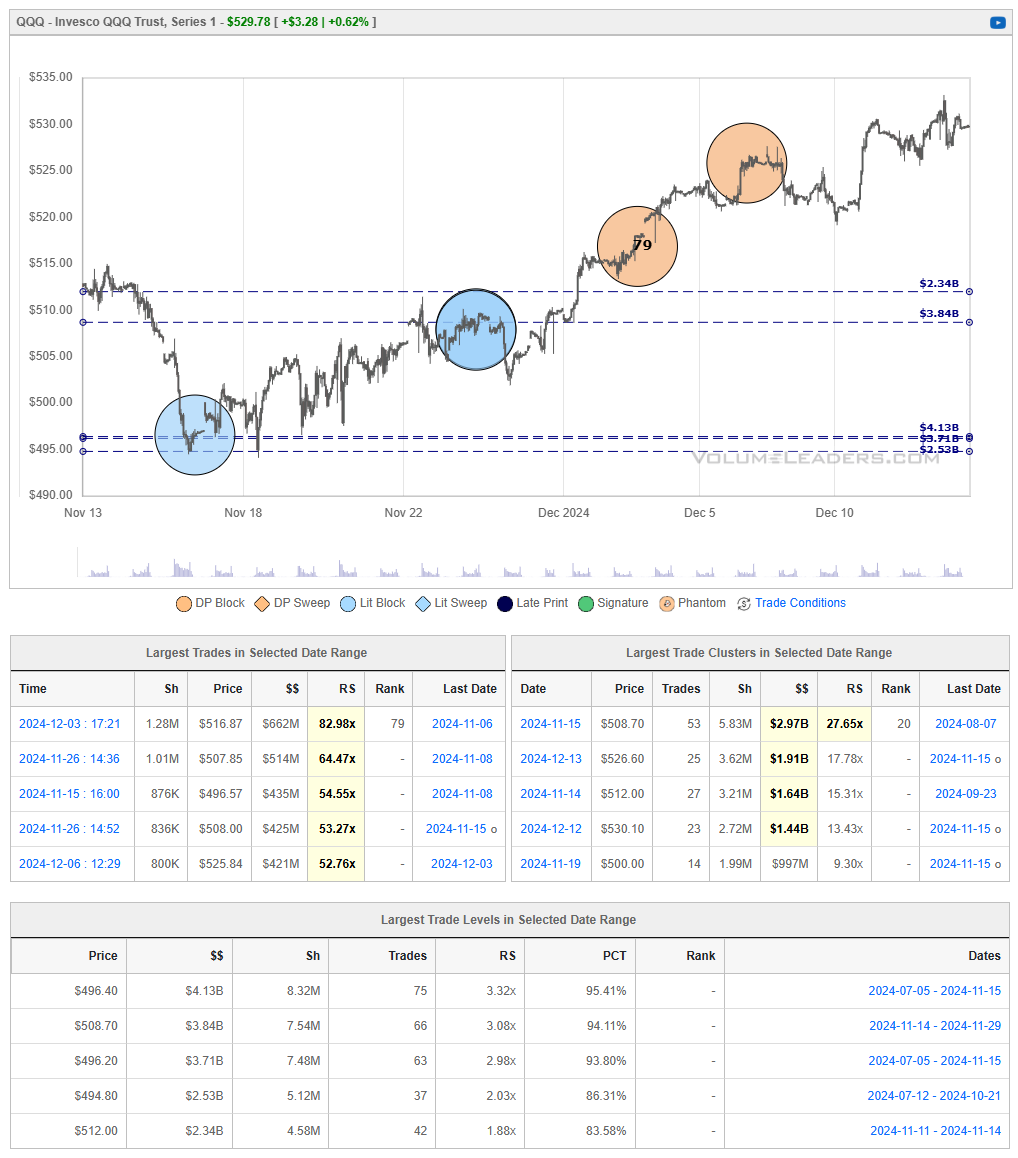
QQQ has consistently pushed through each major volume-heavy resistance zone, turning prior overhead supply into structural support. Notably, key levels around $495–$505, where large trades previously capped upside attempts, have now been absorbed and effectively converted into a price floor. This pattern of clearing high-volume clusters and establishing higher lows has set the stage for a healthy and persistent uptrend.
Having overcome significant institutional selling pressure, QQQ’s recent consolidation near the $525–$530 region appears more like a pause within an ongoing bullish phase rather than a top. Unless the ETF falls back below these now well-established support tiers, the technical landscape remains favorable. Buyers continue to demonstrate the capacity to absorb supply, suggesting that any dips toward previous trade clusters may present buying opportunities, reinforcing the overall positive momentum.
IWM 0.00%↑
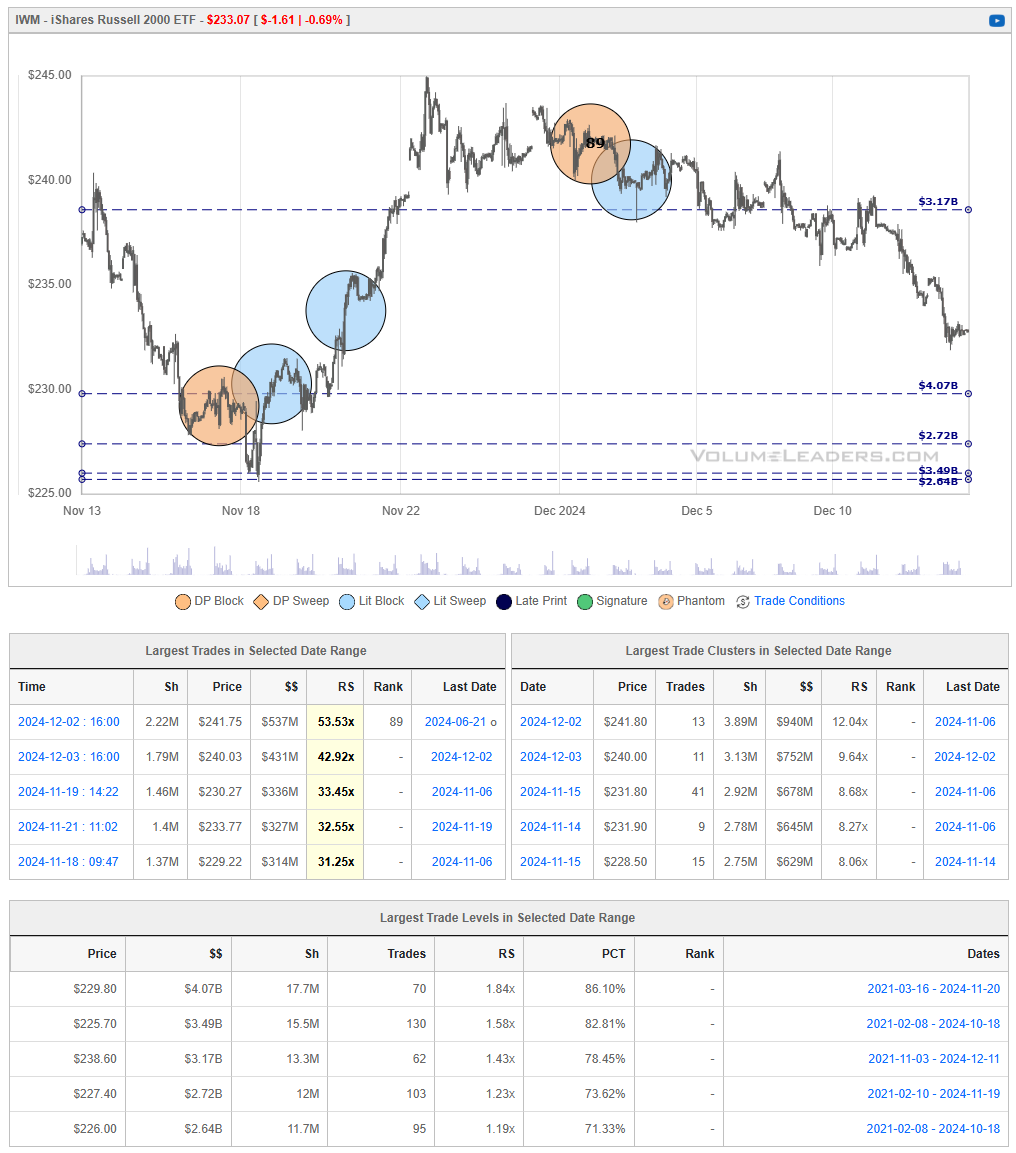
Last week we issued caution at the $238 level and said that a failure to hold or push above would invite weakness into prior levels. IWM’s recent price action has shifted from an earlier attempt to rally above overhead supply zones toward a more defensive stance. After multiple tries, the ETF was unable to sustain advances beyond the volume-heavy clusters in the $235–$242 region. The subsequent turn lower indicates that sellers remain active, and these previously tested zones continue to function as resistance.
As price slips back toward lower-volume areas near $229–$231, the ETF is approaching established support levels identified by large historical trades. The market’s reaction in this lower band will be critical. A meaningful bounce here could signal that buyers are reemerging to defend value areas, potentially stabilizing the market. Conversely, if IWM fails to attract buyers around these support tiers, it may open the door to further downside exploration. In short, the ETF’s near-term technical posture is neutral-to-weak, with price currently caught between persistent overhead supply and the need to reassert buying interest at lower supports.
DIA 0.00%↑
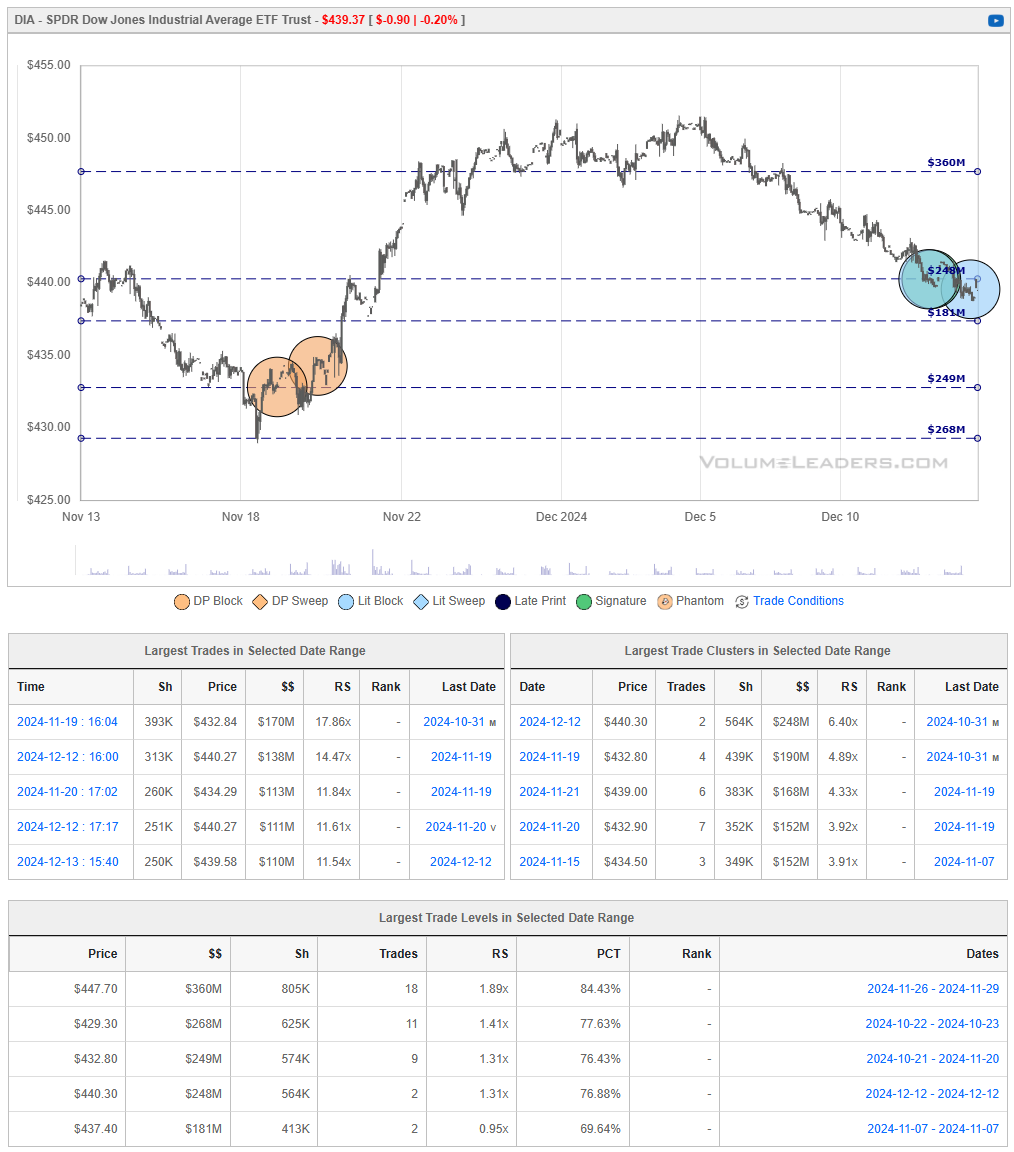
After failing to maintain its footing above key high-volume regions, DIA has reversed its prior gains and is now drifting lower. Earlier, heavy institutional trades around $447.70 and nearby price clusters offered a stepping stone on the way up, but now serve as strong overhead resistance. As the ETF has rolled over, it has slipped below previously supportive zones, including the $440.30 area, signaling that sellers are regaining control.
With DIA trading in the $439 range, the immediate focus turns to the next layers of volume-based support around $437.40 and $432.80. If buyers fail to step in and defend these lower clusters, a deeper pullback toward the $429 region—where larger historical trades may once again attract demand—is possible. In short, the bullish momentum that once propelled DIA higher is now challenged, and the ETF’s ability to hold these remaining support tiers will likely dictate its near-term direction.
Institutional Order Flow
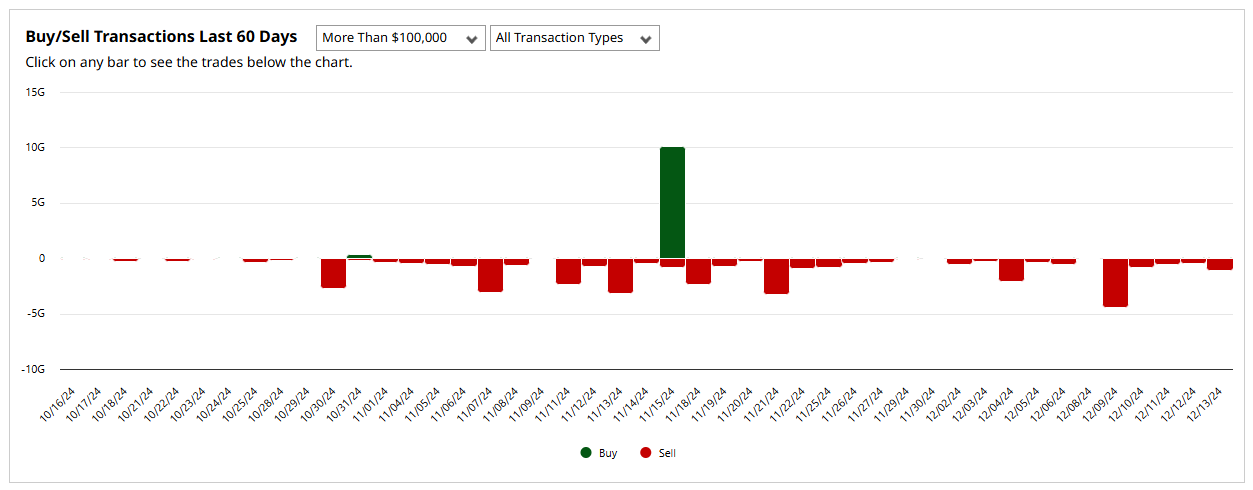
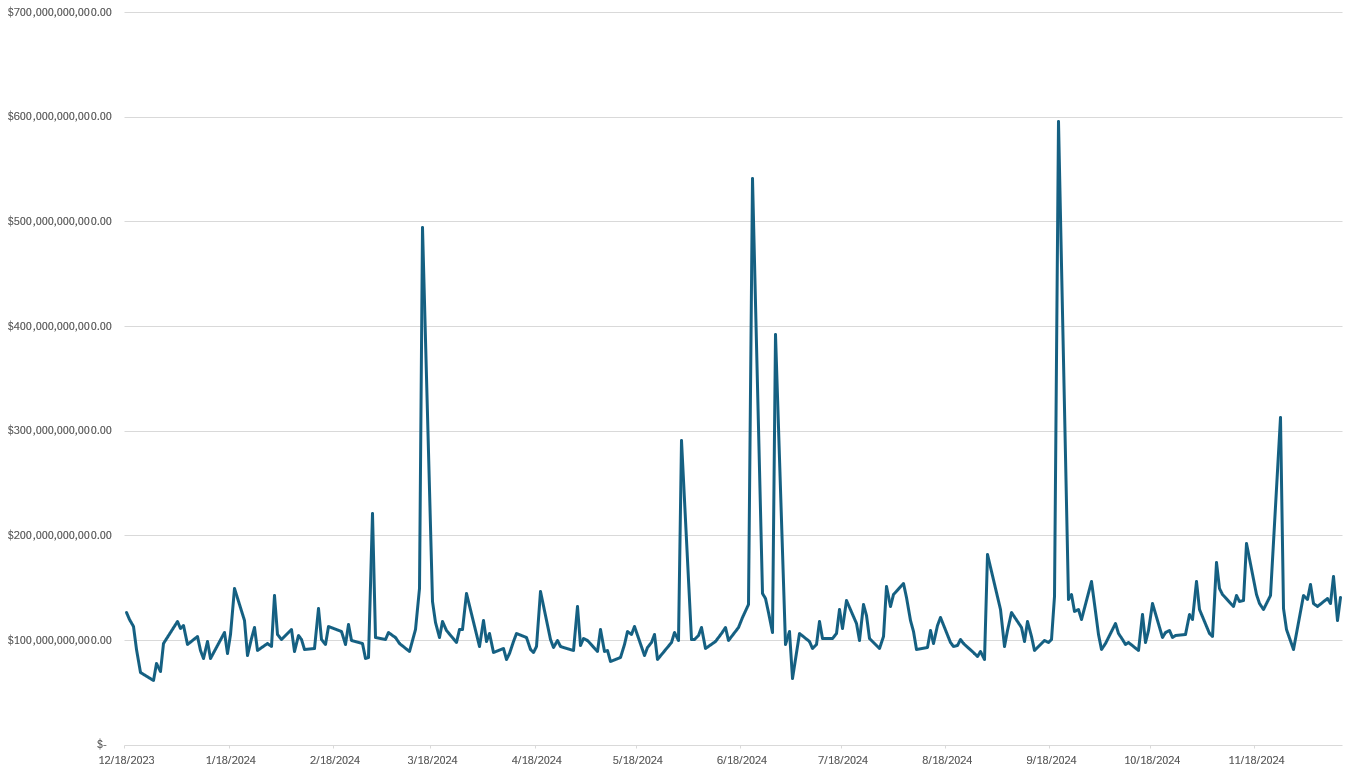
Rolling 1-Yr Dollars By Day
This chart shows institutional activity by dollars by day on a rolling 1-year basis. From a theoretical standpoint, examining a chart of daily institutional dollar activity over the course of a year can offer several insights and possible inferences, though all should be approached with caution since the data alone may not prove causality or confirm underlying reasons. Some potential takeaways include:
Event-Driven Behavior:
Sharp, singular spikes on certain days might correlate with major market-moving events. These could include central bank policy announcements, significant geopolitical news, sudden macroeconomic data releases (like employment reports or GDP data), earnings seasons for large-cap companies, or unexpected shocks (e.g., mergers, acquisitions, regulatory changes).Liquidity Dynamics:
Institutions often concentrate large trades on days with higher expected liquidity. For instance, heightened activity might coincide with index reconstitutions, option expiration dates, or the days leading up to or following a major index rebalance, when large amounts of capital shift hands simultaneously.Risk Management and Hedging Activity:
Institutions may significantly adjust their exposures on days that are critical from a risk management perspective. Large spikes can occur if hedge funds, pension funds, or asset managers are rolling over futures contracts, initiating or closing out large hedges, or reacting to volatility triggers.Market Sentiment Indicators:
While the data is purely transactional, the sheer volume of institutional involvement on certain days might indirectly hint at changing sentiment or strategic shifts.
In essence, a chart like this can lead you to hypothesize that institutional trading volumes are not constant or random but rather influenced by a mix of predictable calendar effects, major market events, liquidity considerations, risk management decisions, and strategic allocation shifts.
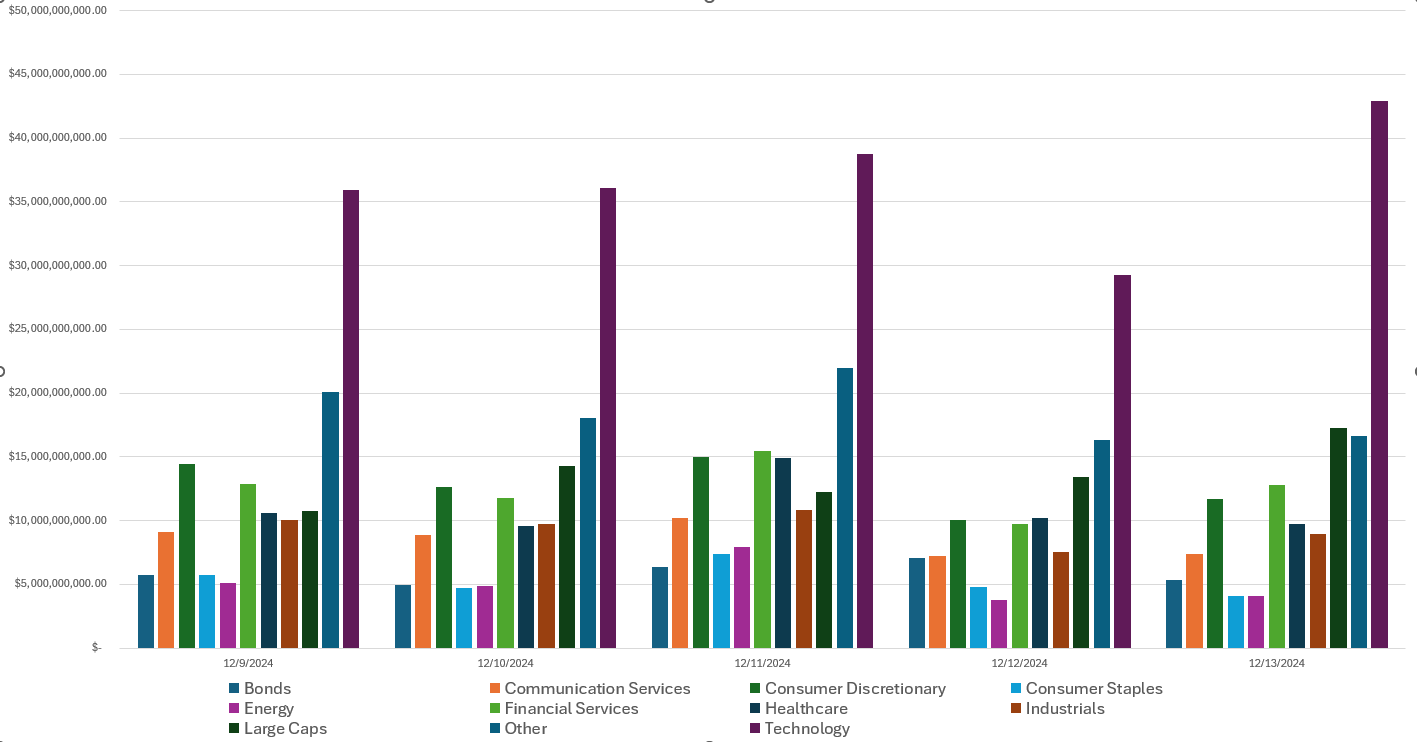
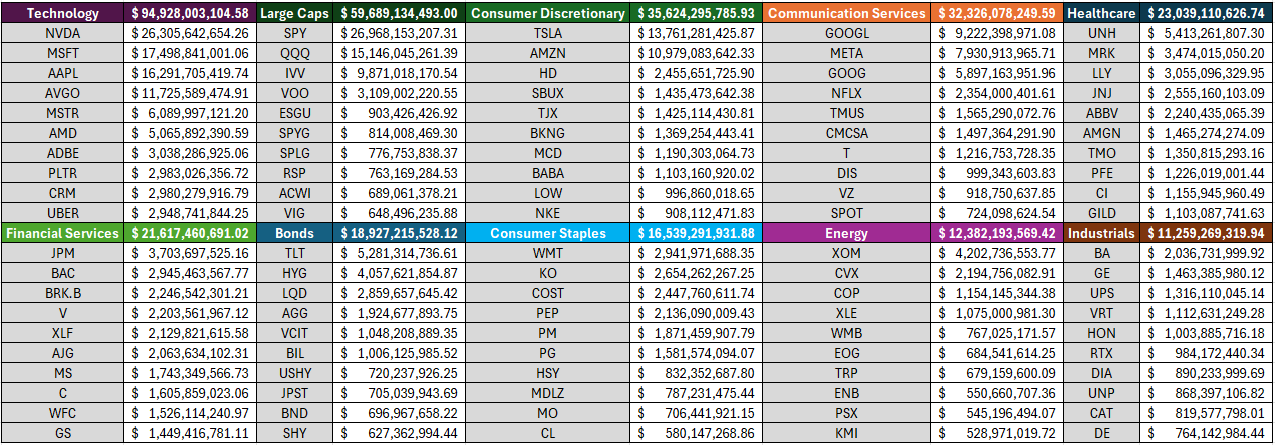
Last Week’s Institutional Activity By Sector
This is an incredibly important chart to watch as it contains lots of nuanced suggestions at a thematic level. Watch this chart closely week-to-week to stay informed about where institutional money is flowing, adjust your strategies based on momentum, align your portfolio with macroeconomic and market trends, and manage risks more effectively by avoiding sectors losing institutional favor. The Top 10 active sectors are identified and the rest grouped as “Other”.
Sector Rotation Insights: The chart highlights which sectors are attracting institutional activity and which are losing favor. Institutions often lead market trends, so tracking shifts in their focus can indicate sector rotations.
Sentiment Analysis: The level of institutional activity reflects confidence in specific sectors. Rising activity in traditionally defensive sectors (e.g., healthcare, utilities) may indicate caution, while a surge in growth sectors (e.g., technology, consumer discretionary) could suggest optimism.
Emerging Trends: Sudden spikes in a previously overlooked sector, like industrials or consumer staples, might hint at emerging opportunities or structural shifts.
Macro Themes: Changes in sector activity often align with broader macroeconomic themes like inflation, interest rates, or geopolitical events. For instance:
Increased activity in energy might indicate concerns about oil supply or rising prices.
Growth in technology could align with innovations or favorable policies.
Risk Management: Declining institutional activity in a sector might signal weakening fundamentals or heightened risks.
Spotting Overcrowding: Excessive activity in a single sector over multiple weeks may suggest overcrowding, which could lead to heightened volatility if institutions begin to exit.
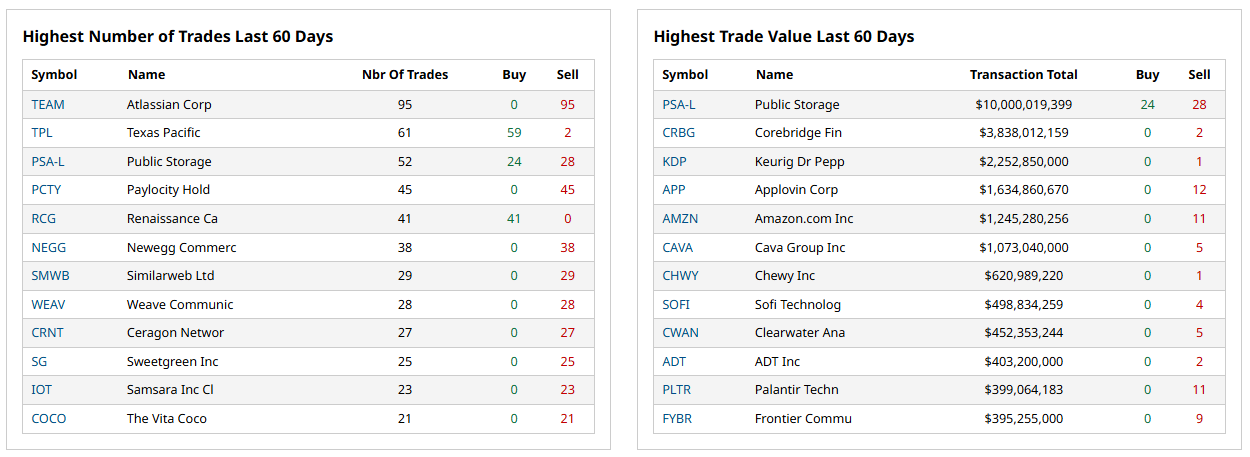
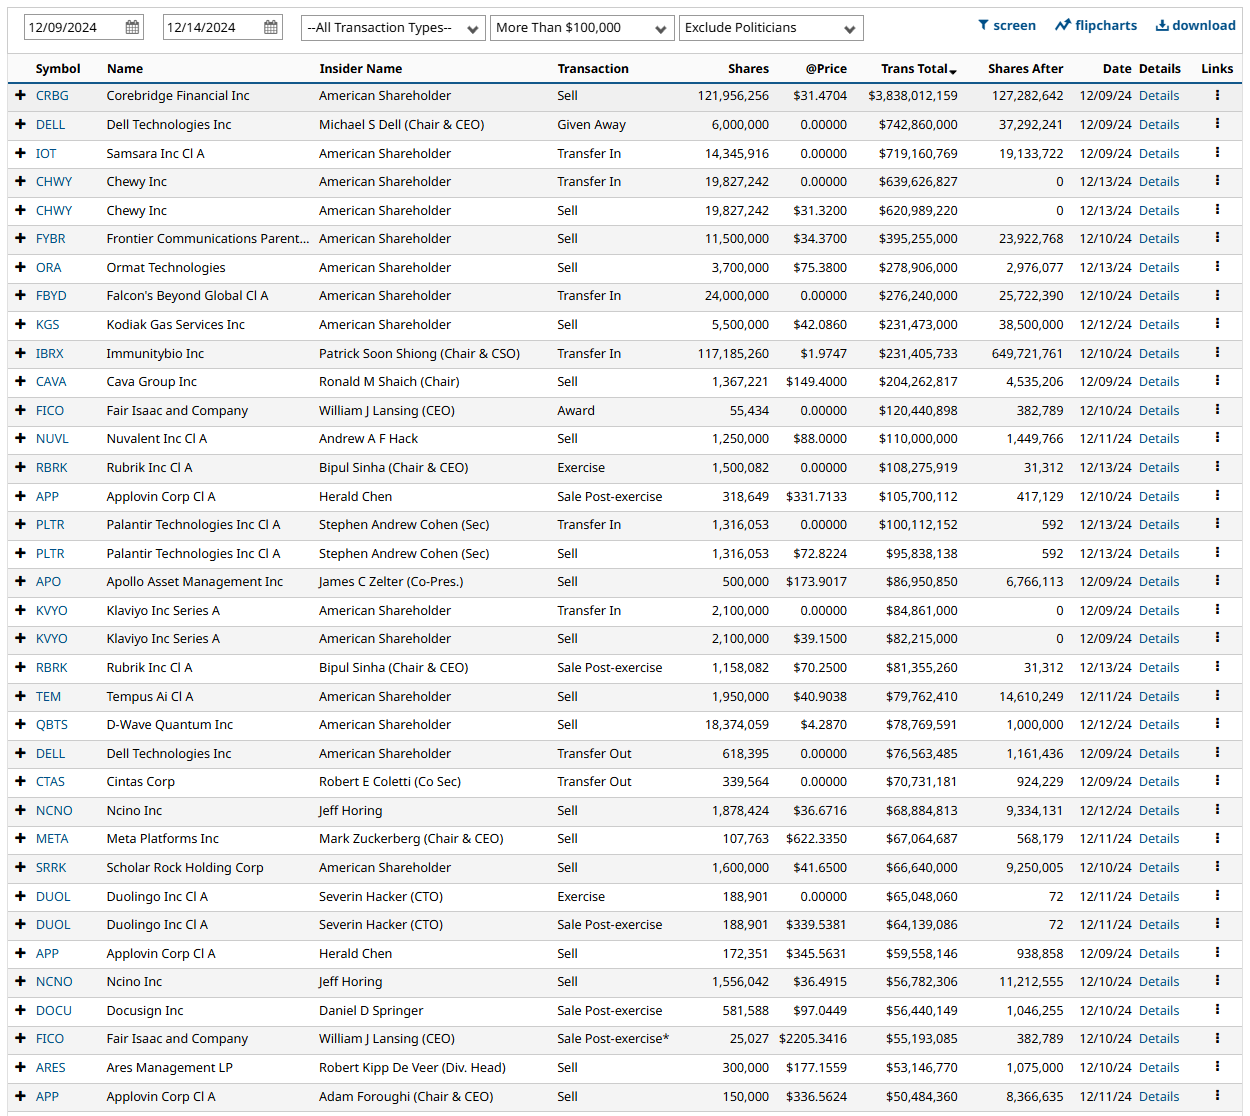
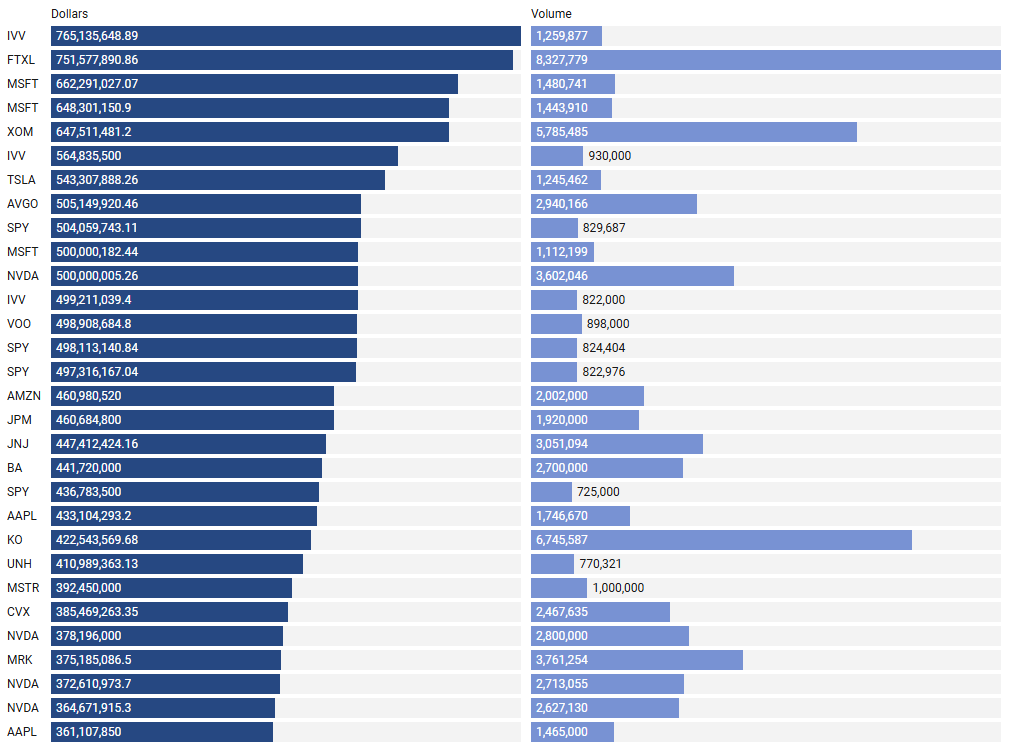
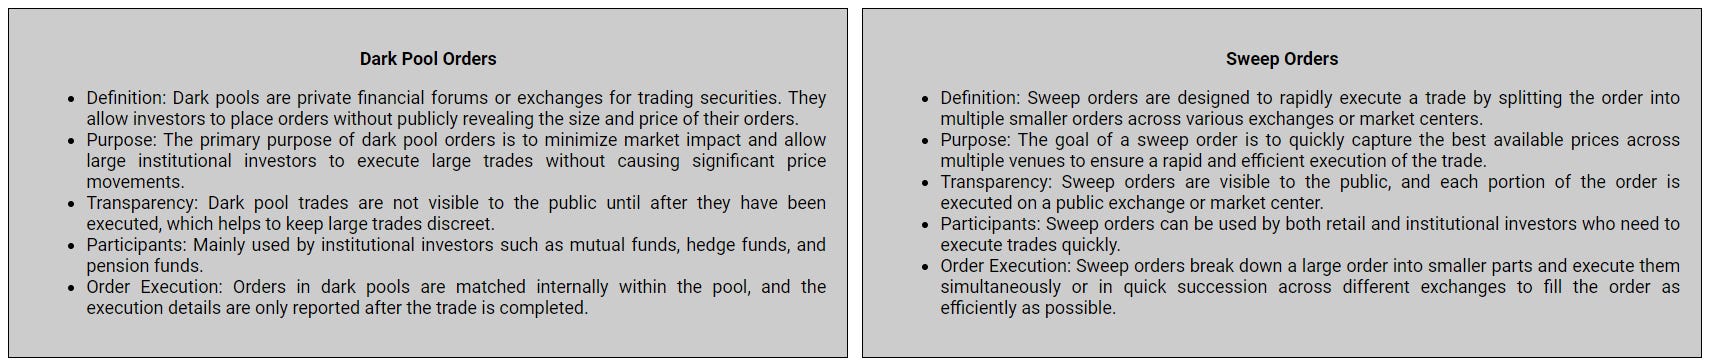
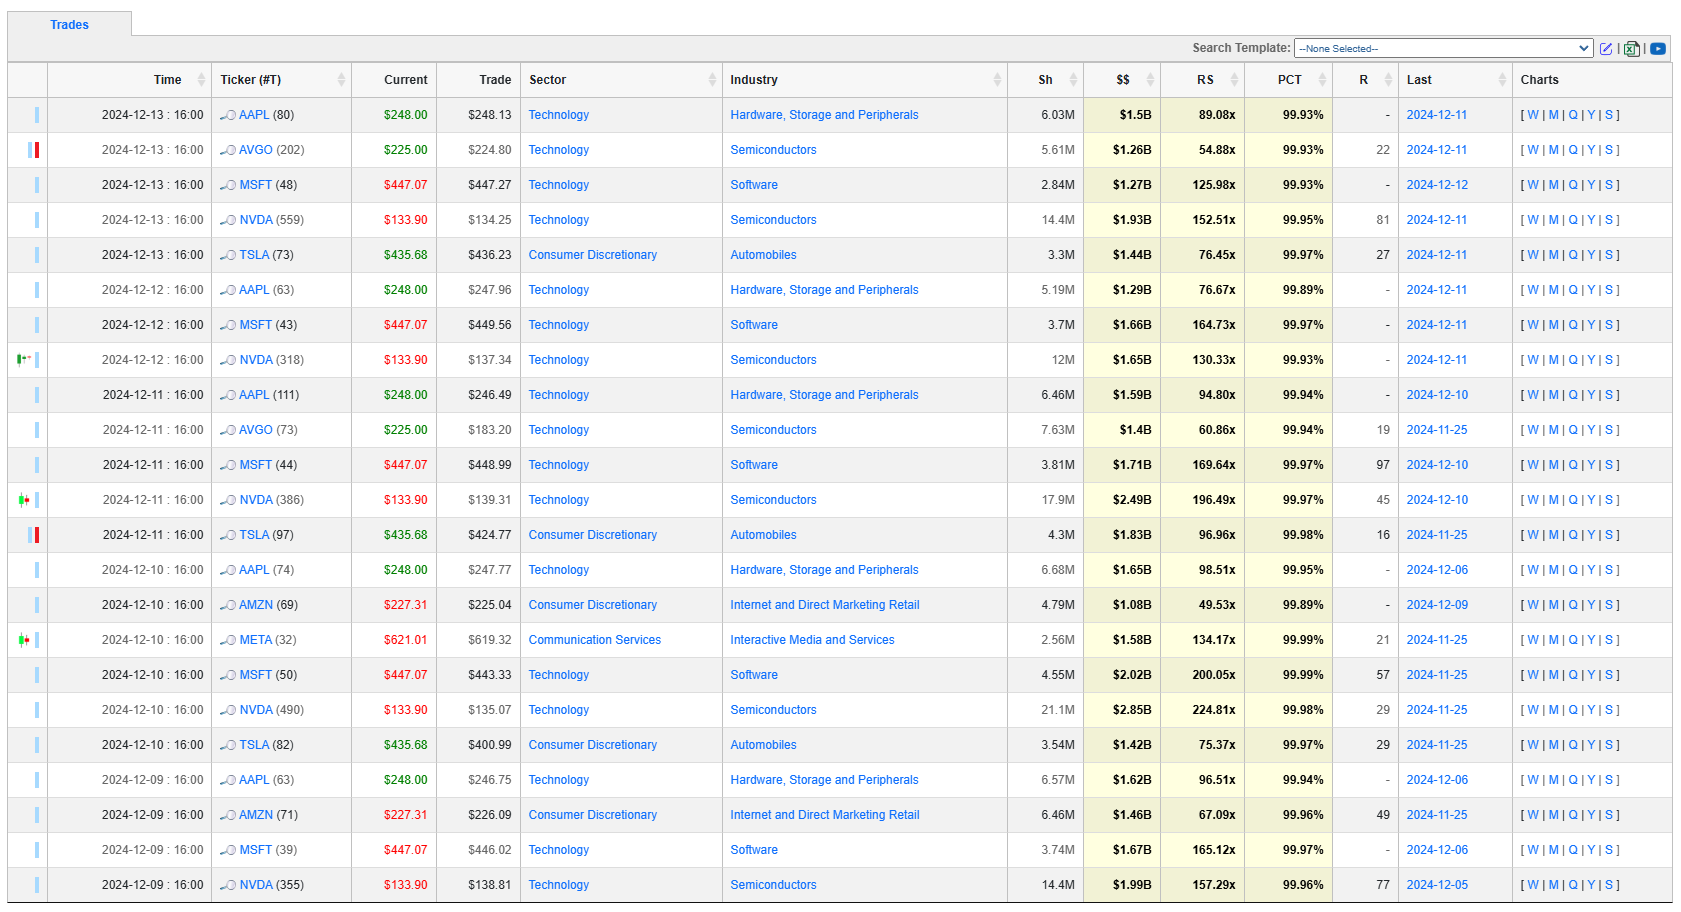
Top Institutional Orderflow In Individual Names
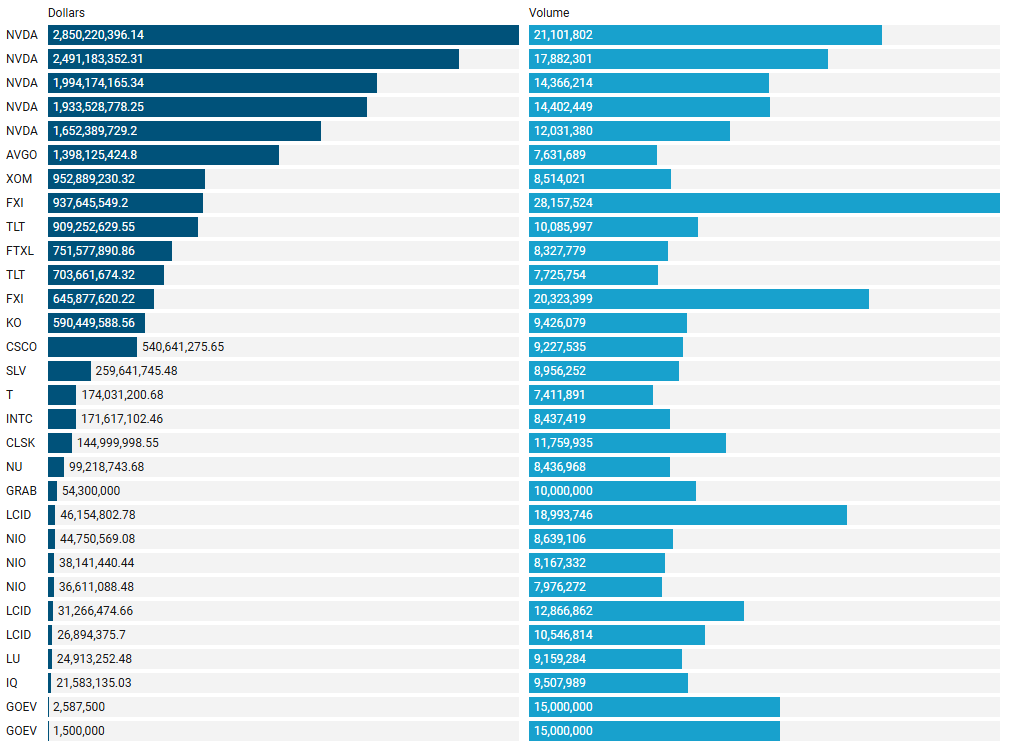
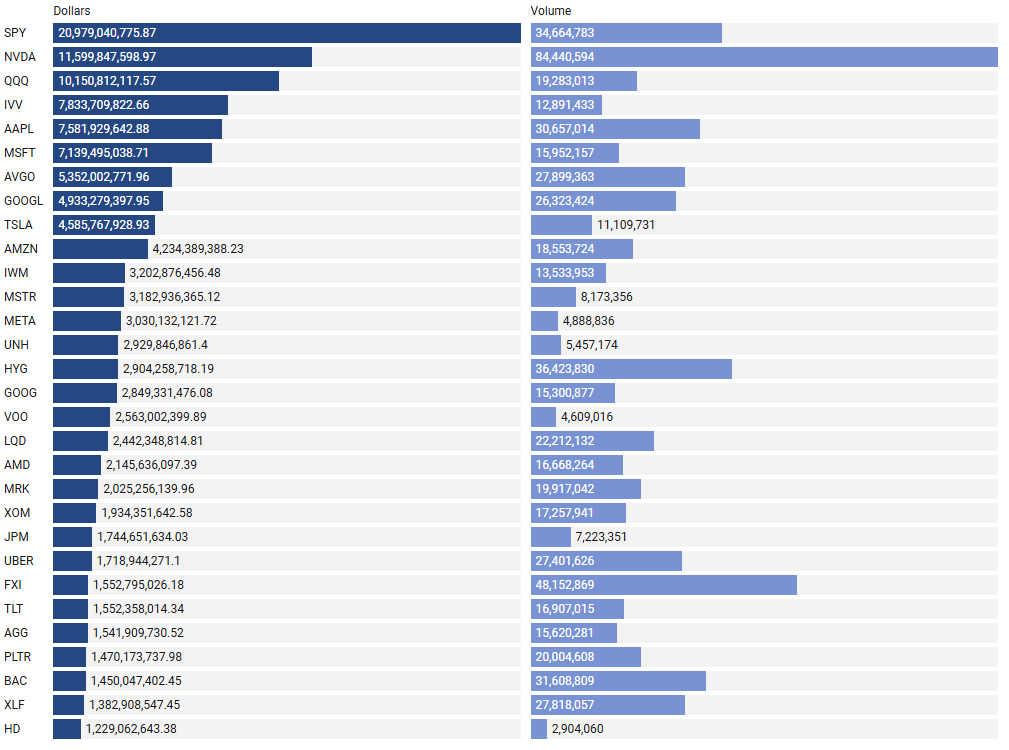
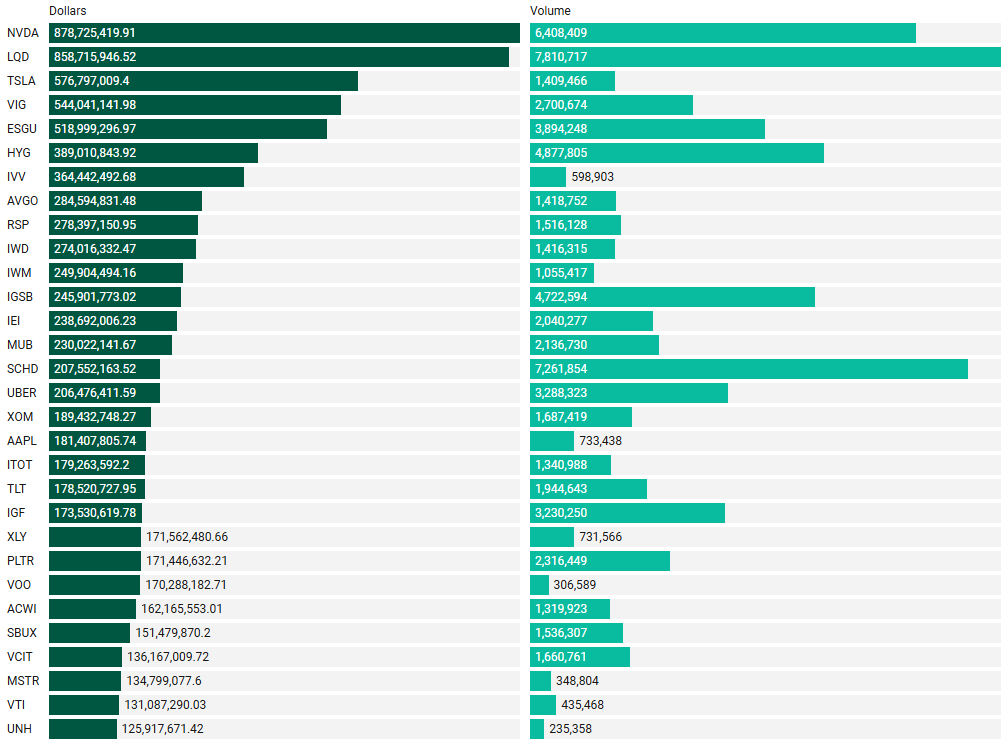
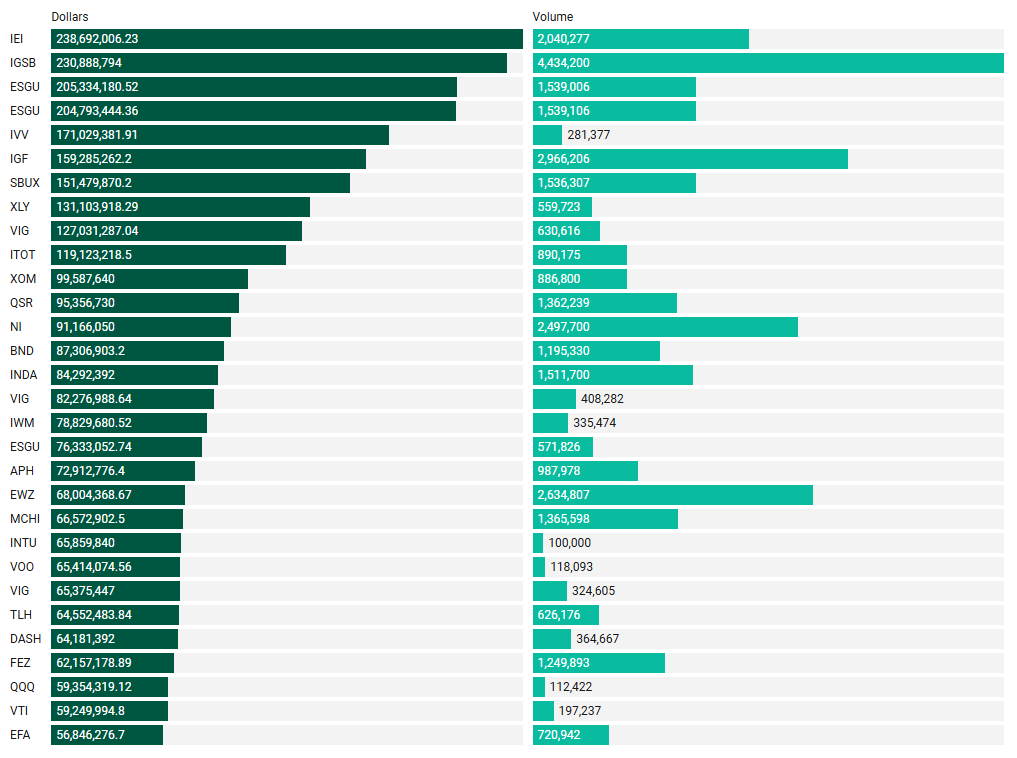
Many excellent trade ideas and sources of inspiration can be found in these prints. While only the top 30 from each group are displayed, the complete results are accessible in VolumeLeaders.com for you to explore at your convenience any time. Remember to configure trade alerts within the platform to ensure you never overlook institutional order flows that capture your interest or are significant to you. The blue charts encompass all types of trades, including blocks on lit exchanges; the purple charts exclusively depict dark pool trades; and the green charts represent sweeps only.
Largest By Aggregated Dollars Transacted
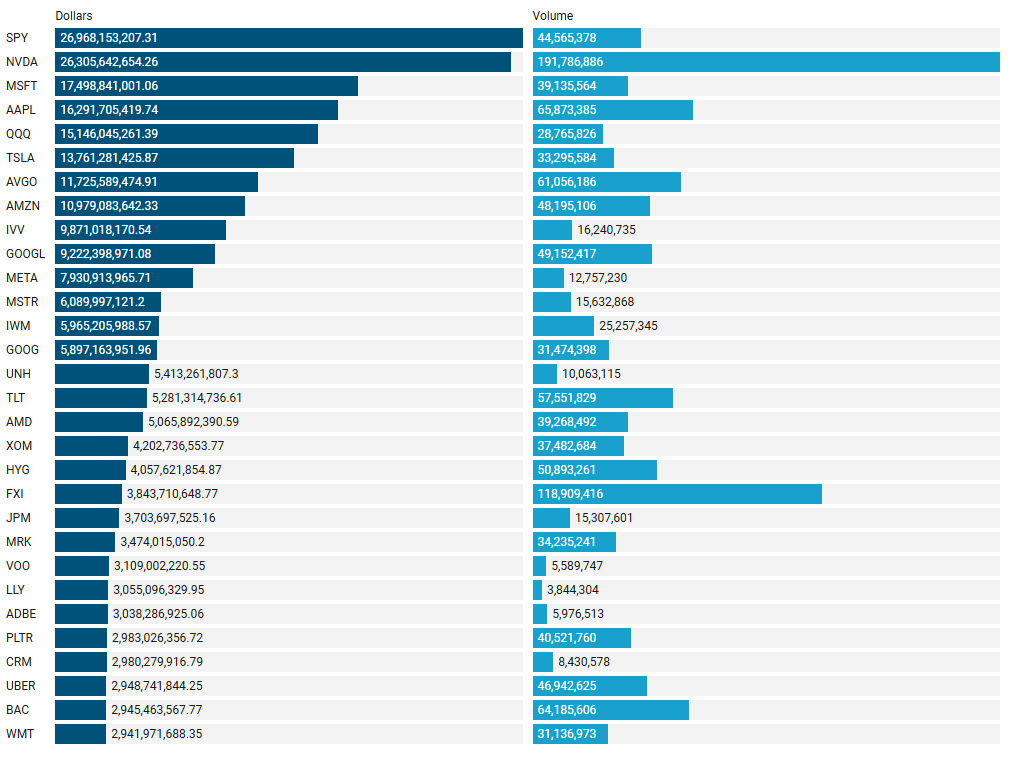
Largest Individual Trades by Dollars
Top Aggregate Dark Pool Activity by Ticker
Largest Individual Dark Pool Trades by Dollars
Top Aggregate Sweeps by Ticker
Top Individual Sweeps by Dollars Transacted
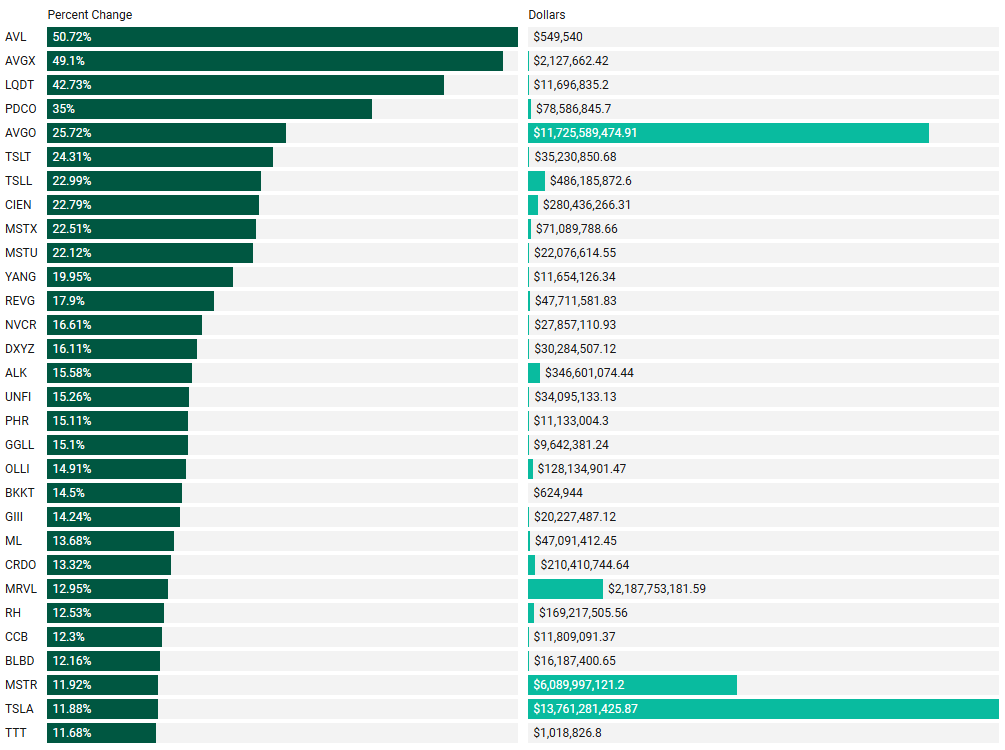
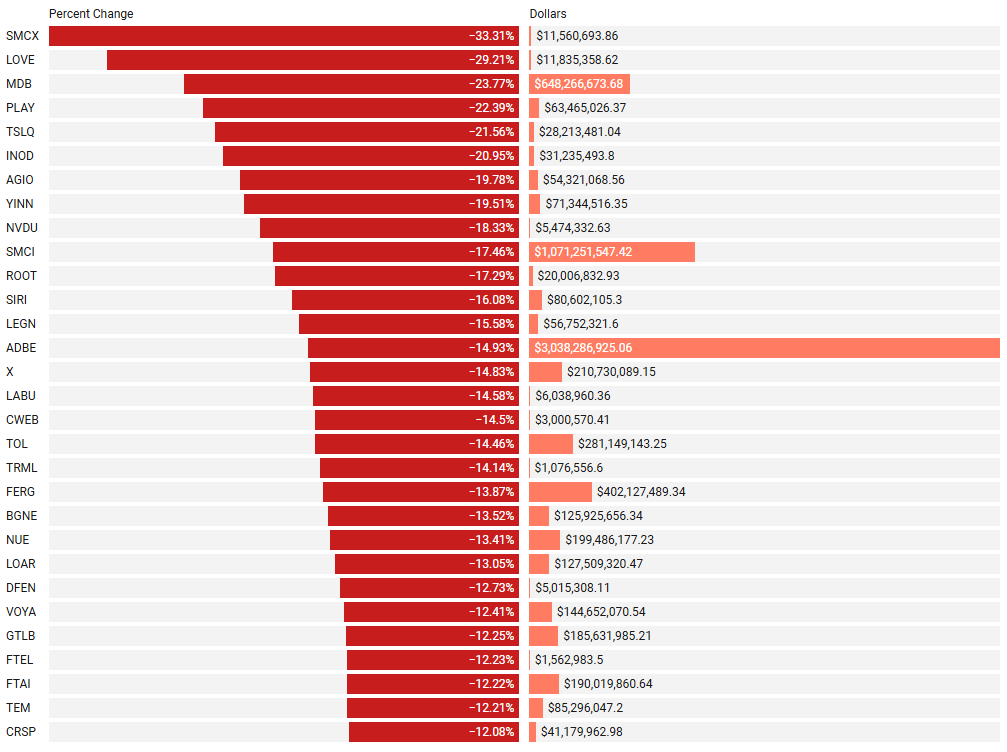
Last Week’s Institutionally-Backed Gainers & Losers
If you’re going to bet on a name, consider one that is officially endorsed by an institution! These are the top percent gainers (green) and percent losers (red) from this week’s open-to-close that had a trade price greater than $20 and institutional involvement. Continue watching tickers from this and prior stacks as these names frequently turn into multi-leg trades with a lot of movement!
Top Institutionally Backed Gainers
Top Institutionally Backed Losers
Last Week’s Billion-Dollar Prints
Tickers that printed a trade worth at least $1B last week get a special shout-out… Welcome to the club. Subs can use this convenience link to pull-up the same screen shown below. These are massive commitments by institutions that should not be ignored.
Investments In Focus: Bull vs Bear Arguments
Please read “Institutional S/R Levels For Major Indices” at the top of this stack to understand the nature and importance of what we’re looking at here visually. Institutions leave footprints that VolumeLeaders.com can illustrate for you while providing context to assess things like institutional conviction and urgency. Theses and data given below are not financial advice, just personal observations that may be wrong; consult a certified financial advisor before making any investment decisions.
FTNT 0.00%↑
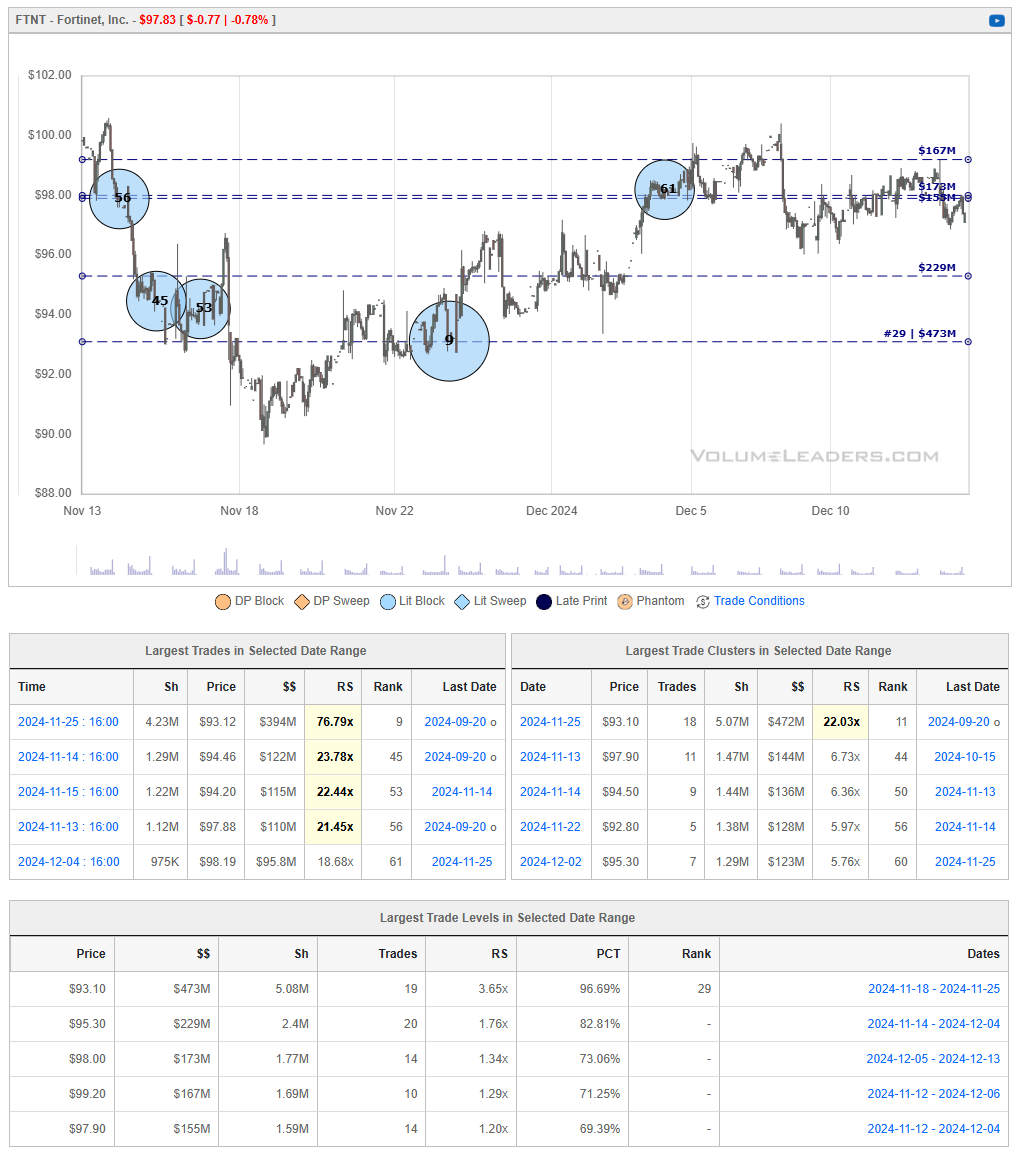
Over the past year, Fortinet's stock has demonstrated significant growth, with a year-to-date increase of approximately 69%. This performance underscores the company's strong position in the cybersecurity sector.
Financial Highlights: In the third quarter of 2024, Fortinet reported a 53% increase in adjusted earnings per share to $0.63 and a 13% rise in revenue to $1.51 billion. Product revenue grew for the first time in over a year, and billings rose 6% to $1.58 billion. The company anticipates a rebound in firewall appliance sales by 2026, potentially adding $400 to $450 million in product revenue.
Market Position and Outlook: Fortinet continues to strengthen its market position by focusing on Secure Access Service Edge (SASE) solutions, addressing the evolving needs of network security. Analysts remain optimistic about the company's growth prospects, citing its leadership in the global firewall market and strategic initiatives to capitalize on emerging cybersecurity trends.
Recent Developments:
Partnerships: Fortinet has been selected as the "Preferred Partner" for the NHL's Vancouver Canucks, providing its Security Fabric Platform and Secure SD-WAN solutions to enhance the team's cybersecurity infrastructure.
Product Innovations: The company launched FortiAppSec Cloud, a unified platform that consolidates web application security and performance capabilities, aiming to provide comprehensive protection across multi-cloud environments.
Bull Thesis for Fortinet, Inc. (FTNT):
Market Leadership in Cybersecurity: Fortinet is a leader in the global firewall and network security markets, providing integrated security solutions that cater to a wide range of industries. Its FortiGate product line continues to dominate in market share, reinforcing its competitive position.
Strong Financial Performance: Fortinet reported a 53% increase in adjusted EPS and a 13% revenue growth year-over-year in Q3 2024. With billings rising 6% and a rebound in product revenue, the company demonstrates robust financial health and operational efficiency.
Expansion into Emerging Technologies: The company's focus on Secure Access Service Edge (SASE) and artificial intelligence-driven cybersecurity solutions positions it well to address the evolving needs of enterprises transitioning to hybrid cloud and remote work environments.
Strategic Partnerships: Partnerships such as the one with the Vancouver Canucks showcase Fortinet’s ability to expand its footprint and reinforce its brand in new and diverse markets.
High Margins and Profitability: Fortinet’s focus on software and subscription-based models contributes to its healthy margins, with recurring revenue streams offering stability and predictability in its financial performance.
Bear Thesis for Fortinet, Inc. (FTNT):
Product Revenue Dependency: While subscription and service revenue provide stability, Fortinet still relies heavily on product revenue, which can be volatile and subject to cyclical demand fluctuations, particularly in the firewall appliance segment.
Intense Market Competition: The cybersecurity space is highly competitive, with strong players such as Palo Alto Networks, CrowdStrike, and Zscaler vying for market share. This competition could pressure Fortinet’s pricing and margins.
Macroeconomic Uncertainty: Global economic challenges, including constrained IT budgets and reduced corporate spending, could slow demand for Fortinet’s products and services.
Execution Risks: As Fortinet expands into new markets and technologies, it faces execution risks, including successful integration of new offerings and maintaining the quality and reliability of its solutions.
Stock Valuation Concerns: Fortinet's stock has seen substantial gains in recent years, potentially leaving it overvalued relative to peers. This could limit further upside, especially if growth slows or misses expectations.
VSCO 0.00%↑
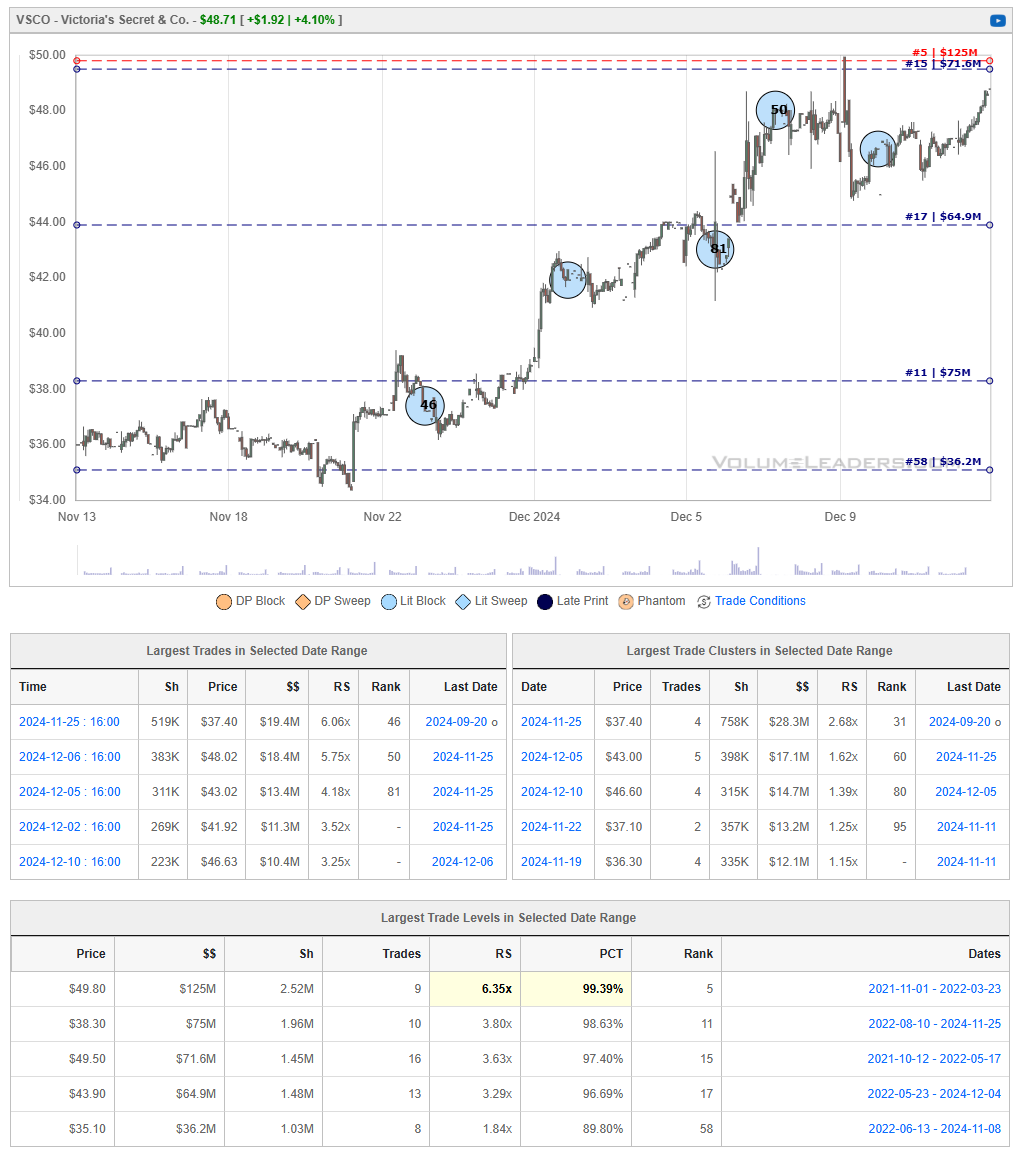
Victoria's Secret & Co. (VSCO) is a leading specialty retailer of lingerie, pajamas, and beauty products, including prestige fragrances and body care. As of December 14, 2024, the stock is trading at $48.71, reflecting a 4.08% increase from the previous close.
Recent Financial Performance:
Third Quarter Results: The company reported a net loss of $56 million, or $0.71 per share, improving from a net loss of $71 million, or $0.92 per share, in the same quarter last year. Adjusted losses were $0.50 per share, better than analysts' expectations of a $0.62 loss per share. Revenue increased by 7% year-over-year to $1.35 billion, surpassing the anticipated $1.29 billion.
Revised Sales Outlook: Following strong performances during key sales periods, including back-to-school and the launch of new sportswear lines, Victoria's Secret raised its full-year sales growth forecast to 1%-2%, up from the previous expectation of a 1% decline.
Recent Developments:
Product Launches: The company successfully introduced the VSX sport line and reinstated the Victoria's Secret Fashion Show, contributing to increased consumer engagement.
Leadership Changes: Hillary Super, the CEO, noted broad-based strength across all regions, channels, and brands, including Victoria's Secret, PINK, and Adore Me.
Analyst Perspectives:
Upgraded Ratings: UBS upgraded Victoria's Secret from a 'Sell' to a 'Neutral' rating, citing an inflection in comparable sales during the third quarter.
Price Target Adjustments: Jefferies Financial Group increased the price target from $30 to $40, maintaining a 'Buy' rating, reflecting confidence in the company's strategic direction.
Market Performance:
Year-to-date, VSCO shares have gained over 60%, indicating strong investor confidence. The stock's 52-week range has seen a low of $15.03 and a high of $48.71, with the current price at the upper end of this spectrum.
Bull Thesis for Victoria's Secret & Co. (VSCO):
Revenue Growth and Upgraded Outlook: Victoria’s Secret reported a 7% year-over-year increase in Q3 revenue to $1.35 billion, exceeding expectations. The company also raised its full-year sales growth forecast to 1%-2%, reflecting strong consumer demand and effective product strategies.
Successful Product Launches: The launch of the VSX sportswear line and the revival of the Victoria's Secret Fashion Show have resonated with customers, driving engagement and sales across regions and channels.
Restructured Leadership and Brand Strategy: Under CEO Hillary Super, the company is revitalizing its brand image, focusing on inclusivity and broadening its product portfolio to attract a diverse customer base, which has strengthened market perception and customer loyalty.
Digital Transformation: Victoria’s Secret continues to invest in its e-commerce platform, enhancing its digital presence and omnichannel capabilities, which are essential for adapting to shifting consumer behaviors.
Improved Margins and Operational Efficiency: Cost-saving initiatives and inventory management have improved operational efficiency, setting the company up for sustainable profitability as it moves into 2025.
Bear Thesis for Victoria's Secret & Co. (VSCO):
Declining Profitability: Despite revenue growth, Victoria’s Secret reported a net loss of $56 million in Q3, indicating ongoing challenges in achieving consistent profitability amid competitive pressures and rising operational costs.
Intense Market Competition: The intimate apparel and activewear market is highly competitive, with brands like Aerie, Savage X Fenty, and others aggressively gaining market share, potentially limiting Victoria's Secret’s growth prospects.
Legacy Brand Challenges: The brand continues to navigate a challenging transition from its past image, and while progress has been made, overcoming entrenched consumer perceptions remains an uphill battle.
Macroeconomic Risks: Slowing consumer spending due to broader economic uncertainties and inflationary pressures could impact discretionary purchases, particularly in premium segments like lingerie and activewear.
Stock Overperformance Risk: After a 60% year-to-date rally, the stock may be priced for perfection. Any missteps in execution or weaker-than-expected holiday sales could lead to a significant pullback, especially given its already elevated valuation.
BAM 0.00%↑
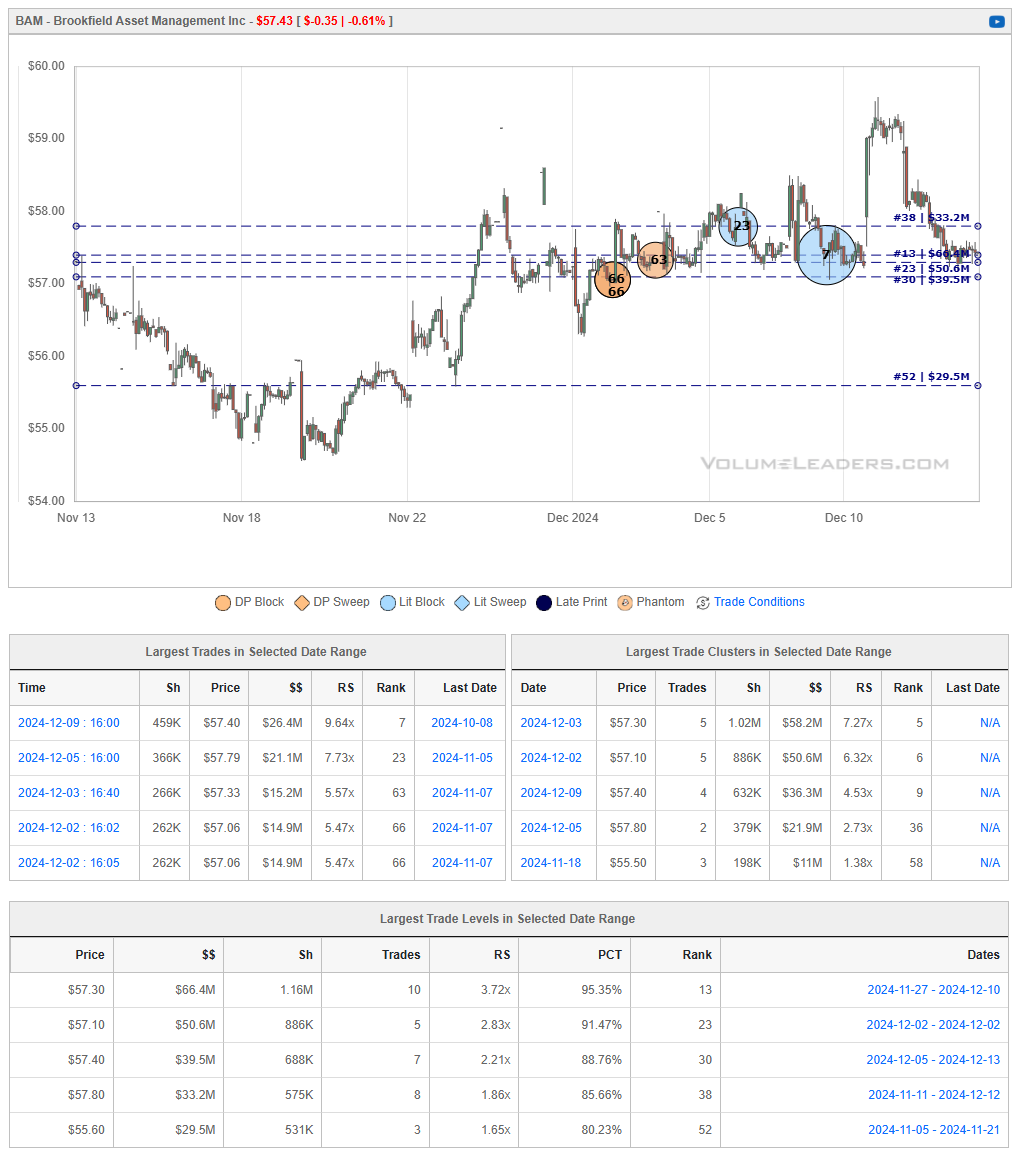
Brookfield Asset Management Ltd. (BAM) is a leading global alternative asset manager, specializing in real estate, infrastructure, renewable power, and private equity. As of December 14, 2024, BAM's stock is trading at $57.43, reflecting a slight decrease of 0.59% from the previous close.
Recent Financial Performance:
Assets Under Management (AUM): BAM's AUM has surpassed $1 trillion, indicating significant growth and effective capital deployment across various sectors.
Capital Raising: In the third quarter, the company raised $21 billion, bolstering its investment capabilities and expanding its global footprint.
Strategic Developments:
Structural Simplification: BAM is nearing the completion of its structural simplification process, which has narrowed its valuation discount and attracted significant investment, notably from hedge fund manager Bill Ackman.
Headquarters Relocation: The company is considering moving its headquarters to New York to be included in various U.S. stock market indices, aiming to broaden its shareholder base and increase stock liquidity.
Analyst Perspectives:
Consensus Rating: BAM has received a consensus 'Hold' rating, with an average twelve-month stock price forecast of $53.46, suggesting a potential downside from the current price.
Institutional Interest: Notably, Bill Ackman's Pershing Square Capital Management has significantly increased its stake in BAM, indicating confidence in the company's long-term prospects.
Bull Thesis for Brookfield Asset Management Ltd. (BAM):
Robust Asset Growth: Surpassing $1 trillion in AUM demonstrates BAM's effective capital deployment and strong position in the alternative asset management industry.
Successful Capital Raising: Raising $21 billion in the third quarter enhances BAM's investment capabilities, allowing for strategic acquisitions and expansion into high-growth sectors.
Structural Simplification Benefits: Simplifying its corporate structure has reduced the valuation discount and attracted significant investments, such as from Bill Ackman, reflecting increased investor confidence.
Potential Index Inclusion: Relocating headquarters to New York could lead to inclusion in major U.S. stock indices, potentially increasing stock liquidity and attracting a broader investor base.
Diversified Investment Portfolio: BAM's investments across real estate, infrastructure, renewable energy, and private equity provide diversified income streams and reduce exposure to sector-specific risks.
Bear Thesis for Brookfield Asset Management Ltd. (BAM):
Complex Organizational Structure: Despite efforts to simplify, BAM's complex structure may still pose challenges for investors in fully understanding the company's operations and valuation.
Exposure to Real Estate Market Volatility: High exposure to the real estate sector makes BAM susceptible to market downturns, which could negatively impact its financial performance.
Interest Rate Sensitivity: As an asset manager with significant investments in infrastructure and real estate, BAM's performance is sensitive to interest rate fluctuations, which can affect asset valuations and investment returns.
Regulatory Risks: Operating across multiple jurisdictions exposes BAM to varying regulatory environments, which could impact its operations and profitability.
Market Competition: The alternative asset management industry is highly competitive, with peers potentially better positioned in certain markets, which could affect BAM's market share and growth prospects.
MOMO 0.00%↑
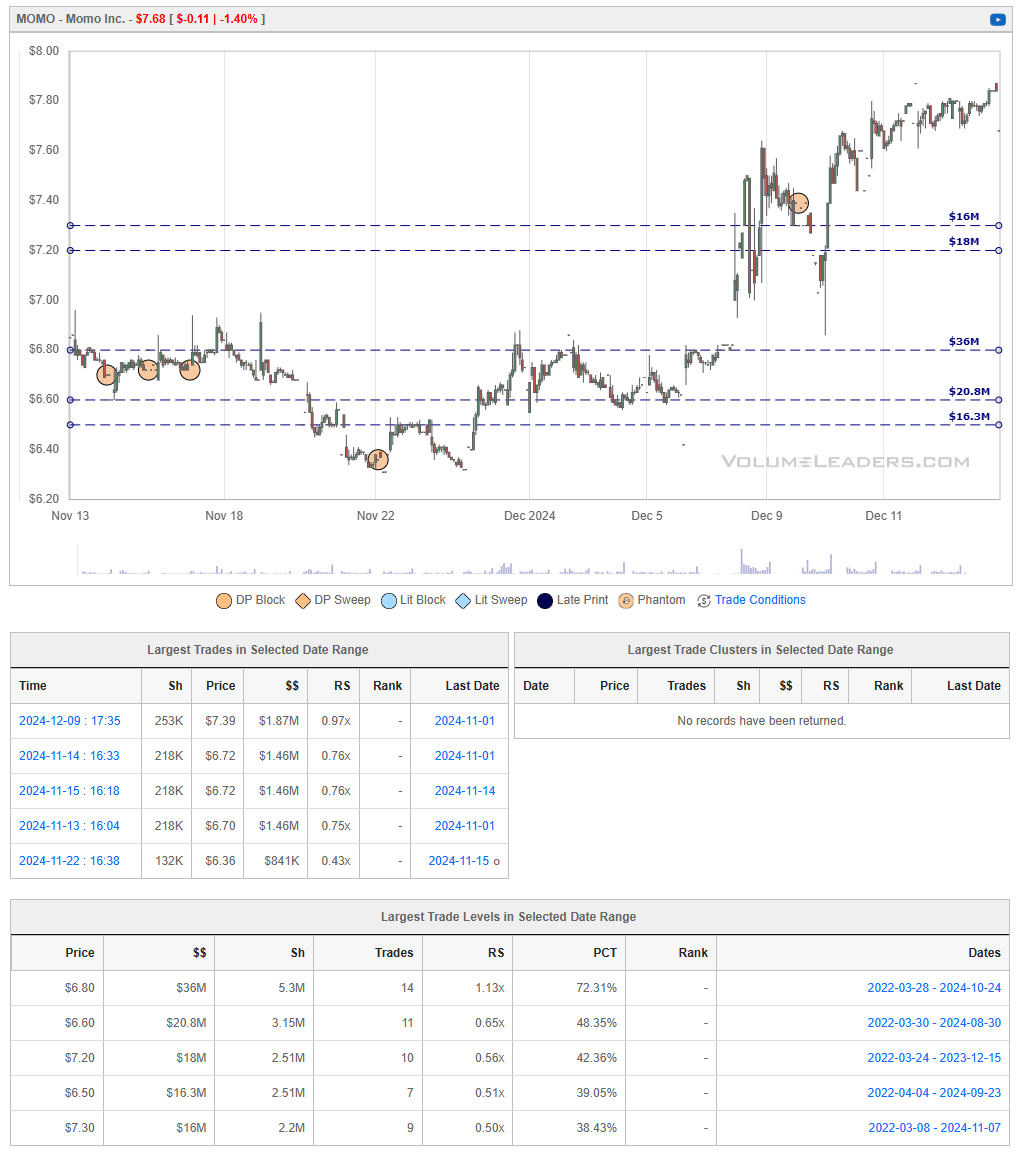
Hello Group Inc. (NASDAQ: MOMO), formerly known as Momo Inc., is a leading mobile-based social networking platform in China, offering services such as live streaming, value-added services, and mobile games. As of December 14, 2024, the stock is trading at $7.84, reflecting a modest increase from the previous close.
Recent Financial Performance:
Third Quarter Results: Hello Group reported a net income of $186.02 million for the trailing twelve months, with total revenue reaching $1.56 billion. The company maintains a price-to-earnings (P/E) ratio of 7.75, indicating a potentially undervalued stock relative to its earnings.
Analyst Perspectives:
Consensus Rating: The stock holds a consensus 'Buy' rating from three analysts, with an average 12-month price target of $8.67, suggesting a potential upside of approximately 10.59% from the current price.
Bull Thesis for Hello Group Inc. (MOMO):
Strong Financial Position: Hello Group's substantial net income and favorable P/E ratio indicate robust financial health, positioning the company well for future growth and investment opportunities.
Analyst Confidence: The 'Buy' consensus and projected price target reflect analyst confidence in the company's strategic direction and potential for stock appreciation.
Market Leadership: As a prominent player in China's social networking space, Hello Group benefits from a large user base and diversified revenue streams, including live streaming and value-added services.
Strategic Rebranding: The transition from Momo Inc. to Hello Group signifies a broader strategic vision, potentially attracting a wider audience and enhancing market presence.
Growth Opportunities: The expanding digital economy in China offers significant opportunities for Hello Group to innovate and capture additional market share through new services and technological advancements.
Bear Thesis for Hello Group Inc. (MOMO):
Regulatory Challenges: Operating within China's stringent regulatory environment poses risks, as policy changes can impact business operations and revenue streams.
Intense Competition: The Chinese social networking market is highly competitive, with numerous platforms vying for user engagement, which could pressure Hello Group's market share and profitability.
User Base Fluctuations: Variations in active user numbers can affect advertising revenue and overall financial performance, posing a risk to consistent growth.
Dependence on Live Streaming: A significant portion of revenue derives from live streaming services, making the company vulnerable to shifts in consumer preferences and potential regulatory scrutiny in this sector.
Market Volatility: As a Chinese ADR listed on the NASDAQ, Hello Group's stock is subject to volatility due to geopolitical tensions and broader market dynamics affecting Chinese companies listed abroad.
MRVL 0.05%↑
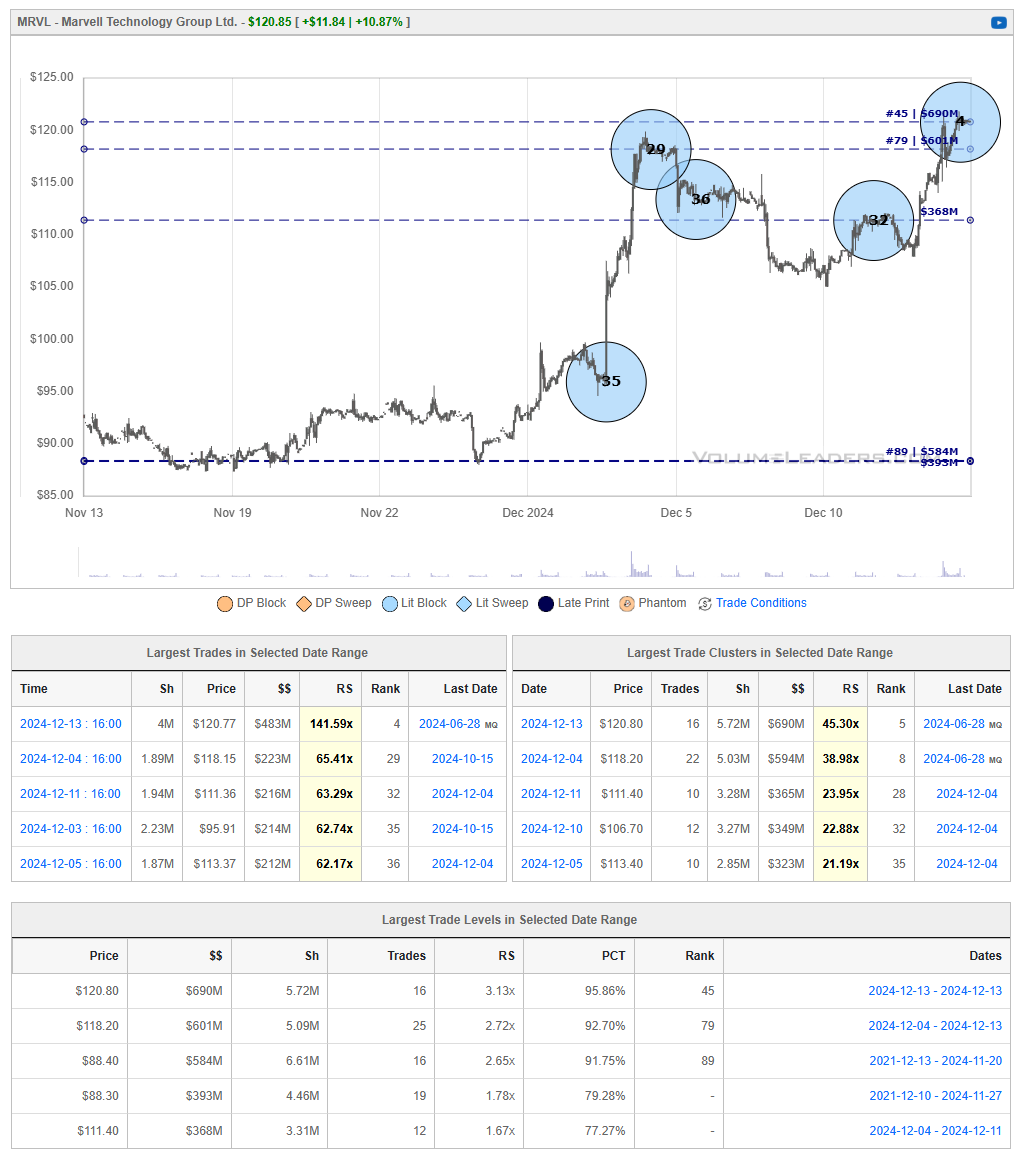
Marvell Technology Inc. (NASDAQ: MRVL) is a leading semiconductor company specializing in data infrastructure solutions, including custom AI chips, networking, and storage products. As of December 14, 2024, MRVL is trading at $120.77, reflecting a significant increase of approximately 10.9% from the previous close.
Recent Financial Performance:
Third Quarter Results: Marvell reported adjusted earnings of $0.43 per share on revenues of $1.516 billion, surpassing analysts' expectations of $0.41 per share on $1.46 billion in revenue. This performance was driven by strong demand for its custom AI chips.
Revenue Composition: Data center sales have grown significantly, now constituting 72% of Marvell's revenue, up from 40% the previous year, indicating a strategic shift towards high-growth markets.
Strategic Developments:
Partnerships: Marvell has entered a five-year agreement with Amazon Web Services (AWS) to design AI chips, enhancing its position in the AI infrastructure market.
Product Innovation: The company introduced a 1.6 Tbps LPO chipset to enable optical short-reach, scale-up compute fabric interconnects, addressing speed and reach limitations in data centers.
Analyst Perspectives:
Market Position: Analysts predict Marvell's market share in the AI chip sector will increase to 3.7% by the end of the decade, reflecting confidence in its growth trajectory.
Stock Performance: The stock has nearly doubled in 2024, driven by its advancements in AI technology and strategic partnerships.
Bull Thesis for Marvell Technology Inc. (MRVL):
Robust AI Chip Demand: Marvell's custom AI chips have seen substantial demand, contributing to significant revenue growth and positioning the company as a key player in the AI infrastructure market.
Strategic Partnerships: Collaborations with industry leaders like AWS enhance Marvell's technological capabilities and market reach, fostering innovation and revenue diversification.
Product Innovation: The development of advanced products, such as the 1.6 Tbps LPO chipset, demonstrates Marvell's commitment to addressing industry challenges and meeting evolving customer needs.
Market Share Expansion: Analyst projections indicate an increase in Marvell's market share within the AI chip sector, suggesting a positive growth trajectory.
Stock Performance: The significant appreciation of Marvell's stock reflects investor confidence in its strategic direction and financial health.
Bear Thesis for Marvell Technology Inc. (MRVL):
Market Competition: The semiconductor industry is highly competitive, with established players like Nvidia and AMD potentially limiting Marvell's market share growth.
Dependence on Key Partnerships: Reliance on major partnerships, such as with AWS, may pose risks if these collaborations face challenges or fail to deliver expected outcomes.
Valuation Concerns: The rapid increase in stock price may lead to overvaluation, potentially resulting in volatility if financial performance does not meet heightened investor expectations.
Technological Risks: The fast-paced nature of semiconductor innovation requires continuous investment in R&D; failure to keep pace could erode Marvell's competitive advantage.
Macroeconomic Factors: Global economic uncertainties, including supply chain disruptions and fluctuating demand, could impact Marvell's operations and financial performance.
FTXL 0.00%↑
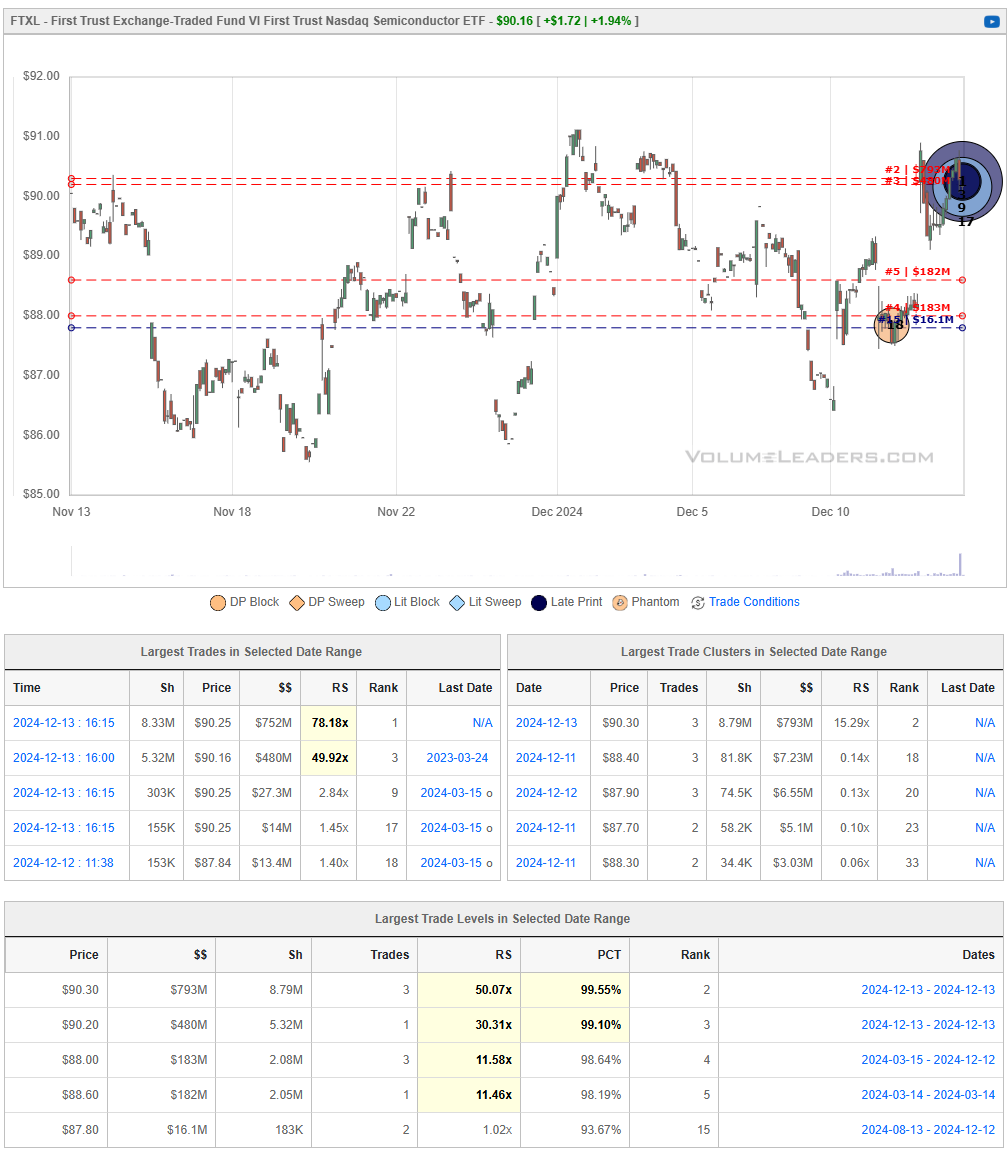
The First Trust Nasdaq Semiconductor ETF (FTXL) is an exchange-traded fund that tracks the Nasdaq US Smart Semiconductor Index, providing exposure to U.S. semiconductor companies. As of December 14, 2024, FTXL is trading at $90.16, reflecting a 2.04% increase from the previous close.
Fund Composition:
Top Holdings: The ETF's top holdings include NVIDIA Corporation (9.63%), Intel Corporation (9.11%), and Broadcom Inc. (8.33%).
Sector Allocation: FTXL is entirely allocated to the technology sector, focusing on semiconductor companies.
Performance Metrics:
Year-to-Date (YTD) Return: 8.82%
1-Year Return: 15.97%
Expense Ratio: 0.60%
Bull Case for FTXL:
Industry Growth: The semiconductor industry is experiencing robust growth due to increasing demand for electronic devices, artificial intelligence, and the Internet of Things (IoT), potentially enhancing FTXL's performance.
Diversified Exposure: FTXL offers diversified exposure to leading semiconductor companies, reducing the risk associated with individual stock volatility.
Technological Advancements: Continuous innovation in technology drives demand for semiconductors, positioning FTXL to benefit from industry advancements.
Market Demand: The proliferation of 5G technology and cloud computing increases the need for semiconductors, potentially boosting the ETF's holdings.
Economic Indicators: Positive economic indicators and increased consumer spending on technology products can contribute to the growth of semiconductor companies within FTXL.
Bear Case for FTXL:
Market Volatility: The semiconductor industry is subject to cyclical downturns, which can lead to significant volatility in FTXL's performance.
Supply Chain Disruptions: Global supply chain issues, such as chip shortages, can adversely affect the production capabilities of companies within the ETF.
Geopolitical Risks: Trade tensions and geopolitical conflicts can impact the semiconductor sector, potentially affecting FTXL's holdings.
Regulatory Challenges: Stricter regulations and government interventions in technology sectors may pose risks to the operations of semiconductor companies in the ETF.
Competition: Intense competition within the semiconductor industry can pressure profit margins of companies included in FTXL, potentially affecting overall returns.
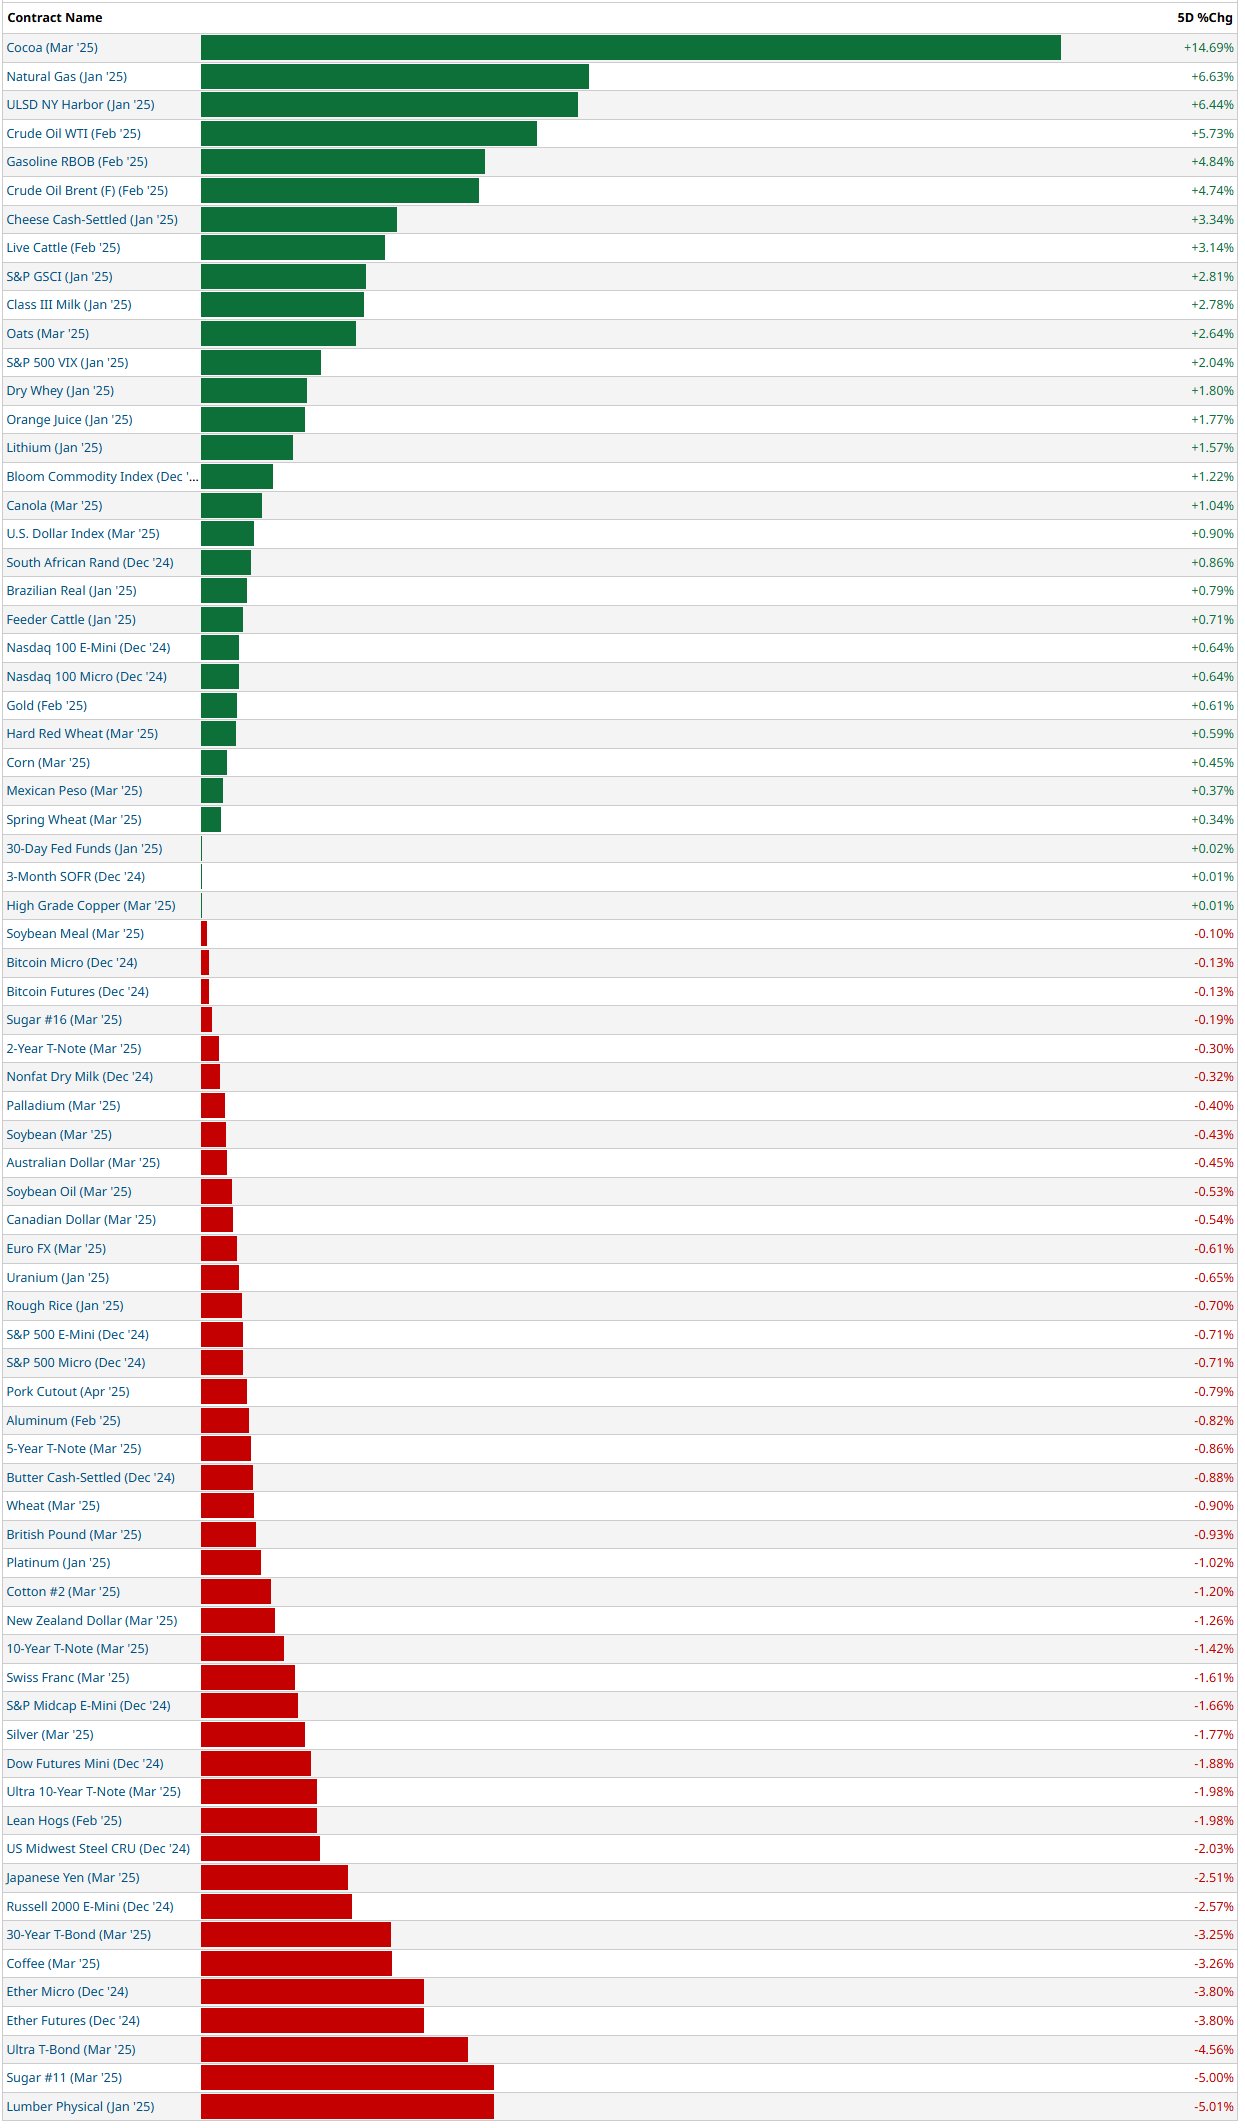
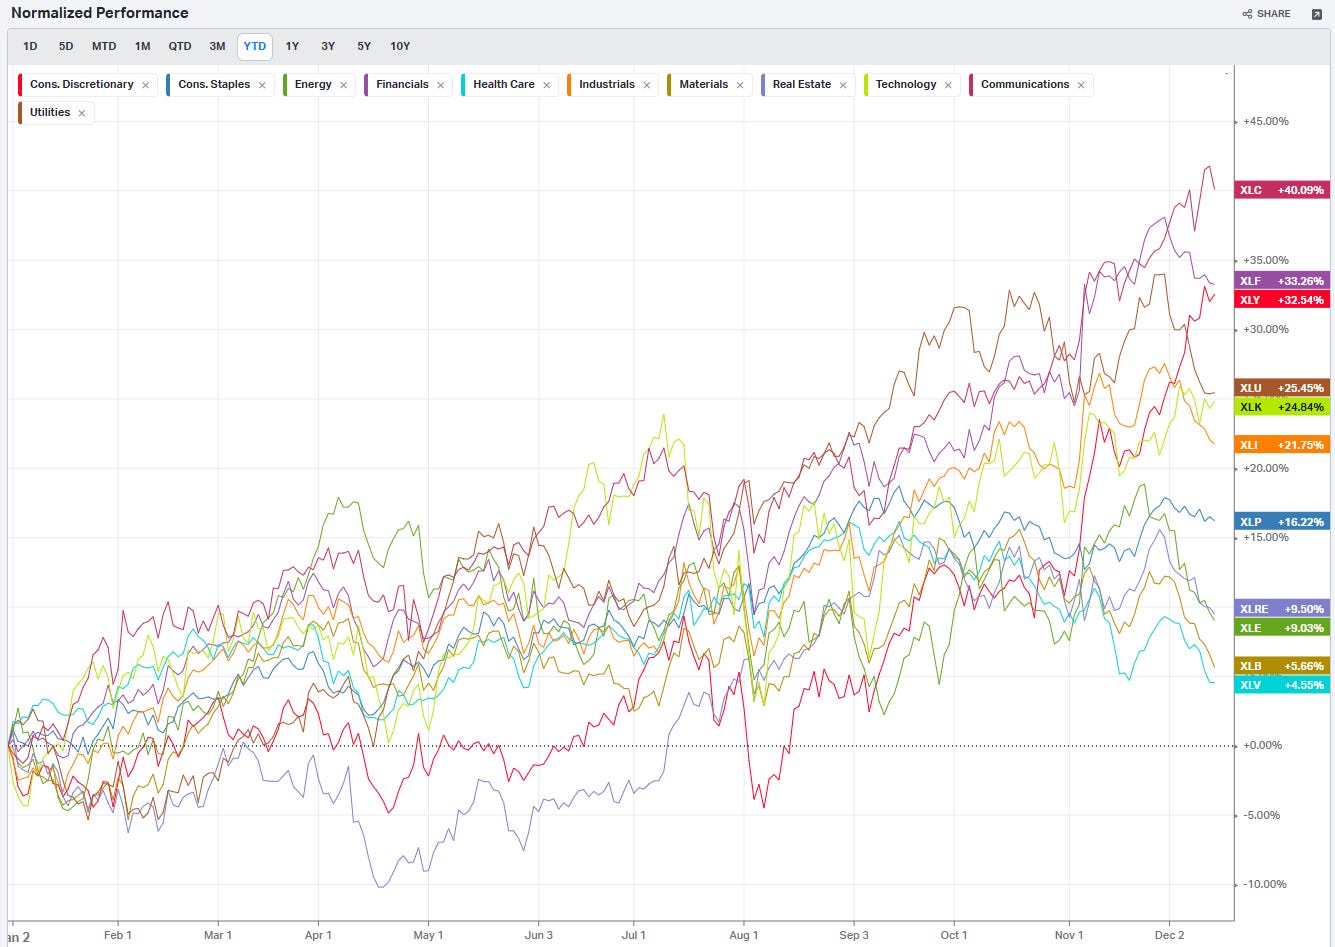
Summary Of Thematic Performance YTD
VolumeLeaders.com provides a lot of pre-built filters for thematics so that you can quickly dive into specific areas of the market. These performance overviews are provided here only for inspiration. Consider targeting leaders and/or laggards in the best and worst sectors, for example.
S&P By Sector
S&P By Industry

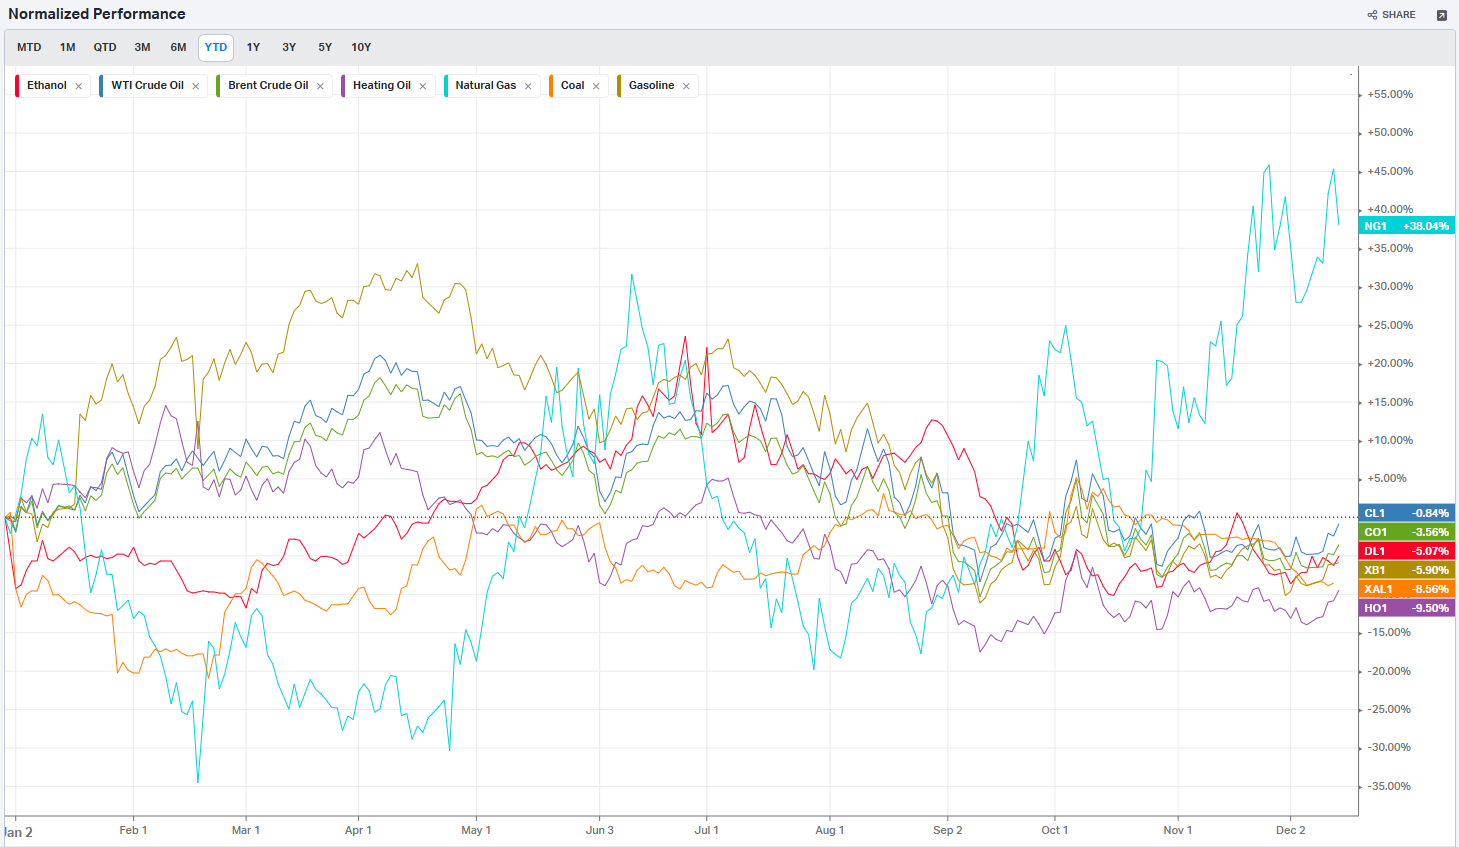
Commodities: Energy
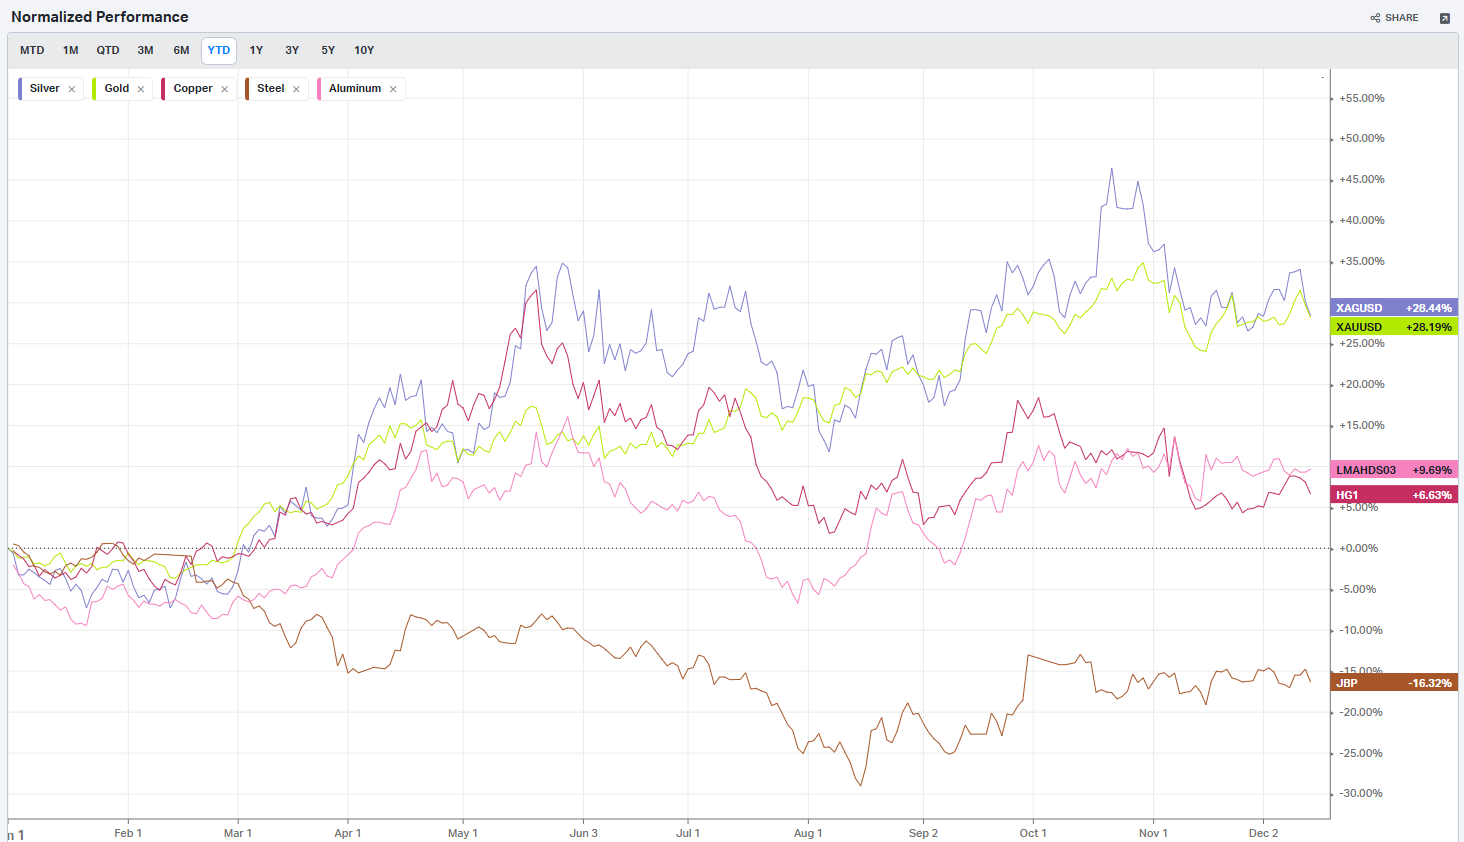
Commodities: Metals
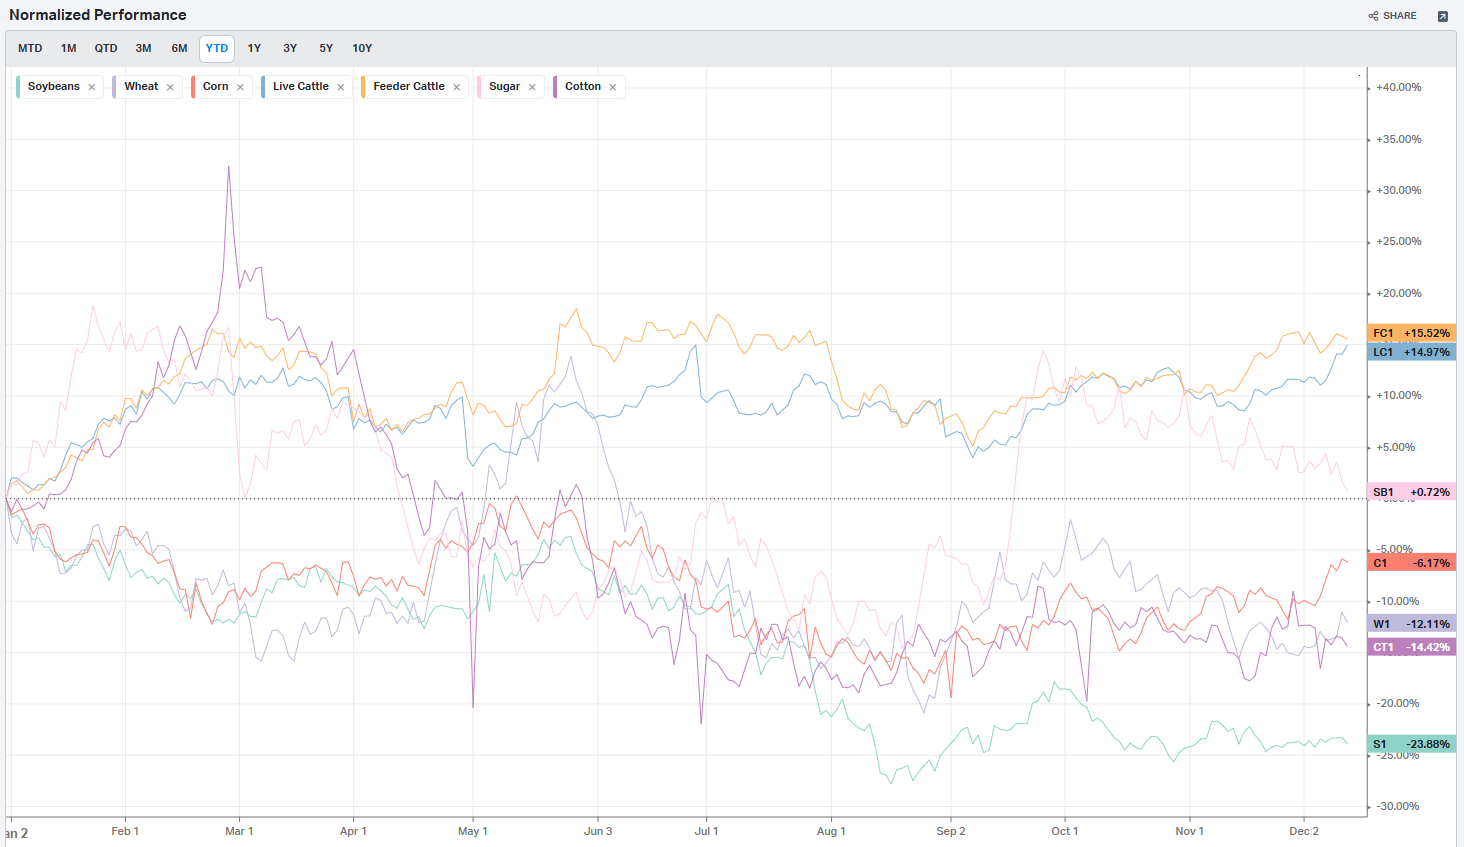
Commodities: Agriculture
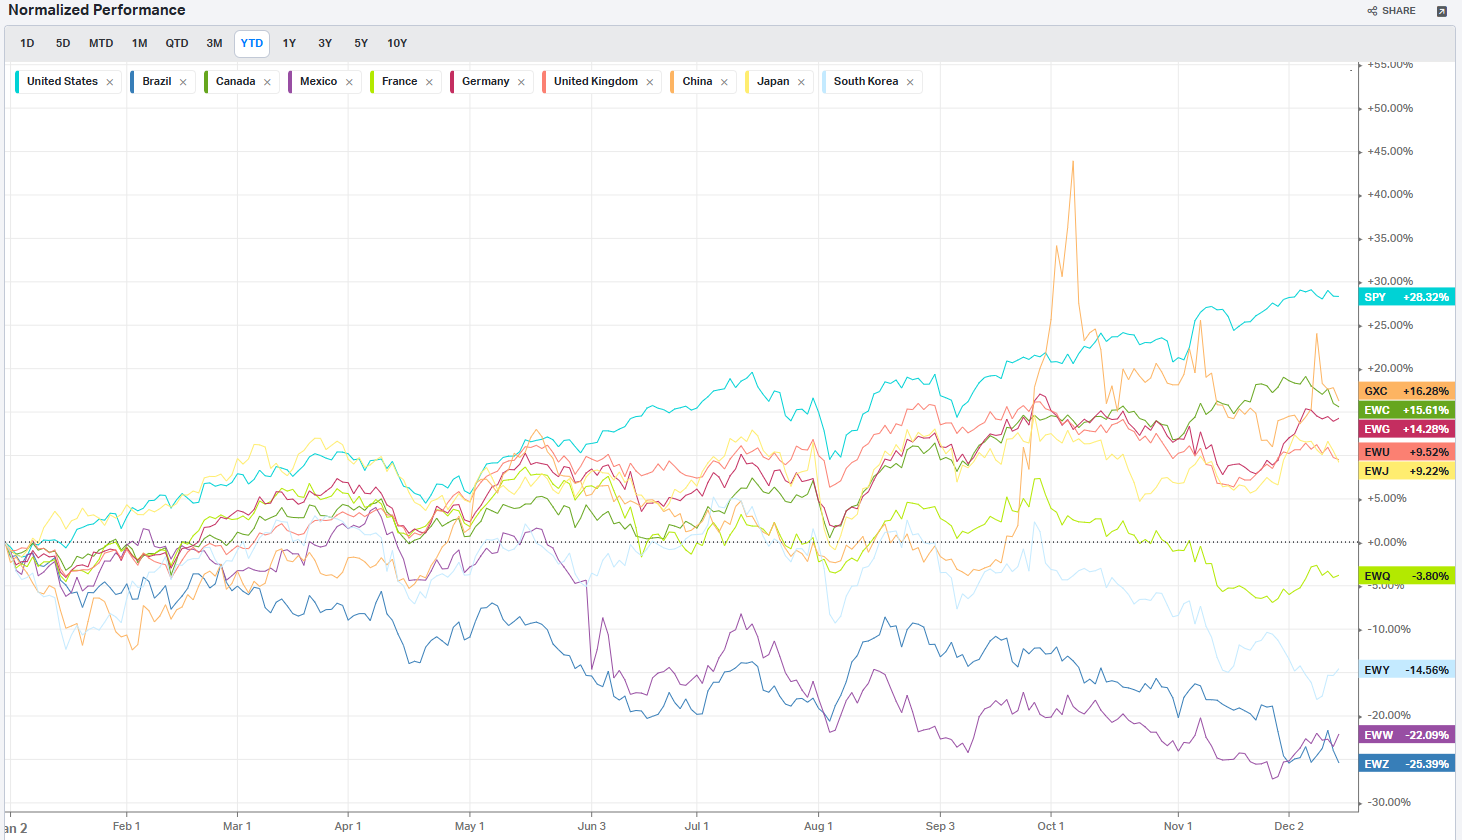
Country ETFs
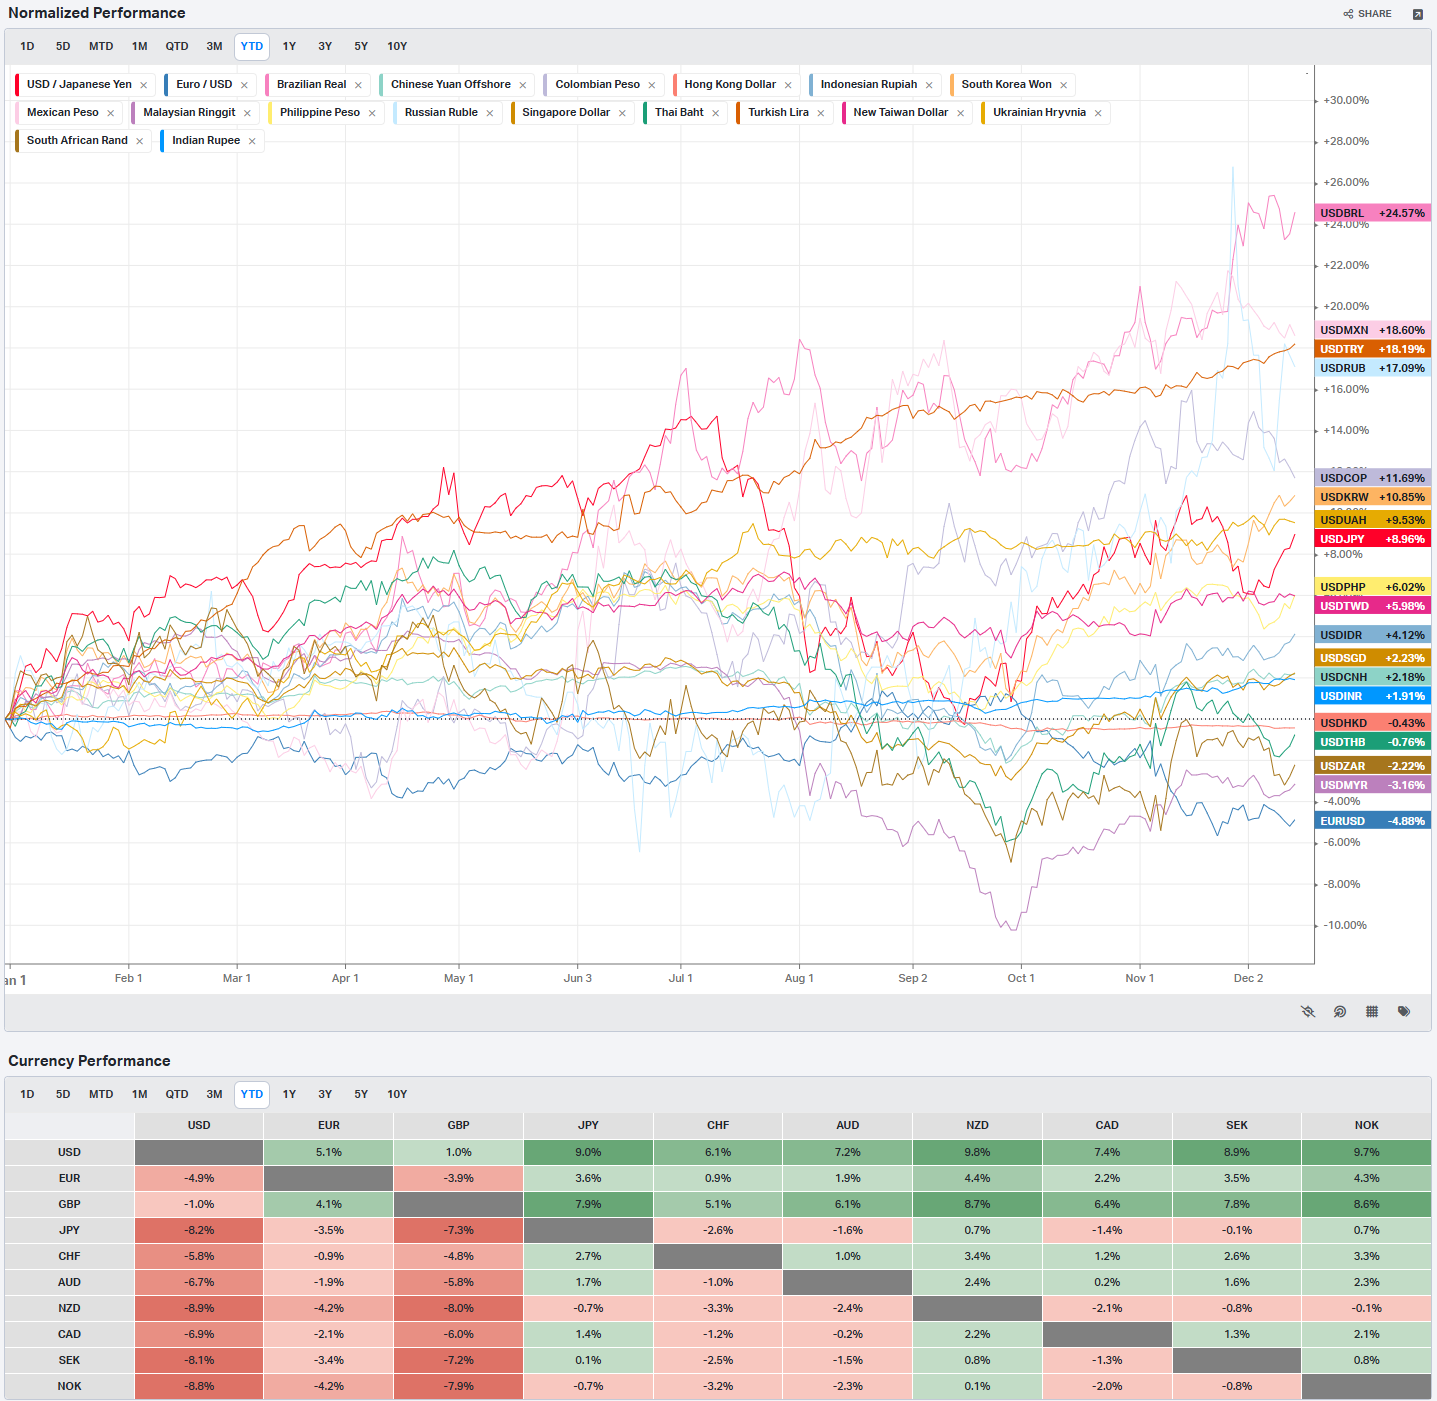
Currencies
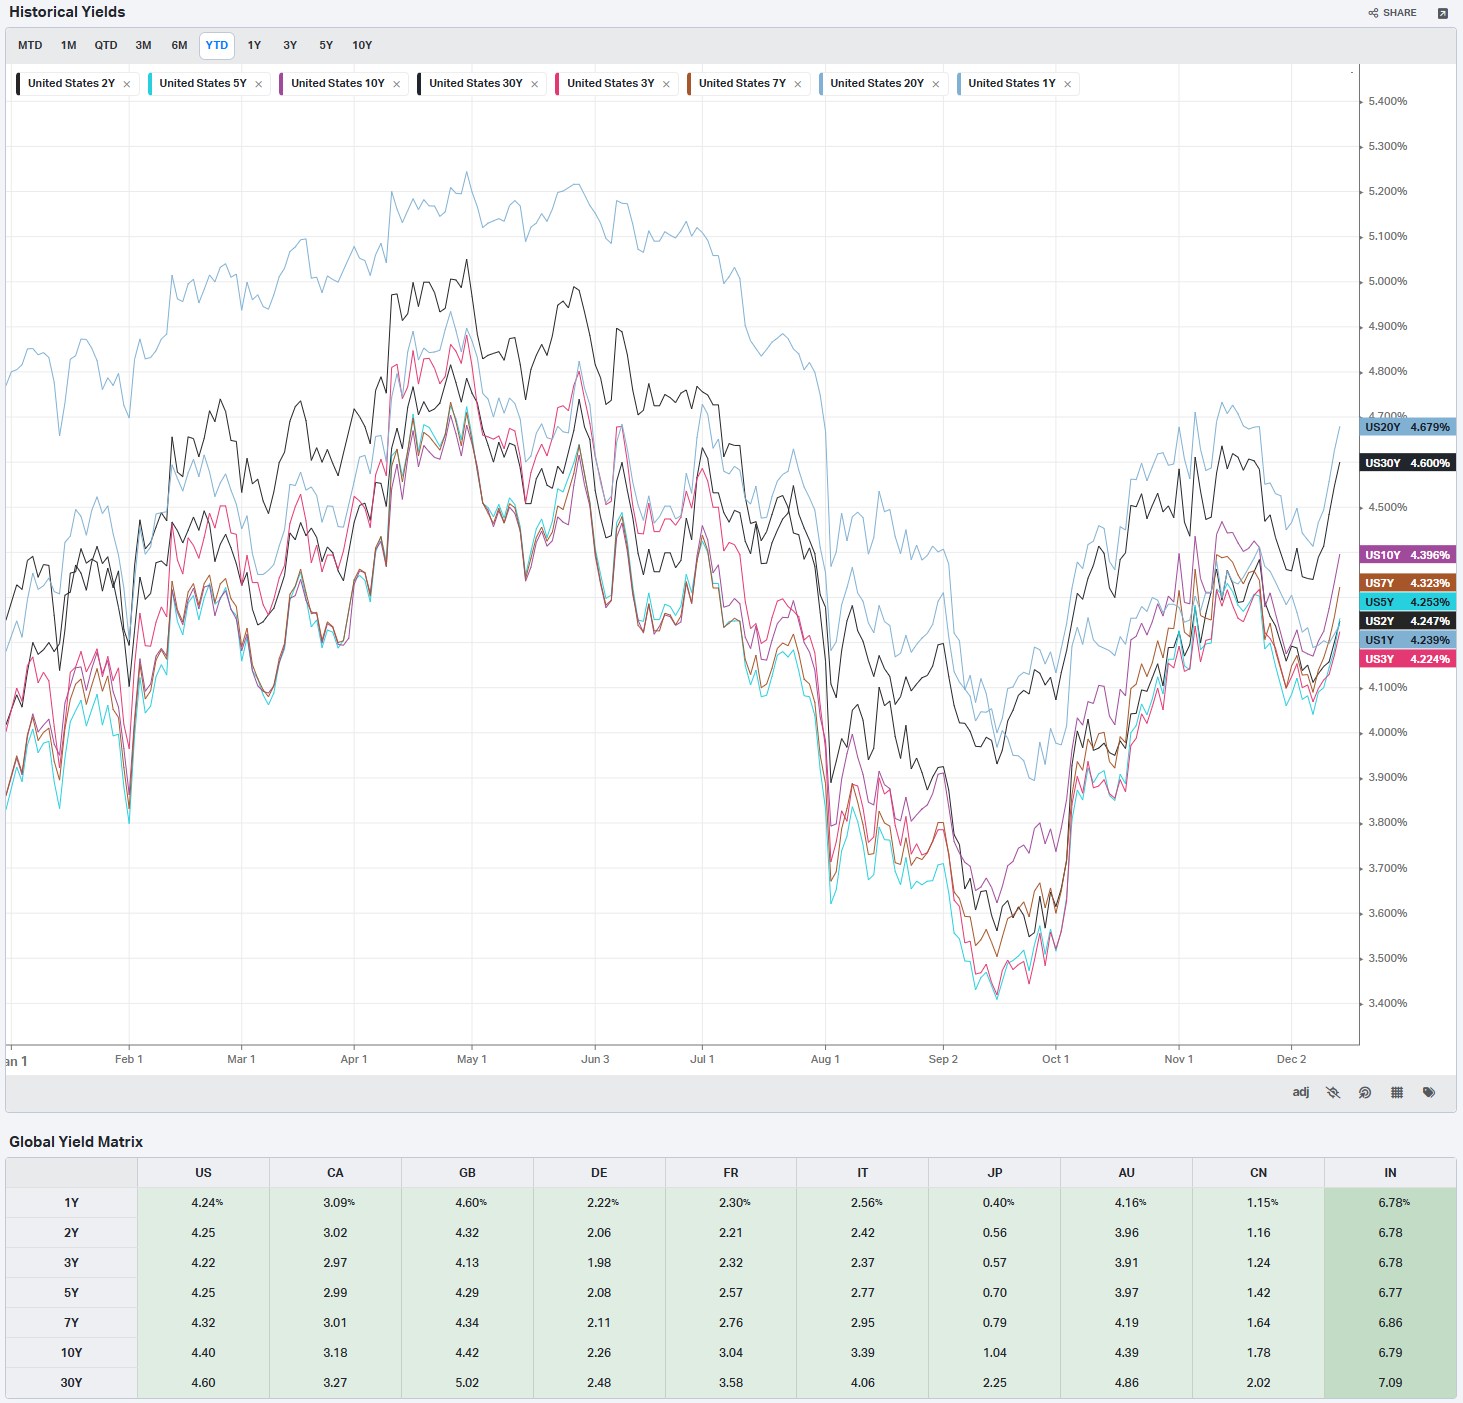
Global Yields
Factors: Style
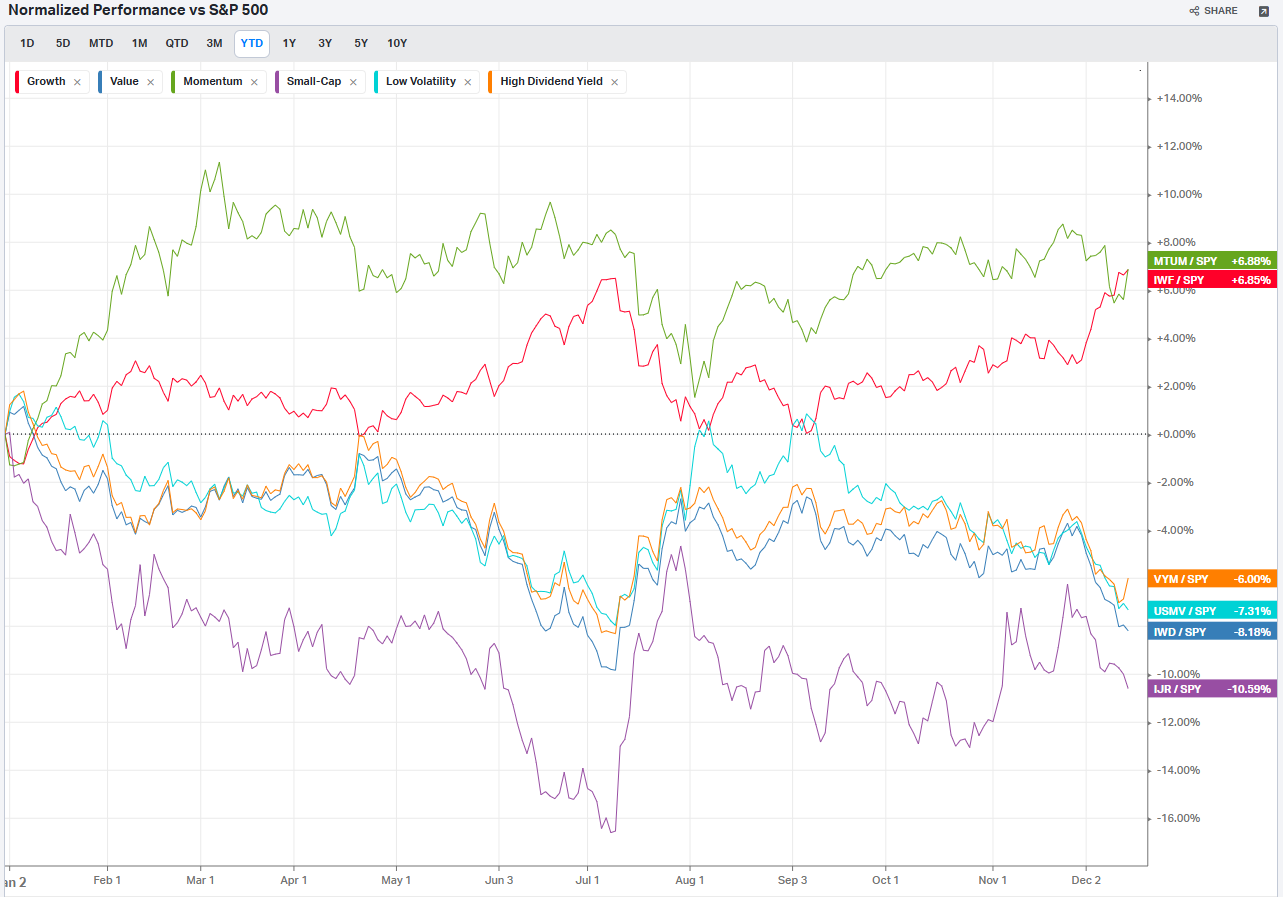
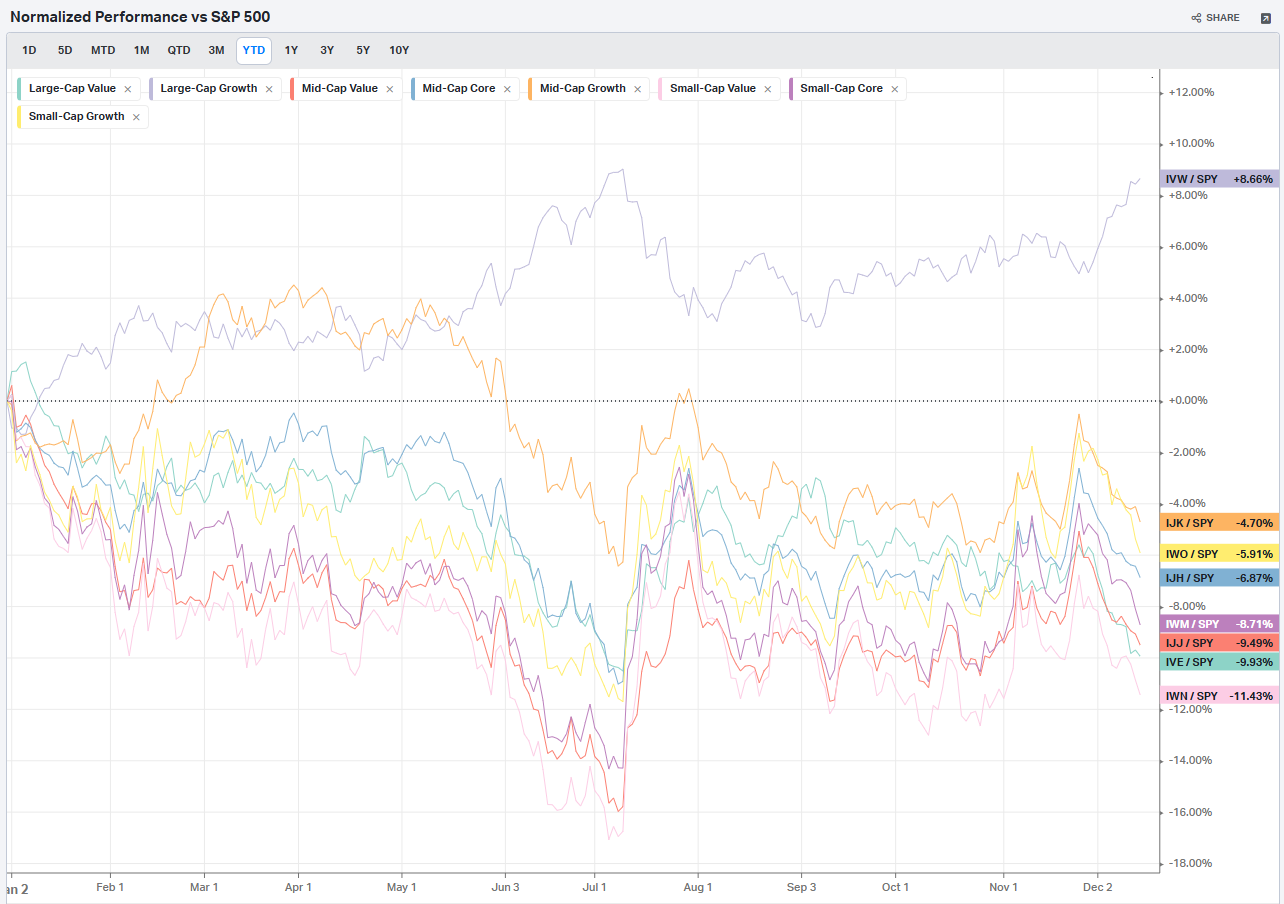
Factors: Size vs Value
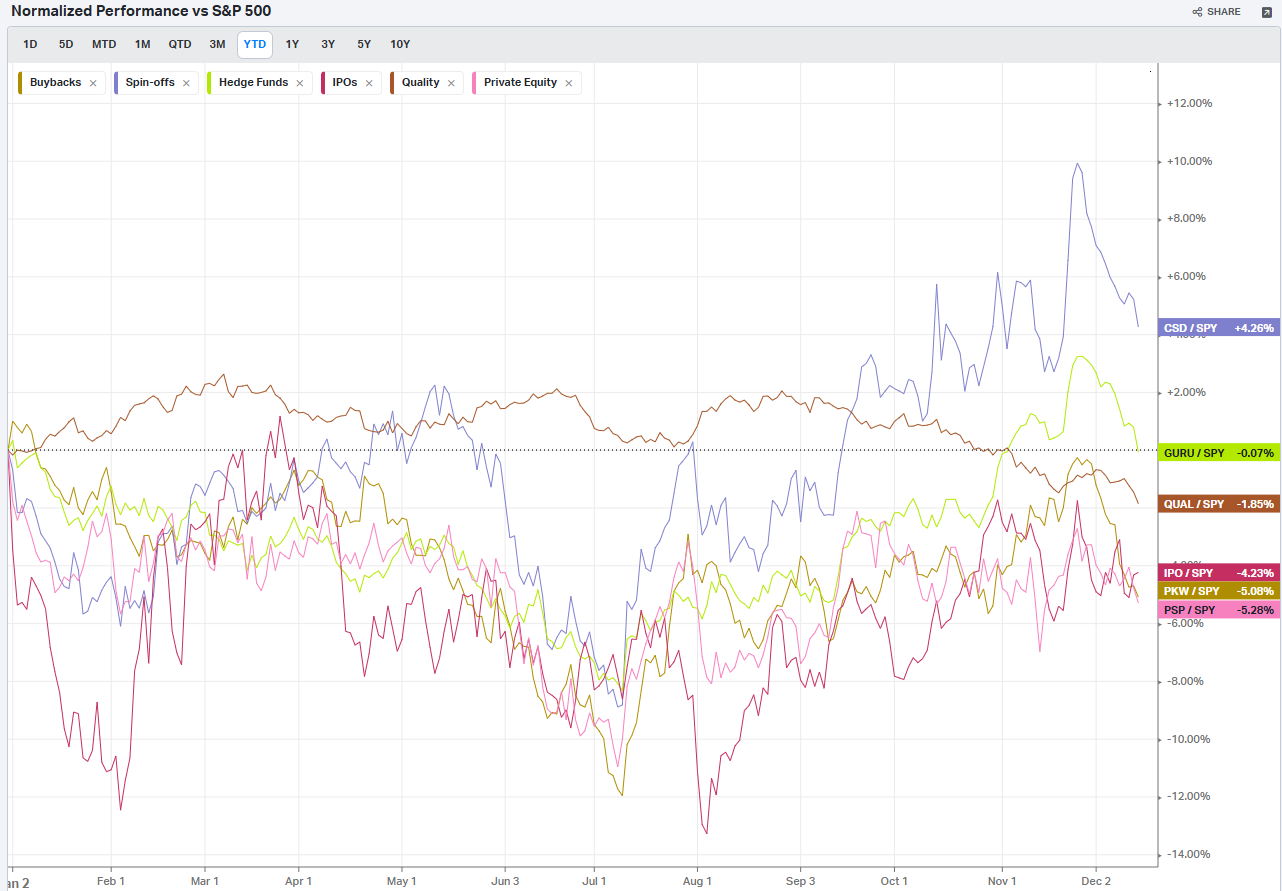
Factors: Qualitative
Social Media Favs
Analyzing social sentiment can provide valuable insights for investment strategies by offering a pulse on public perception, mood, and market sentiment that traditional financial indicators might not capture. Here’s how social sentiment analysis can enhance investment decisions:
Market Momentum: Positive or negative social sentiment can signal impending momentum shifts. When public opinion on a stock, sector, or asset class changes sharply, it can create buying or selling pressure, especially if that sentiment becomes widespread.
Early Detection of Trends: Social sentiment data can help investors spot trends before they show up in technical or fundamental data. For example, increased positive chatter around a particular company or sector might indicate growing interest or excitement, which could lead to price appreciation.
Gauge Retail Investor Impact: With the rise of retail investor platforms, collective sentiment on social media can lead to significant price movements (e.g., meme stocks). Understanding how retail investors view certain stocks can help in identifying high-volatility opportunities.
Event Reaction Monitoring: Social sentiment can provide real-time reactions to news events, product releases, or earnings reports. Investors can use this information to gauge market reaction quickly and adjust their strategies accordingly.
Complementing Quantitative Models: By adding a social sentiment layer to quantitative models, investors can enhance predictions. For example, a model that tracks historical price and volume data might perform even better when factoring in sentiment trends as a measure of market psychology.
Risk Management: Negative sentiment spikes can be a signal of potential downturns or increased volatility. By monitoring sentiment, investors might avoid or hedge against investments in companies experiencing a public relations crisis or facing negative perceptions.
Long-Term Sentiment Trends: Sustained sentiment trends, whether positive or negative, often mirror longer-term market cycles. Tracking sentiment trends over time can help identify shifts in investor psychology that could affect longer-term investments or sector rotations.
For these reasons, sentiment analysis, when combined with other tools, can provide a comprehensive view of both immediate market reactions and underlying investor attitudes, helping investors position themselves strategically across various time frames. Here are the most mentioned/discussed tickers on Reddit from some of the most active Subreddits for trading:
Events On Deck This Week
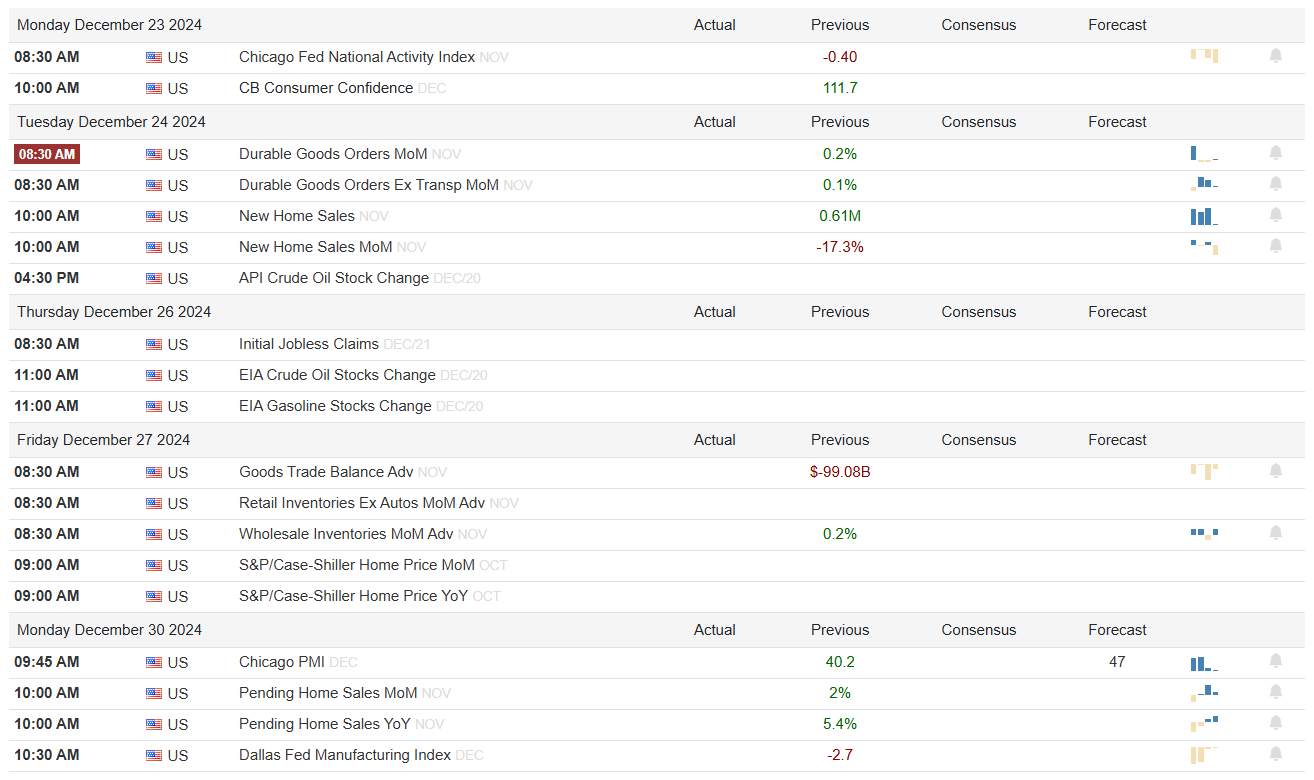
Here are key events happening this week that have the potential to cause outsized moves in the market or heightened short-term volatility.
Econ Events By Day of Week
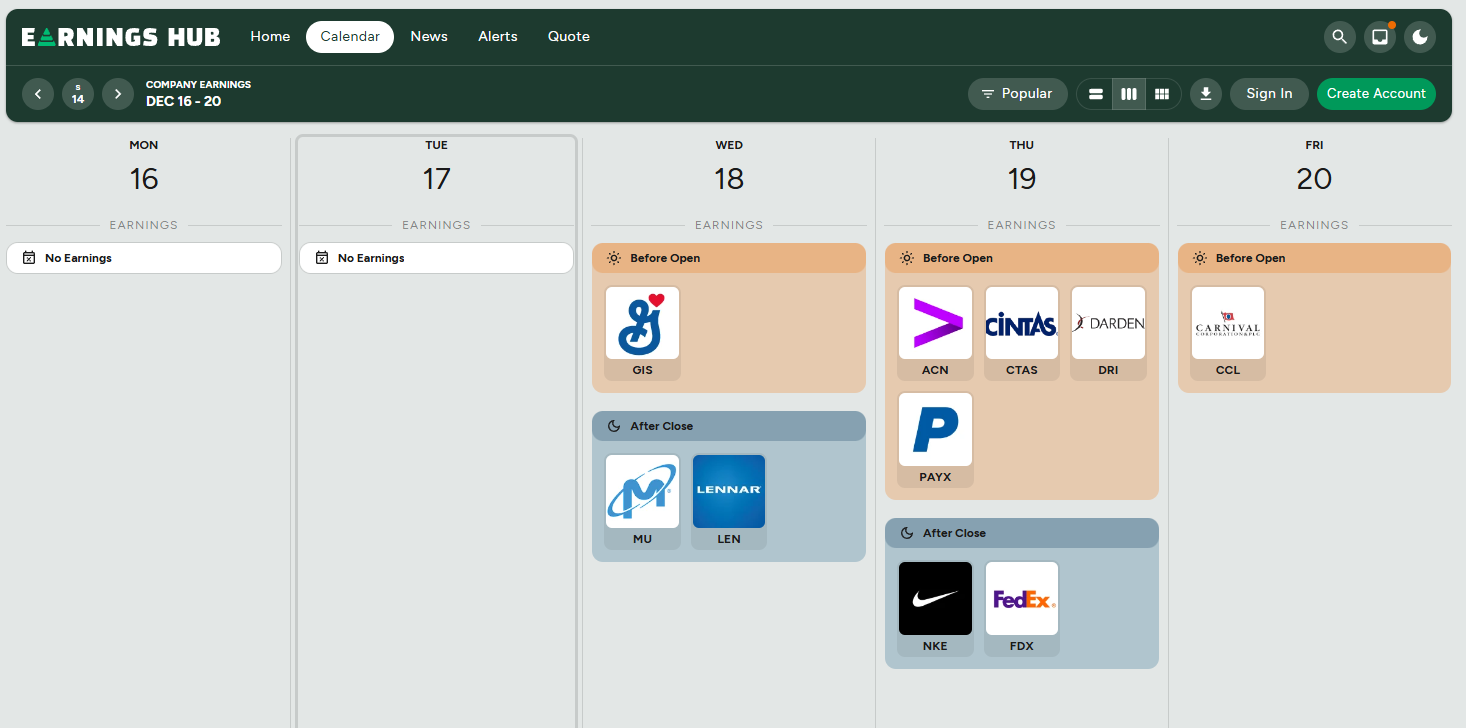
Anticipated Earnings By Day of Week
Thank you for being part of our community and for taking the time to read this publication. Your engagement and insights mean a great deal to all of us, and we're genuinely grateful to share this space with such dedicated and thoughtful readers. Wishing you a productive and successful week ahead in the markets. May the coming days bring clarity and great opportunities. Happy trading!