Market Momentum: Your Weekly Financial Forecast & Market Prep
Issue 23 / What to expect Nov 25, 2024 thru Nov 29, 2024

In This Issue
Market-On-Close: All of last week’s market-moving news and macro context in under 5 minutes.
Special Coverage: What’s driving gold higher? Where is it heading? Is there a bear case?
The Latest Investor Sentiment Readings
Institutional Support & Resistance Levels For Major Indices: Exactly where to look for a turn in markets this week in SPY, QQQ, IWM & DIA
Institutional Activity By Sector: Institutional flow by sector including top names in those sectors
Top Institutional Orderflow In Individual Names: All of the heaviest-hit individual names targeted by institutions this week on Lit & Dark exchanges
Investments In Focus: Bull vs Bear arguments for RDDT, SPHR, AZTA, VGLT, RGLD, FLEX
Top Institutionally-Backed Gainers & Losers: An explosive watchlist for day traders seeking high-volatility
Normalized Performance By Thematics YTD (Sector, Industry, Factor, Energy, Metals, Currencies, and more): which corners of the markets are beating benchmarks, overlooked and over-crowded
Key Econ Events and Earnings On-Deck For This Week

Market-On-Close
The U.S. equity markets displayed robust performance over the past week, highlighting resilience and optimism heading into the year-end and 2025. Despite elevated valuations and potential policy uncertainties, the markets sustained a positive trajectory, buoyed by strong corporate earnings, resilient economic fundamentals, and broader sector participation. This weekly review explores the key drivers of the market’s strength, emerging risks, and how investors can position themselves in an evolving landscape.
Market Overview and Performance
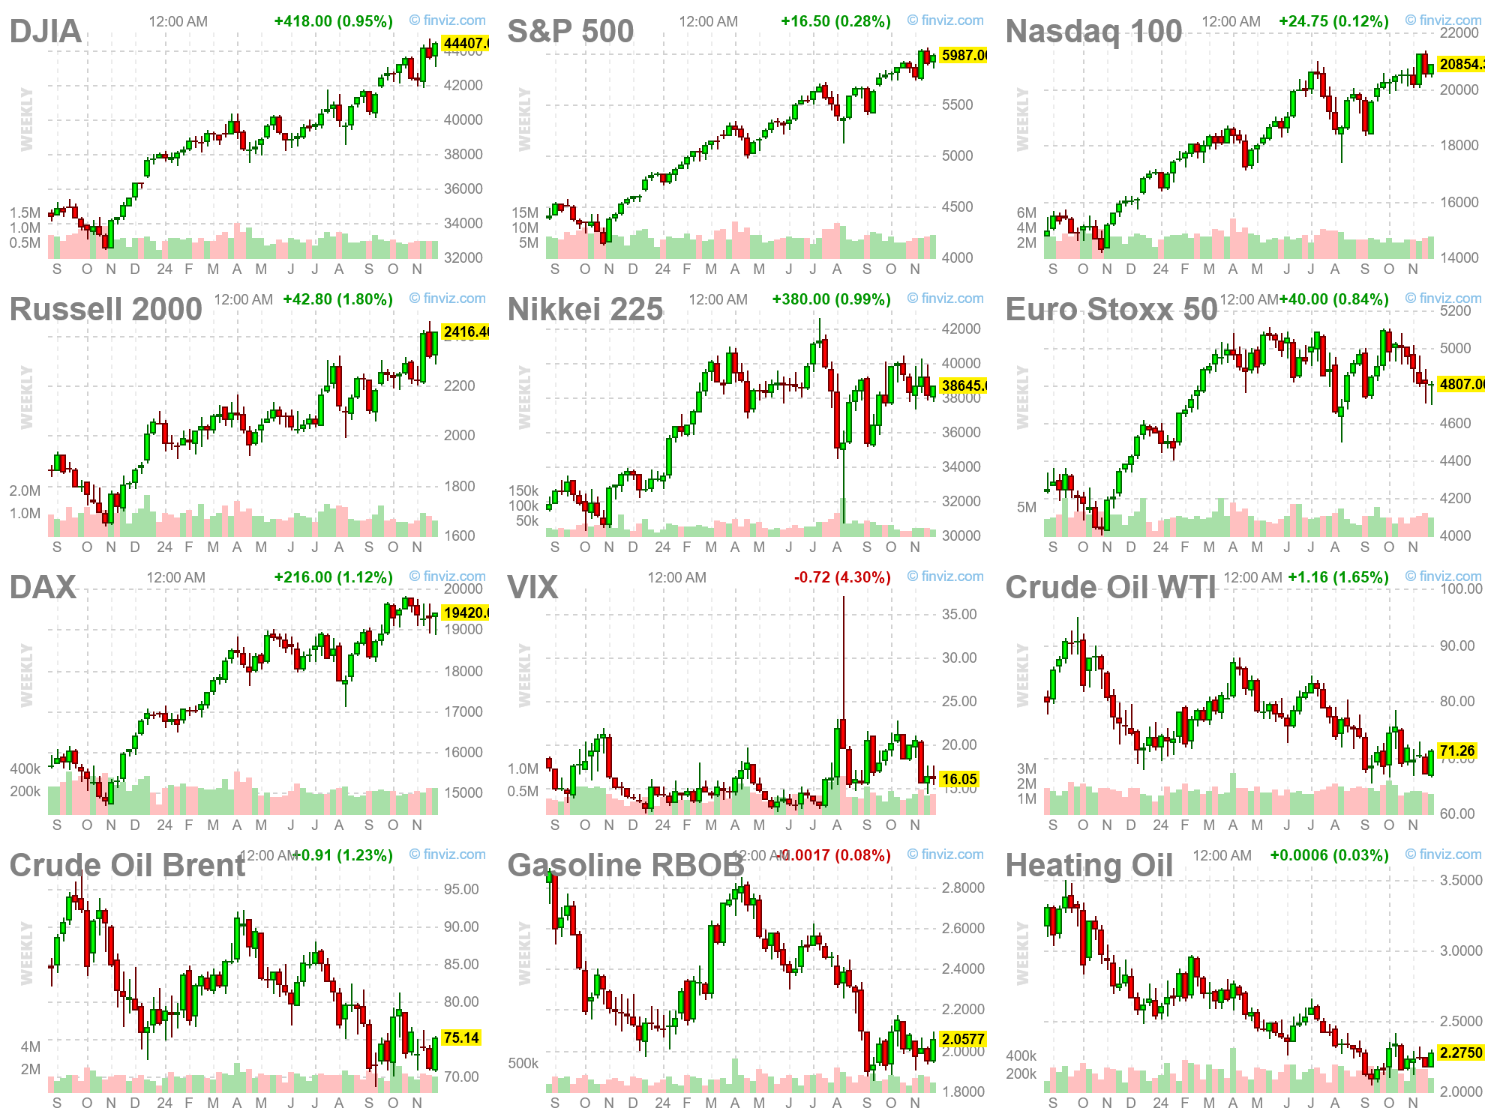
Major U.S. stock indexes rebounded strongly, recovering losses from the prior week. The Dow Jones Industrial Average outpaced the broader market, achieving a new record high, while the S&P 500 finished just shy of its own record. The Nasdaq Composite trailed slightly, reflecting softness in mega-cap technology stocks, particularly after NVIDIA’s earnings report. In contrast, smaller-cap stocks, as represented by the Russell 2000, surged, delivering a 4.5% weekly gain. This rally reflected a rotation into cyclical and value-oriented sectors.
Bitcoin also extended its rally, climbing to new record highs, with a week-over-week gain exceeding 10%. This resurgence underscores investor appetite for speculative assets in an environment of improving sentiment and anticipation of a favorable policy environment under the incoming U.S. administration.
Corporate Earnings and Sector Analysis
Corporate earnings continued to support market performance. With nearly all third-quarter results reported, S&P 500 companies are expected to post an average year-over-year earnings gain of 5.8%, marking the fifth consecutive quarter of growth. Notable outperformers included Gap and Ross Stores, which reported earnings above expectations, buoyed by resilient consumer demand. Conversely, mega-cap tech names like NVIDIA, Alphabet, and Amazon underperformed, reflecting a mix of profit-taking and concerns over high expectations.
NVIDIA’s quarterly results underscored the dichotomy within the tech sector. While the company reported sales nearly doubling from the previous year, its guidance for slower fourth-quarter revenue growth dampened investor enthusiasm. This highlights the challenge of sustaining high growth expectations, even in sectors like AI that remain poised for long-term expansion. The underperformance of semiconductors also mirrored broader concerns over tighter export restrictions to China, a policy focus of the incoming administration.

Meanwhile, cyclical sectors like industrials, energy, and financials outperformed, driven by improving economic indicators and optimism surrounding potential pro-growth policies. Companies such as Caterpillar and Deere benefited from strong buying interest, while energy stocks rebounded amid a 6% rise in crude oil prices.
Valuations and Broader Market Trends
U.S. large-cap valuations remain elevated, with the forward price-to-earnings (P/E) ratio of the S&P 500 approximately 22, well above its historical average. However, this elevated valuation is largely concentrated in mega-cap technology stocks. Equal-weighted indices, along with mid- and small-cap stocks, trade closer to or below their historical averages, offering potential opportunities for investors seeking diversification.

This broadening of market leadership is a healthy development, as it reduces reliance on a narrow set of high-performing stocks. As of last week, 72% of S&P 500 stocks traded above their 200-day moving averages, indicating improving market breadth. Value stocks outpaced growth counterparts, with the Russell 2000 small-cap index delivering notable gains, reflecting investor rotation into less expensive and more domestically focused assets.
Economic Indicators and Policy Outlook
Macroeconomic data provided additional tailwinds for the market. Initial jobless claims declined unexpectedly to 213,000, their lowest level since April, signaling continued labor market strength. Existing home sales also rebounded, rising year-over-year for the first time since mid-2021, supported by stabilizing mortgage rates and steady job growth.
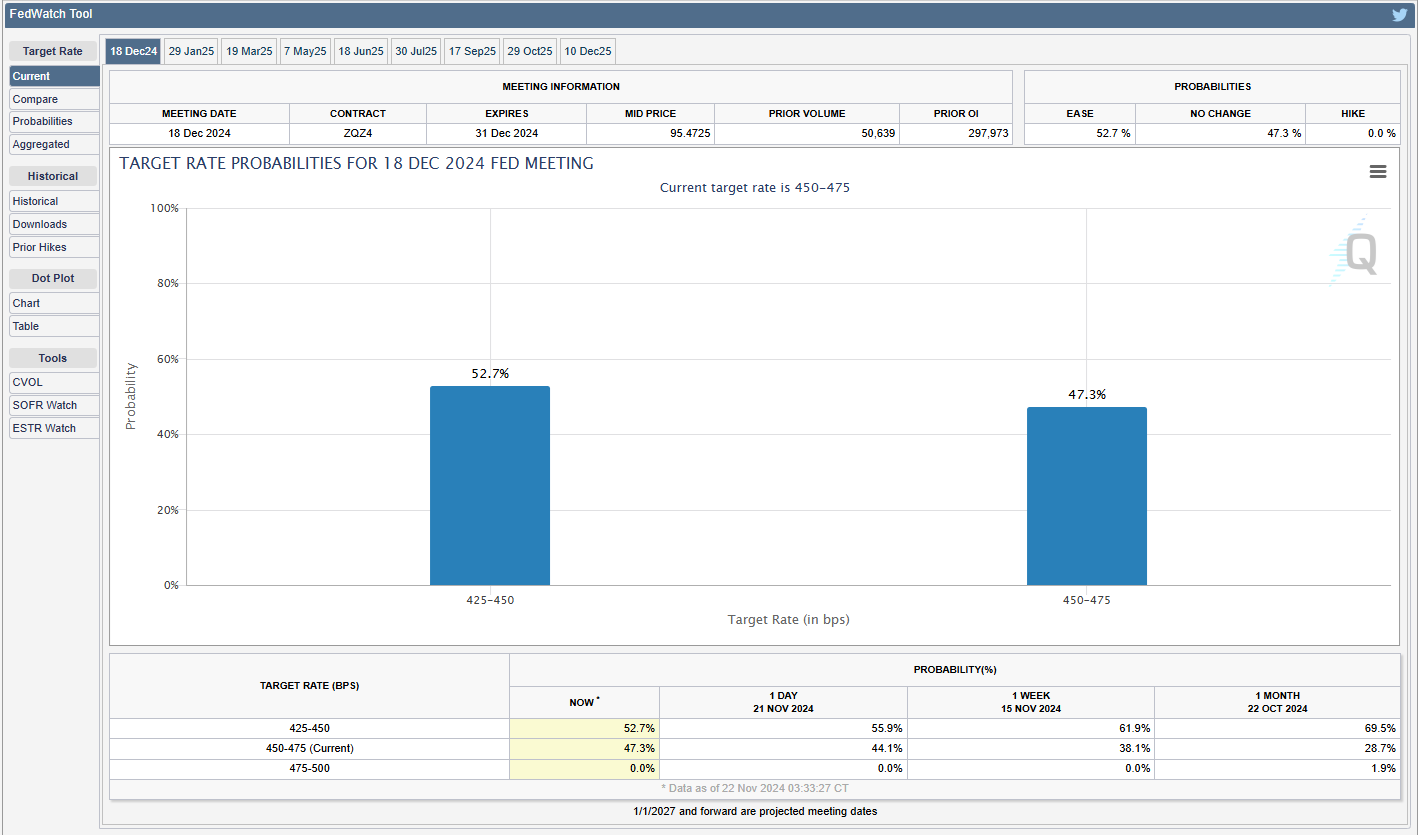
Looking ahead, the Federal Reserve’s policy remains a focal point. While inflation has moderated, the pace of disinflation has slowed, and the labor market remains tight. The market is pricing in a roughly 50% chance of a rate cut at the Fed’s December meeting, with upcoming inflation and jobs data likely to influence the decision. The divergence in Treasury yields, with short-term rates rising and long-term rates declining, reflects a cautious but optimistic outlook.
Tariffs and Inflation Concerns
Policy uncertainty, particularly surrounding tariffs, looms as a potential risk. The incoming administration’s proposal for universal tariffs could introduce inflationary pressures, as higher import costs may act as a de facto tax on consumers. However, the impact may be mitigated by currency adjustments, supply chain shifts, and exporters absorbing some of the additional costs. Historically, tariffs have contributed modestly to inflation and growth dynamics, and their ultimate impact will depend on the broader policy mix.

Investment Implications and Strategies
As valuations remain elevated in parts of the market, diversification becomes increasingly important. Value-style investments, as well as small- and mid-cap stocks, offer relative bargains and are poised to benefit from stronger domestic growth and potential policy shifts, such as lower tax rates. Conversely, mega-cap tech stocks with significant international exposure may face headwinds from geopolitical and trade uncertainties.
Investors are encouraged to maintain a balanced approach, with allocations across asset classes and sectors to navigate potential volatility. Given the supportive backdrop of resilient economic growth, rising corporate profits, and the prospect of rate cuts, equities appear well-positioned to build on their strength as leadership continues to broaden.

Conclusion
The U.S. equity markets demonstrated resilience and adaptability last week, supported by robust earnings, improving economic data, and a rotation into undervalued sectors. While risks such as elevated valuations, policy uncertainty, and geopolitical tensions persist, the broader market dynamics point to sustained strength heading into 2025. Investors who focus on diversification and align their portfolios with evolving market conditions are likely to benefit from the opportunities ahead. As the year progresses, monitoring key economic indicators and policy developments will remain critical in navigating an increasingly complex investment landscape.
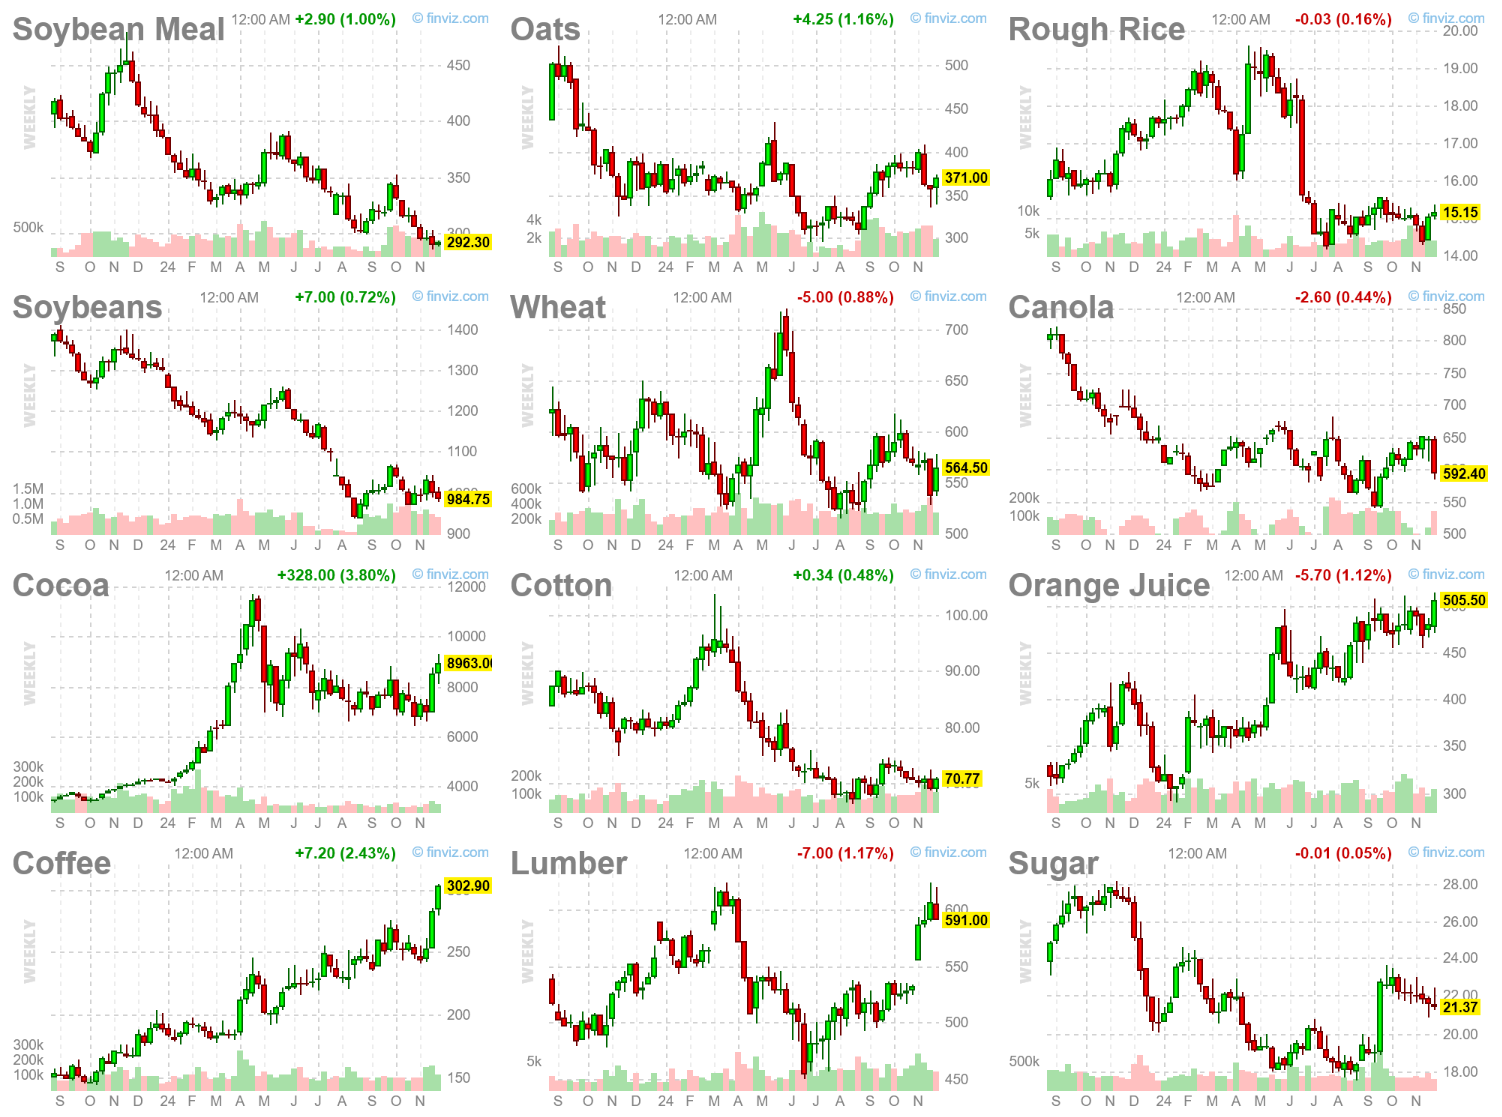
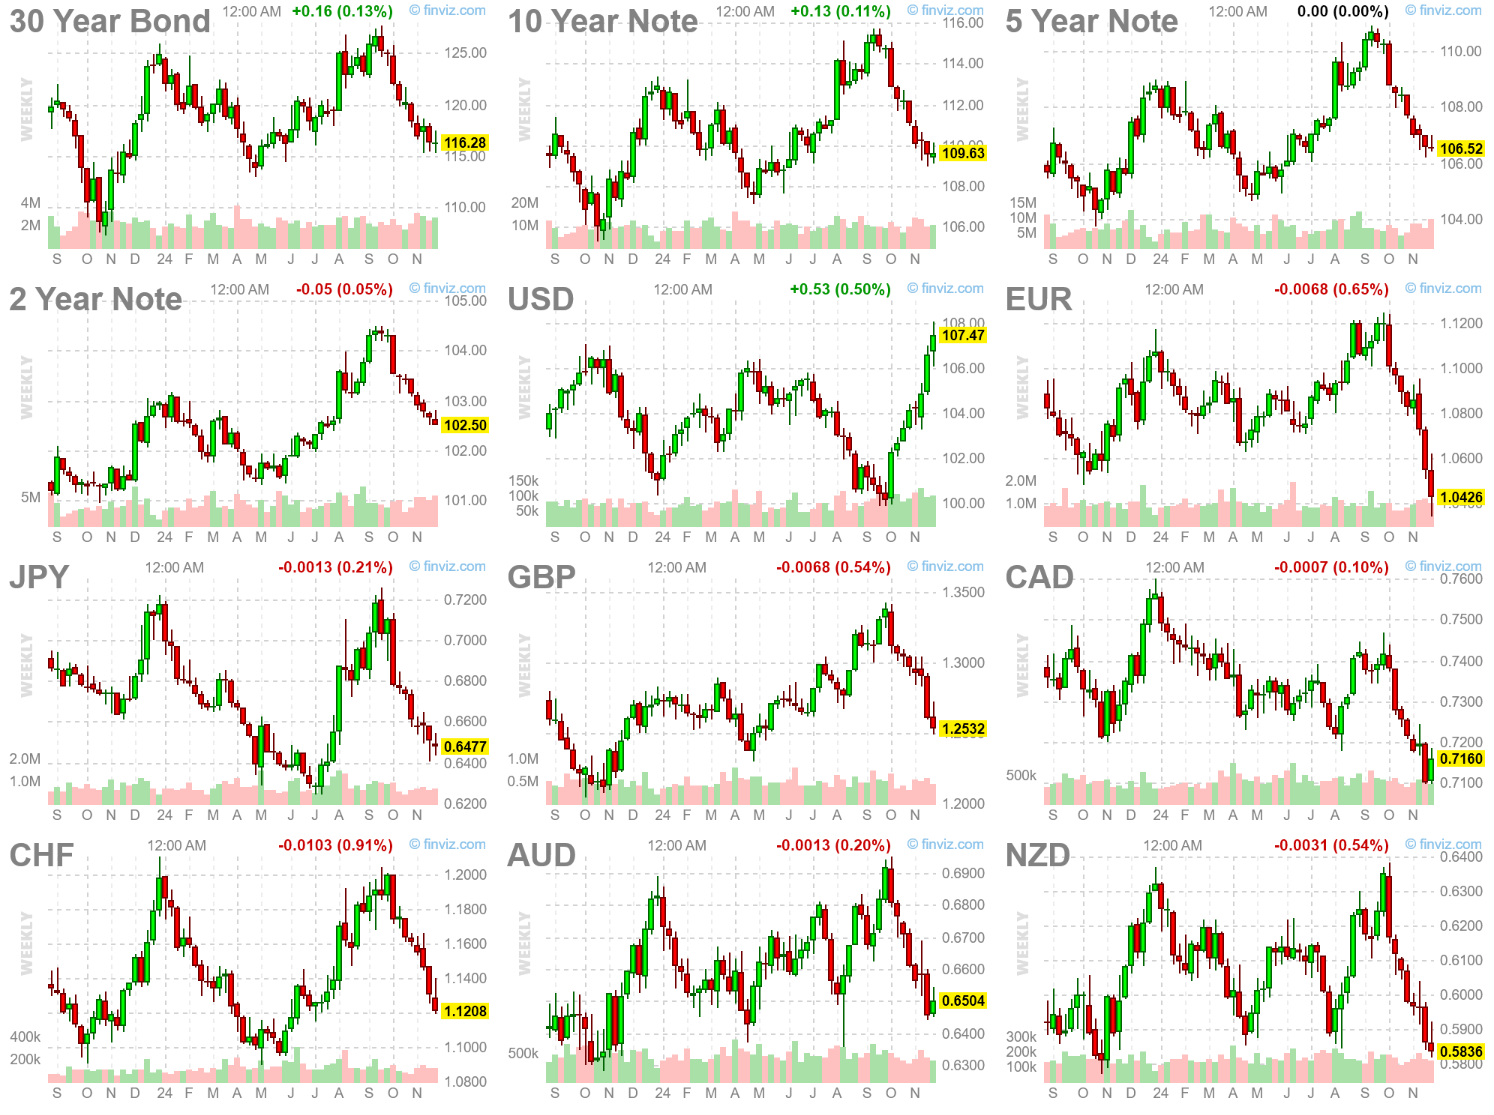
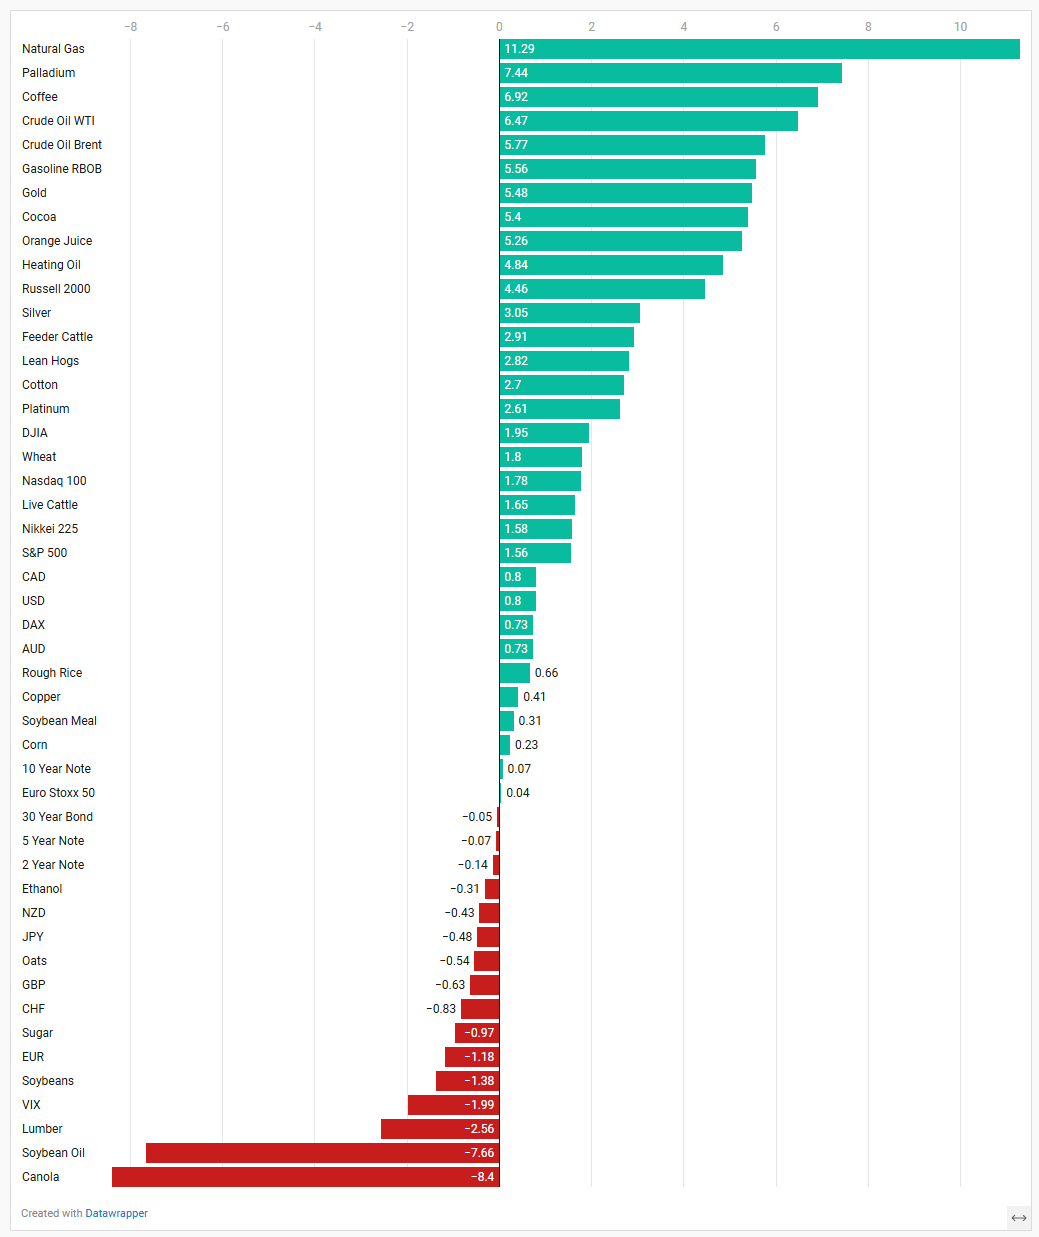
Futures Markets Snapshots
S&P 500: Sector Insights
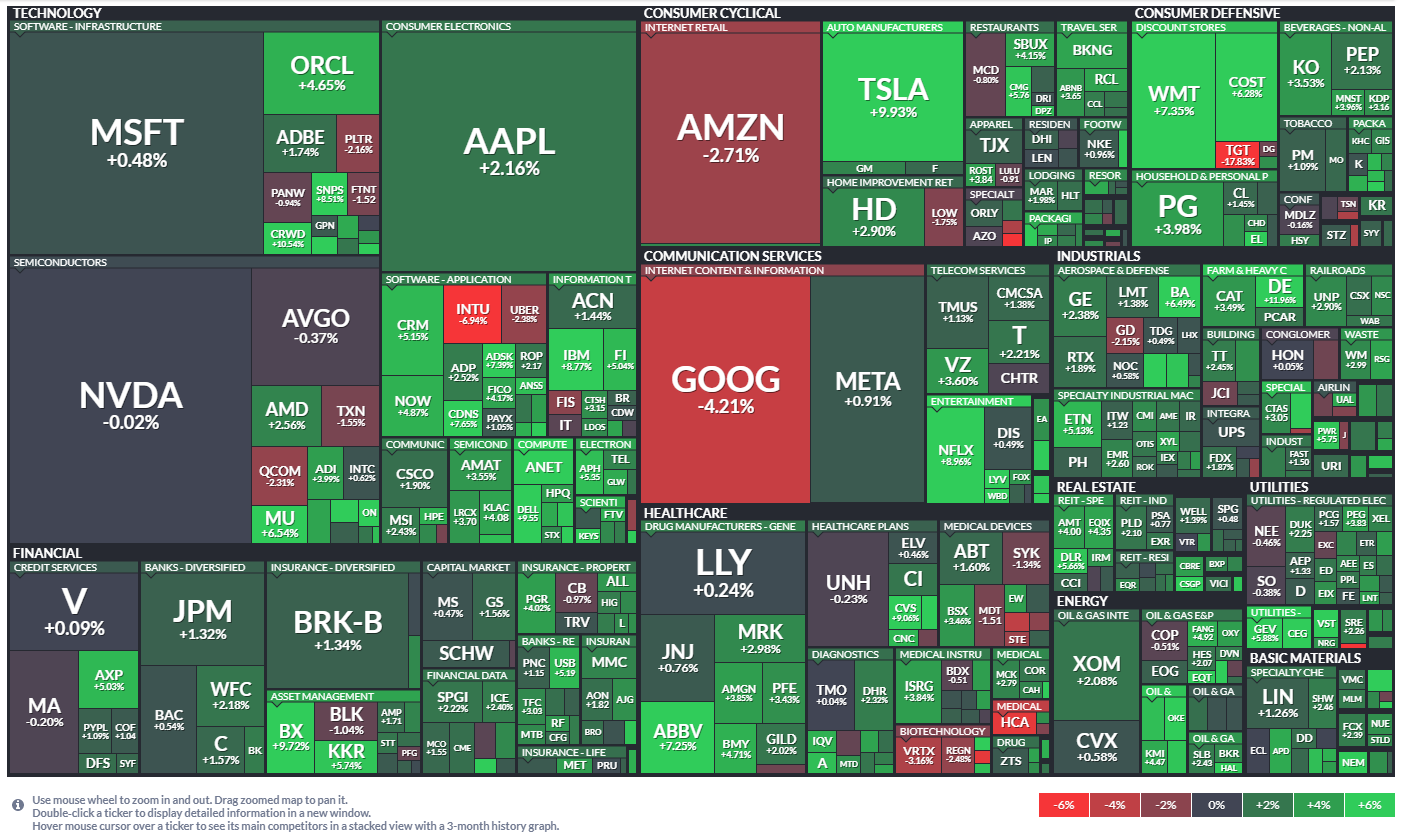
1. Sectoral Performance
Technology:
Mixed performance. Key players like Microsoft (MSFT) showed modest gains (+0.48%), while NVIDIA (NVDA) was flat (-0.02%).
Notable decliners included Adobe (ADBE) and Palantir (PLTR).
Semiconductors had mixed results: AMD (+2.56%) outperformed, while AVGO (-0.37%) and TXN (-1.55%) lagged.
Consumer Cyclical:
Strong gains for Tesla (TSLA, +9.93%), supported by the auto manufacturer’s outperformance.
Amazon (AMZN, -2.71%) declined sharply, weighing on the internet retail subsector.
Consumer Defensive:
Solid performance with companies like Walmart (WMT, +7.35%) and Coca-Cola (KO, +3.53%) showing strength.
Target (TGT) suffered a significant loss (-17.83%), highlighting potential challenges in the retail space.
Communication Services:
Mixed outcomes, with Alphabet (GOOG, -4.21%) declining sharply, while Meta (META, +0.91%) remained flat.
Netflix (NFLX, +8.96%) stood out with substantial gains.
Healthcare:
Generally positive, with AbbVie (ABBV, +7.25%) and Merck (MRK, +2.98%) leading the gains.
Biotechnology underperformed, as seen with Vertex Pharmaceuticals (VRTX, -3.16%).
Industrials:
Consistently strong across defense and aerospace subsectors, with Lockheed Martin (LMT, +3.88%) and General Electric (GE, +2.38%) among the winners.
Transportation companies like UPS also showed gains.
Energy:
Strength across the sector, with ExxonMobil (XOM, +2.08%) and Chevron (CVX, +0.58%) leading.
Financials:
Broadly positive, with JPMorgan (JPM, +1.32%) and Bank of America (BAC, +0.54%) showing strength.
Asset managers like Blackstone (BX, +9.72%) stood out.
Utilities:
Weak performance overall, with many utilities in the red, reflecting possible sectoral rotation out of defensive plays.
2. Overall Market Sentiment
The market shows a risk-on sentiment, with growth sectors like consumer cyclical, energy, and parts of technology leading gains.
Defensive sectors like utilities and healthcare exhibited weaker performance, suggesting investors are prioritizing sectors sensitive to economic growth and earnings.
3. Key Outliers
Winners:
Tesla (+9.93%), Netflix (+8.96%), AbbVie (+7.25%), and Walmart (+7.35%) highlight areas of investor confidence.
Semiconductors like Micron (MU, +6.54%) also showed notable strength.
Losers:
Target (-17.83%) stands out as a major laggard, suggesting challenges in retail operations.
Alphabet (-4.21%) underperformed, reflecting possible concerns about ad revenues or regulatory challenges.
Biotech weakness, particularly Vertex (-3.16%), signals caution in specific healthcare niches.
4. Sector Leadership
Leadership remains in consumer cyclical, energy, and parts of technology like semiconductors.
Defensive plays, including utilities, were among the weaker performers, likely reflecting shifts in investor sentiment toward riskier assets.
5. Broad Economic Implications
The outperformance of cyclical and growth sectors may signal optimism about economic resilience or expectations of favorable macroeconomic conditions, such as potential Federal Reserve easing.
Declines in utilities and mixed performance in healthcare and consumer defensive suggest rotation away from traditionally safer sectors.
This week’s performance indicates investor optimism with a clear preference for growth-oriented and economically sensitive sectors. However, caution remains in specific areas like retail and biotechnology.
ETF Insights
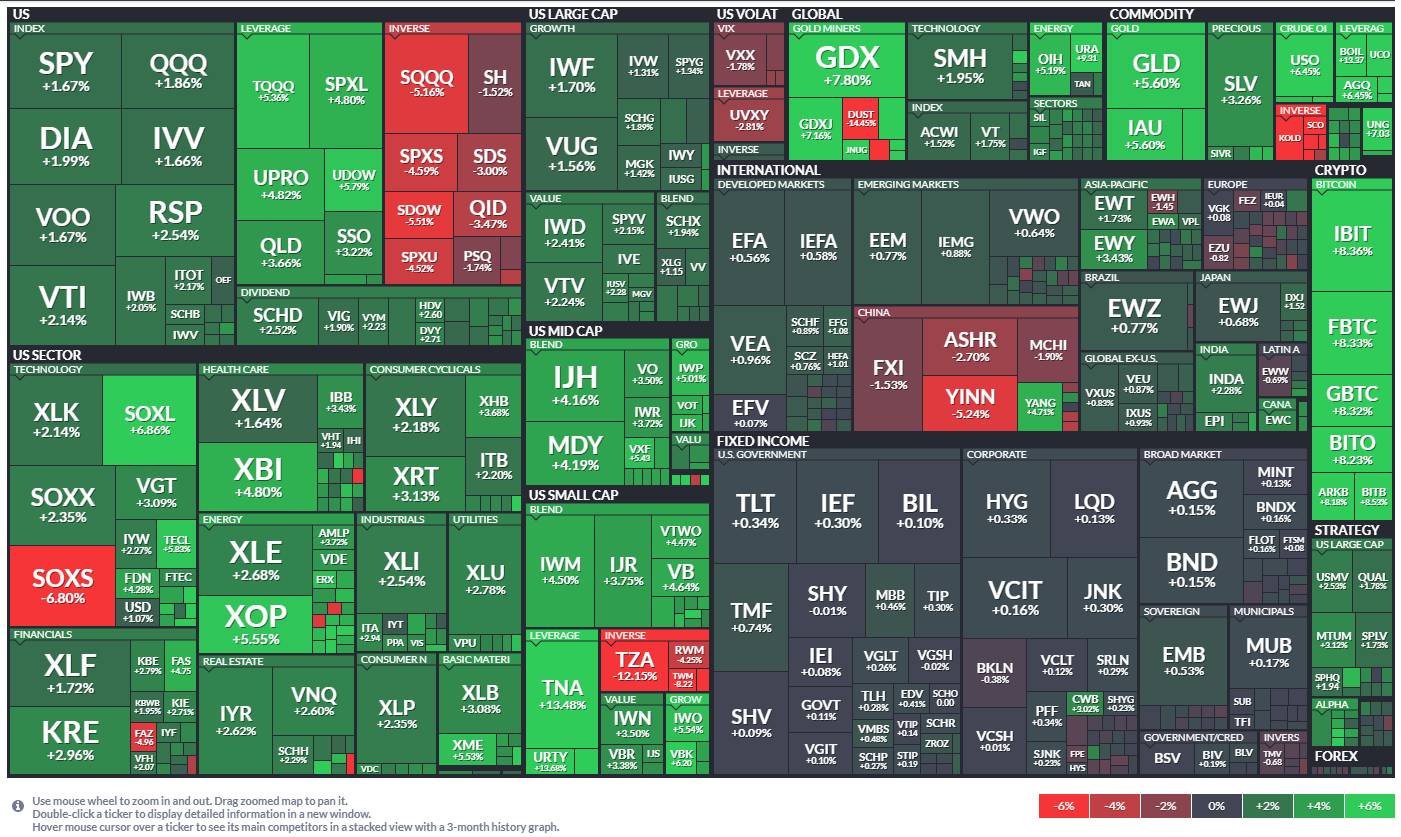
Broad Observations
Equity Index ETFs:
Major US indices showed strong gains:
SPY (S&P 500): +1.67%
QQQ (Nasdaq-100): +1.86%
DIA (Dow Jones): +1.99%
IVV (S&P 500 Core): +1.66%
VTI (Total US Stock Market): +2.14%
Small-cap and mid-cap indices performed exceptionally well:
IWM (Russell 2000): +4.5%
MDY (MidCap SPDR): +4.19%
Sector-Specific ETFs:
Technology:
Strong performance with SOXX (Semiconductors): +2.35% and VGT (Technology Select): +3.09%.
Energy:
Top-performing sector, with XOP (Oil & Gas Exploration): +5.55% and XLE (Energy Select): +2.68%.
Healthcare:
Modest gains for XLV (Health Care Select): +1.64%.
Financials:
Solid growth for XLF (Financials Select): +1.72% and KRE (Regional Banks): +2.96%.
Consumer Cyclicals:
Notable gains for XLY (Consumer Discretionary): +2.18%.
Utilities:
Positive week, with XLU (Utilities Select): +2.78%.
Global & International ETFs:
Emerging Markets (EEM): +0.77%.
Mixed performance across regions:
EFA (Developed Markets): +0.58%.
EWZ (Brazil): +0.77%.
Underperformance in China with ASHR (China A-Shares): -2.7%.
Commodities ETFs:
Gold (GLD): +5.6%.
Silver (SLV): +3.26%.
GDX (Gold Miners): +7.8% was a standout performer.
Leveraged ETFs:
Strong returns in leveraged ETFs tracking gains in equity markets:
TQQQ (Triple-Leveraged Nasdaq): +5.36%.
SPXL (Triple-Leveraged S&P 500): +4.8%.
Inverse leveraged ETFs underperformed:
SQQQ (Inverse Nasdaq): -5.16%.
SDOW (Inverse Dow): -5.51%.
Fixed Income ETFs:
Modest returns across fixed-income ETFs:
TLT (20+ Year Treasury): +0.34%.
BND (Aggregate Bond Index): +0.15%.
LQD (Investment Grade Corporate Bonds): +0.13%.
Crypto ETFs:
Significant gains in cryptocurrency ETFs:
BITO (Bitcoin Strategy): +8.23%.
GBTC (Grayscale Bitcoin Trust): +8.32%.
Key Takeaways
Equity markets were strong across all caps, with small and mid-caps outperforming large caps.
Technology and Energy were the dominant sectors, showcasing robust gains in ETFs.
Emerging Markets showed moderate growth, but China-focused ETFs lagged significantly.
Gold-related ETFs surged as a safe-haven asset, outperforming broader commodities.
Cryptocurrency ETFs had a standout week, reflecting bullish sentiment in digital assets.
The ETF landscape for the week suggests a risk-on environment, favoring growth sectors, small-cap equities, and speculative assets like cryptocurrencies. Defensive sectors and fixed income saw only modest gains.

Special Coverage: What’s driving gold higher? Where is it heading? Is there a bear case?
Gold, a timeless store of value and a symbol of wealth, continues to capture the attention of investors globally. Recent fluctuations in its price have raised questions about the forces driving its value, the outlook for the metal, and potential risks that could hinder its ascent.
Drivers of Gold Prices
1. Geopolitical Tensions
Gold thrives during uncertainty, often becoming the safe-haven asset of choice in times of geopolitical strife. The ongoing conflict between Russia and Ukraine has exacerbated global anxieties, pushing investors toward gold to safeguard their wealth. For example, Russia's recent escalation of attacks on Ukraine, including the use of hypersonic missiles, has reignited concerns over prolonged instability. This conflict underscores gold's role as a hedge against crises and its ability to retain value in volatile times.
2. Economic Uncertainty and Inflation
Persistent inflation and fears of a potential economic downturn have bolstered gold's appeal. As inflation erodes the purchasing power of fiat currencies, investors increasingly turn to gold to preserve wealth. Furthermore, the specter of economic instability—manifested in weak GDP growth and declining consumer confidence—has driven demand for the precious metal.
3. Central Bank Purchases
Emerging market central banks have accelerated their gold purchases, diversifying reserves to mitigate reliance on the U.S. dollar and safeguard against potential sanctions. Nations such as China and Russia have been at the forefront of this trend, reinforcing gold's importance in global monetary policy and pushing demand higher.
4. Interest Rate Expectations
Interest rates play a pivotal role in shaping gold prices. As the Federal Reserve signals potential rate cuts, the opportunity cost of holding gold diminishes, making it more attractive. Market anticipations of an easing monetary policy have fueled recent price gains, with investors flocking to the metal amid expectations of a dovish Fed stance.
5. Stock Market Volatility
Stock market turbulence often sends investors seeking refuge in gold. The unpredictability of equity markets, fueled by concerns over inflation, geopolitical instability, and economic stagnation, has reinforced gold's status as a crisis hedge. For instance, significant market corrections in recent months have coincided with gold's price surge, highlighting its role as a stabilizing asset.
Projections for Gold Prices: End-of-Year Outlook
Gold's price trajectory has sparked debate among analysts, with many projecting bullish outcomes driven by macroeconomic factors. Below are key forecasts from industry experts:
1. Goldman Sachs
Goldman Sachs projects gold prices to reach $2,700 per ounce by early 2025. This optimism is rooted in anticipated Federal Reserve rate cuts and increased central bank purchases. The firm sees gold benefiting from a weaker U.S. dollar and heightened demand from emerging markets.
2. J.P. Morgan
J.P. Morgan expects gold to climb to $2,500 per ounce by the end of 2024, contingent on the Federal Reserve commencing a rate-cutting cycle. The forecast emphasizes the interplay between monetary policy and gold's attractiveness as a hedge against inflation and economic uncertainty.
3. Société Générale (SocGen)
SocGen has revised its Q4 2024 gold price projection upward, forecasting an average price of $2,700 per ounce. The bank cites sustained central bank purchases and heightened geopolitical risks as critical drivers.
4. ANZ Research
ANZ Research anticipates fresh record highs for gold, potentially surpassing $2,900 in the near term. Central bank diversification and global economic instability are seen as primary factors underpinning this outlook.
5. Citigroup
Citi projects that gold could reach $3,000 per ounce within the next 6 to 18 months. The bank attributes this bullish stance to persistent geopolitical tensions and ongoing concerns over inflation and monetary policy.
These projections highlight the widespread optimism surrounding gold, underscoring its resilience amid challenging market conditions.
Bear Cases for Gold Prices
Despite gold's impressive performance and bullish outlook, several factors could undermine its upward trajectory:
1. Strengthening U.S. Dollar
A strong U.S. dollar often acts as a headwind for gold prices, making the metal more expensive for international buyers. Recent trends in currency markets have shown instances of dollar appreciation, which could suppress global demand for gold and cap its price gains.
2. Rising Interest Rates
Higher interest rates increase the opportunity cost of holding gold, as investors may favor yield-bearing assets like bonds. If inflation cools and central banks adopt a more hawkish stance, gold could face downward pressure. For instance, a surprise uptick in U.S. Treasury yields in early 2024 temporarily weighed on gold prices.
3. Reduced Geopolitical Tensions
Gold's safe-haven appeal could diminish if geopolitical risks abate. A resolution to major conflicts or diplomatic breakthroughs in global hotspots could shift investor focus away from gold toward riskier assets such as equities and corporate bonds.
4. Improving Economic Conditions
A stabilizing global economy may encourage a shift in investor sentiment, reducing demand for gold. Robust GDP growth, falling unemployment rates, and improving corporate earnings could spark renewed interest in growth-oriented investments, sidelining gold as a wealth-preservation tool.
5. Technological Disruptions and Digital Currencies
The rise of digital currencies and technological advancements could challenge gold's traditional role as a store of value. Cryptocurrencies like Bitcoin have increasingly been viewed as alternatives to gold, particularly among younger investors. While gold remains dominant, its appeal could face long-term erosion as digital assets gain traction.

US Investor Sentiment
Insider Trading
Insider trading occurs when a company’s leaders or major shareholders trade stock based on non-public information. Tracking these trades can reveal insider expectations about the company’s future. For example, large purchases before an earnings report or drug trial results might indicate confidence in upcoming good news.
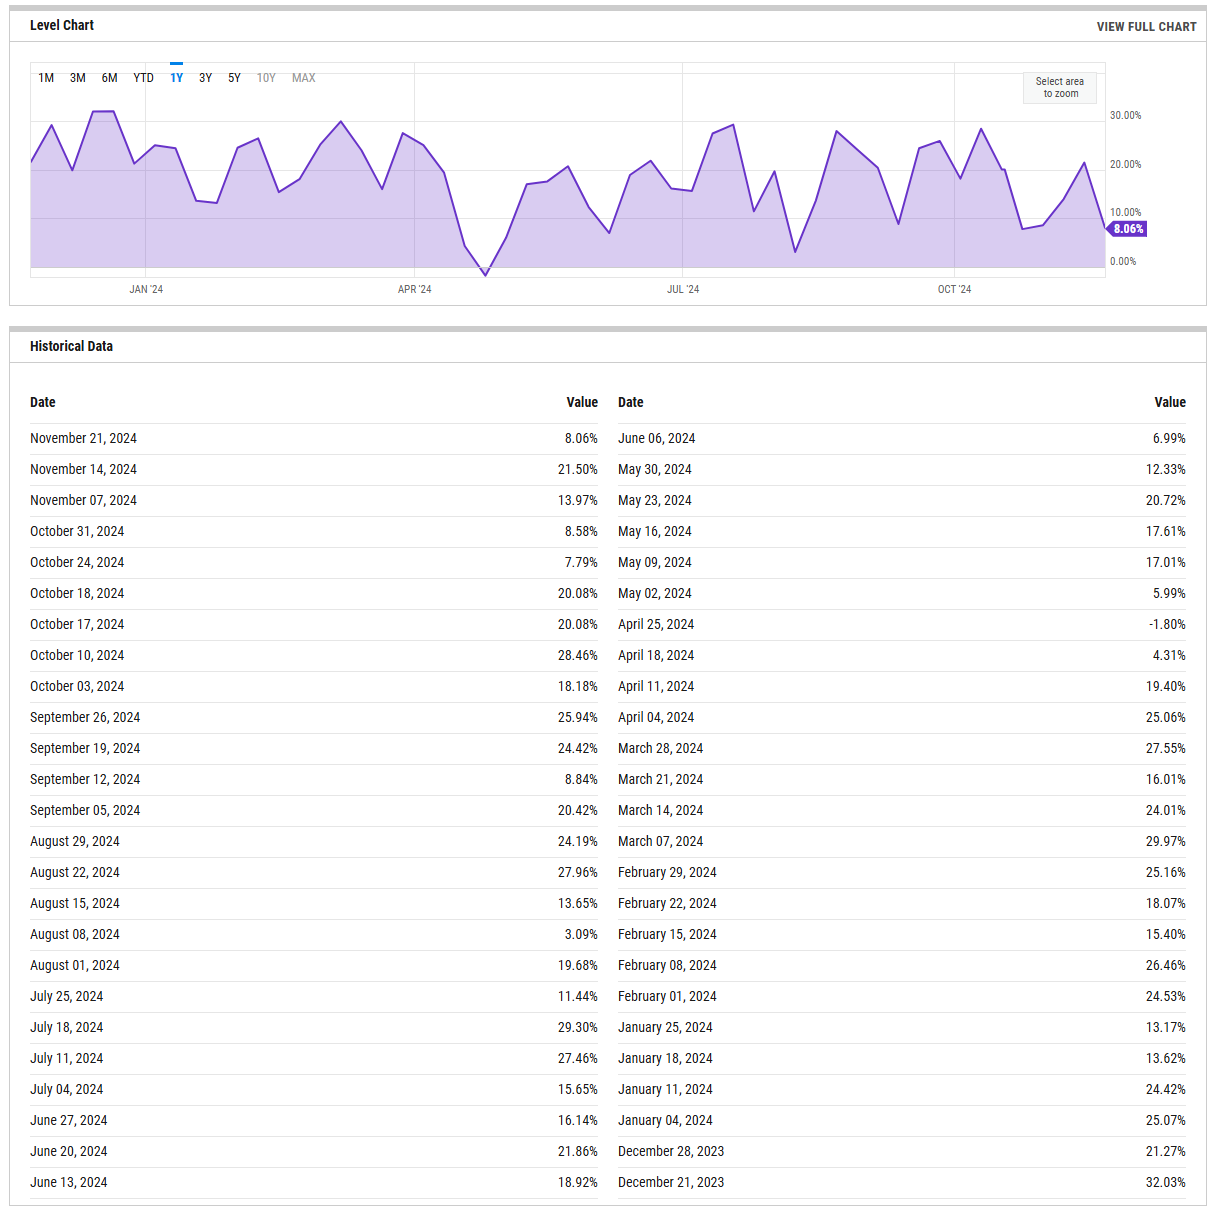
%Bull-Bear Spread
The %Bull-Bear Spread chart is a sentiment indicator that shows the difference between the percentage of bullish and bearish investors, often derived from surveys or sentiment data, such as the AAII (American Association of Individual Investors) sentiment survey. This spread tells investors about the prevailing mood in the market and can provide insights into market extremes and potential turning points.
Bullish or Bearish Sentiment:
When the spread is positive, it means more investors are bullish than bearish, indicating optimism about the market’s direction.
A negative spread indicates more bearish sentiment, meaning more investors expect the market to decline.
Contrarian Indicator:
The %Bull-Bear Spread is often used as a contrarian indicator. For example, extremely high levels of bullish sentiment might suggest that the market is overly optimistic and could be due for a correction.
Similarly, when bearish sentiment is extremely high, it might indicate that the market is overly pessimistic, and a rally could be on the horizon.
Market Extremes and Reversals:
Historically, extreme values of the spread (both positive and negative) can signal turning points in the market. A very high positive spread can signal market exuberance, while a very low or negative spread may indicate fear or capitulation.
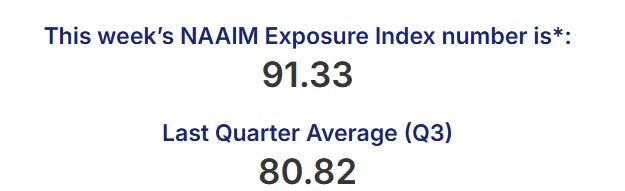
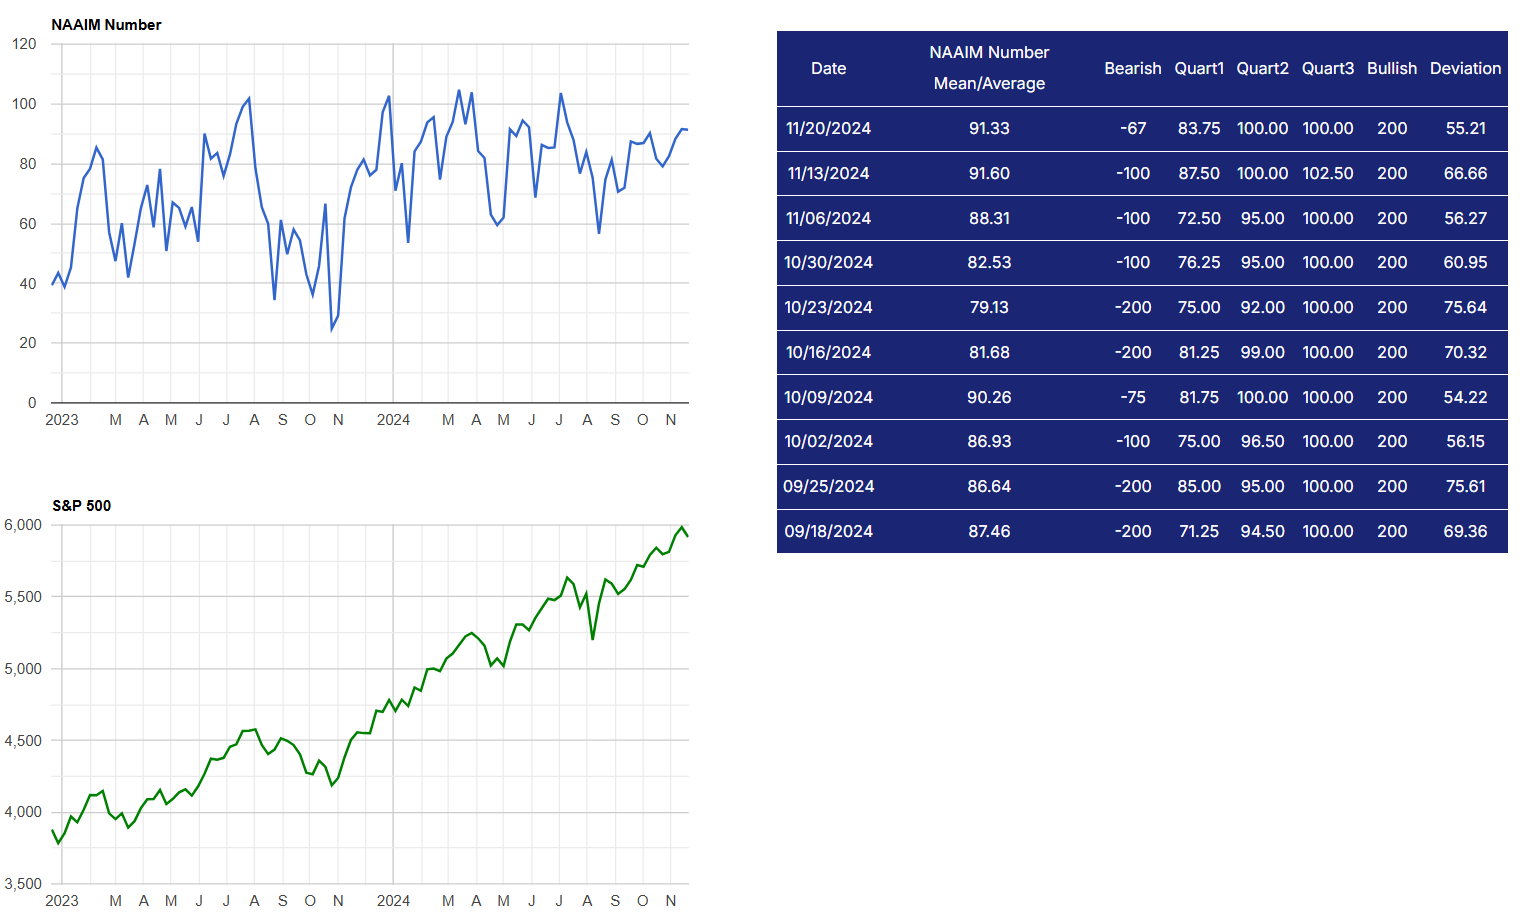
NAAIM Exposure Index
The NAAIM Exposure Index (National Association of Active Investment Managers Exposure Index) measures the average exposure to U.S. equity markets as reported by its member firms. These are typically active money managers who provide their equity exposure levels weekly. The index offers insight into how much these managers are investing in equities at any given time, ranging from being fully short (-100%) to leveraged long (up to +200%).
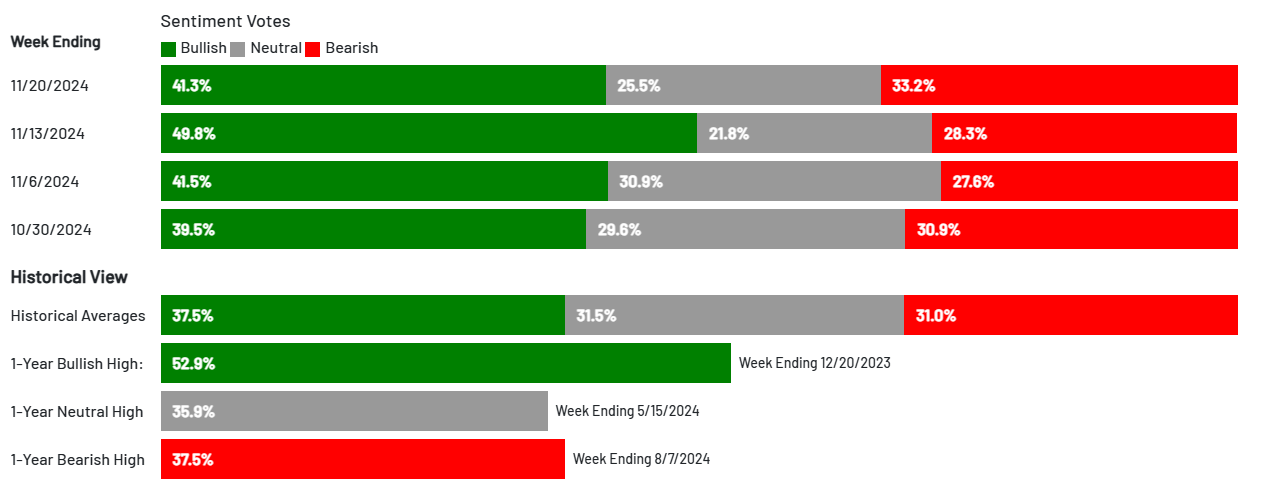
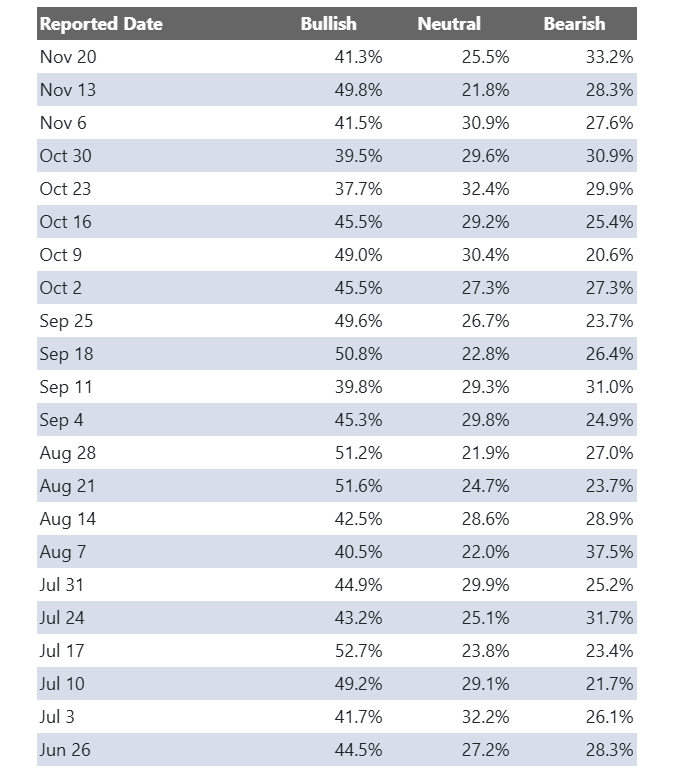
AAII Investor Sentiment Survey
The AAII Investor Sentiment Survey is a weekly survey conducted by the American Association of Individual Investors (AAII) to gauge the mood of individual investors regarding the direction of the stock market over the next six months. It provides insights into whether investors are feeling bullish (expecting the market to rise), bearish (expecting the market to fall), or neutral (expecting the market to stay about the same).
Key Points:
Bullish Sentiment: Reflects the percentage of investors who believe the stock market will rise in the next six months.
Bearish Sentiment: Represents those who expect a decline.
Neutral Sentiment: Reflects investors who anticipate little to no market movement.
The survey is widely followed as a contrarian indicator, meaning that extreme levels of bullishness or bearishness can sometimes signal market turning points. For example, when a large number of investors are overly optimistic (high bullish sentiment), it could suggest a market top, while excessive pessimism (high bearish sentiment) may indicate a market bottom is near.
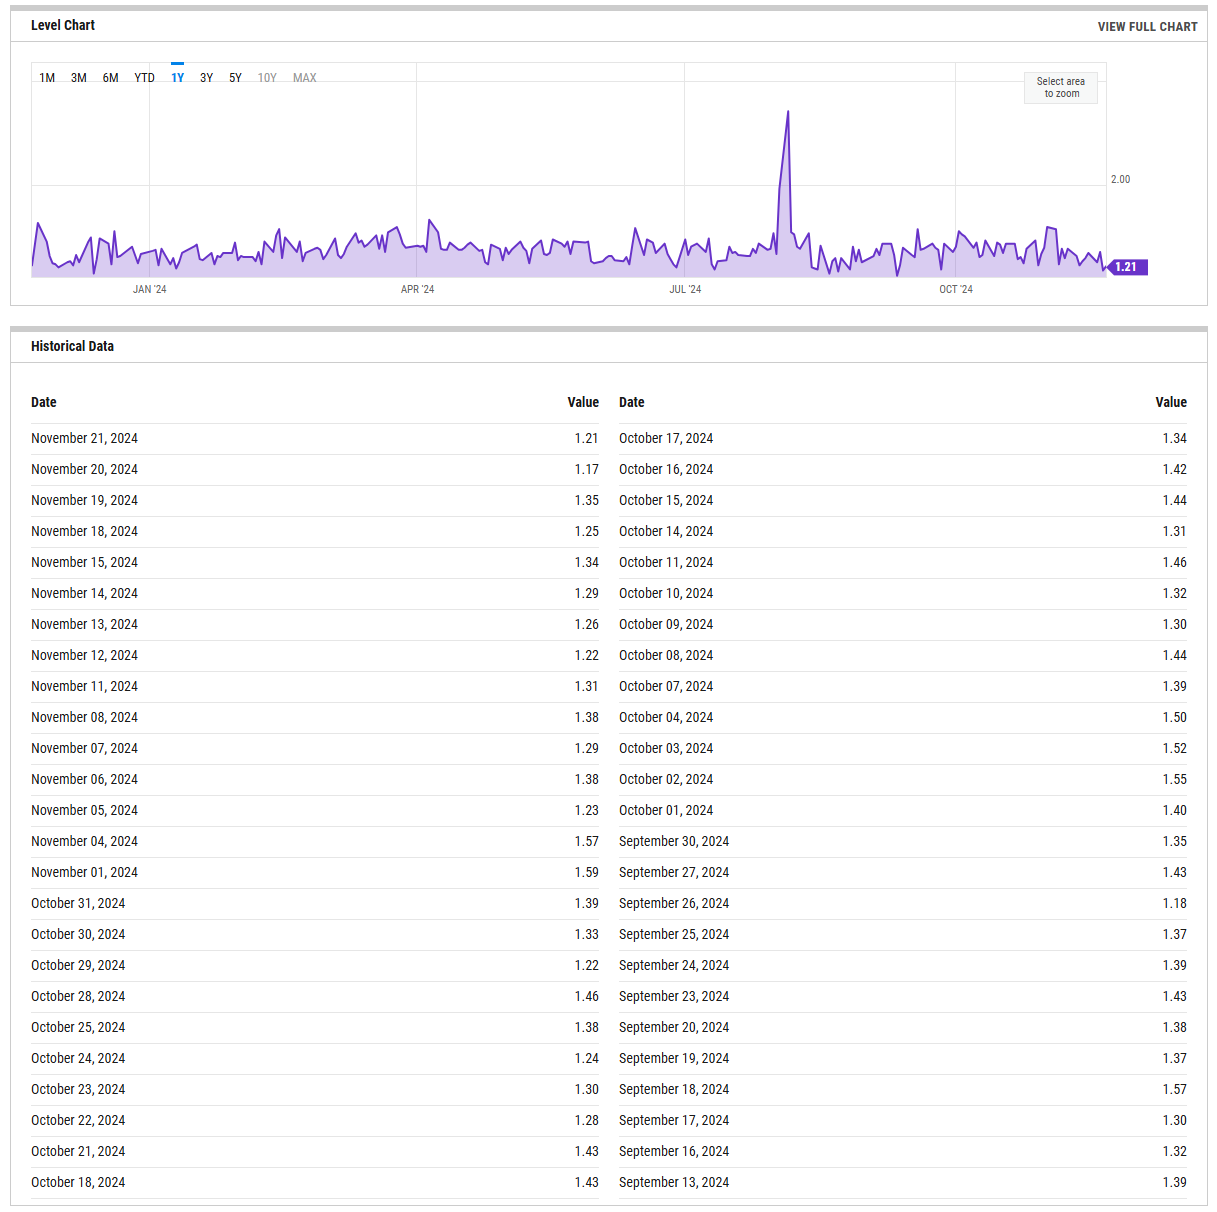
SPX Put/Call Ratio
The SPX Put/Call Ratio is an indicator that is used to gauge market sentiment. This is calculated as the ratio between trading S&P 500 put options and S&P call options. A high put/call ratio can indicate fear in the markets, while a low ratio indicates confidence. For example, in 2015, the Put-Call ratio was as high as 3.77 because of market fears stemming from various global economic issues like a GDP growth slowdown in China and a Greek debt default.
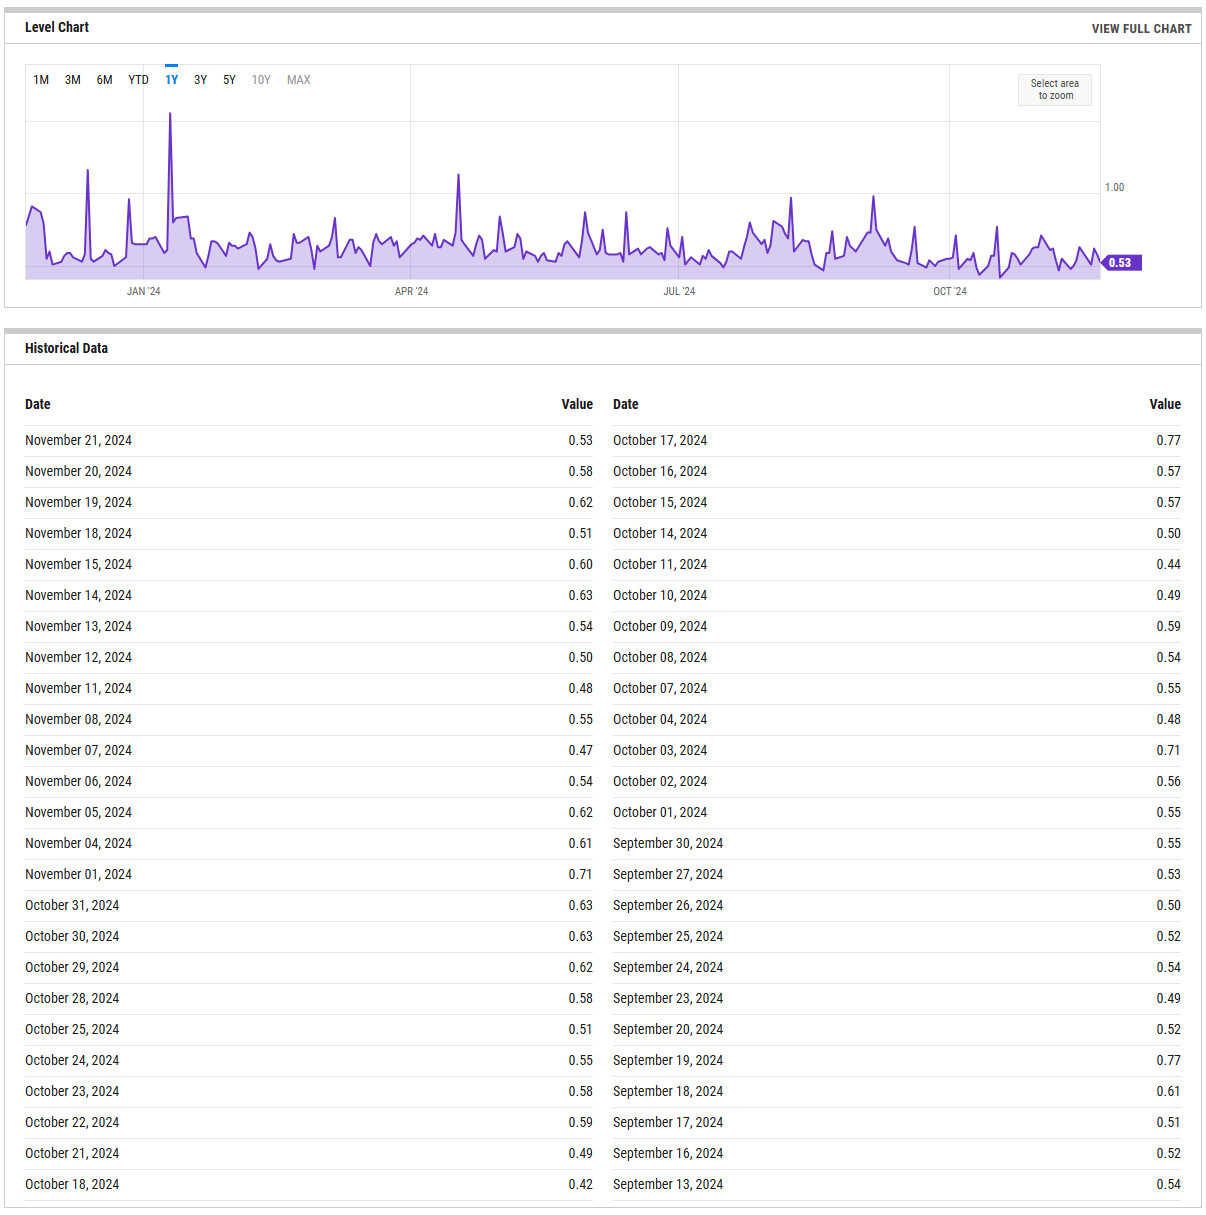
CBOE Equity Put/Call Ratio
The CBOE (Chicago Board Options Exchange) equity put/call ratio is a sentiment indicator used by traders and analysts to gauge market sentiment and potential shifts in investor behavior. It is calculated by dividing the volume of put options by the volume of call options on equities. Here’s what it reveals and how it is generally interpreted:
High Put/Call Ratio: When the put/call ratio is high (above 1.0), it suggests that there is more demand for put options than call options. This typically reflects a more bearish sentiment, as investors may be hedging against potential declines or expecting the market to fall.
Low Put/Call Ratio: Conversely, a low put/call ratio (below 0.7) indicates a higher volume of call options compared to puts, reflecting bullish sentiment. Investors may be expecting upward momentum and are positioning themselves to profit from price gains
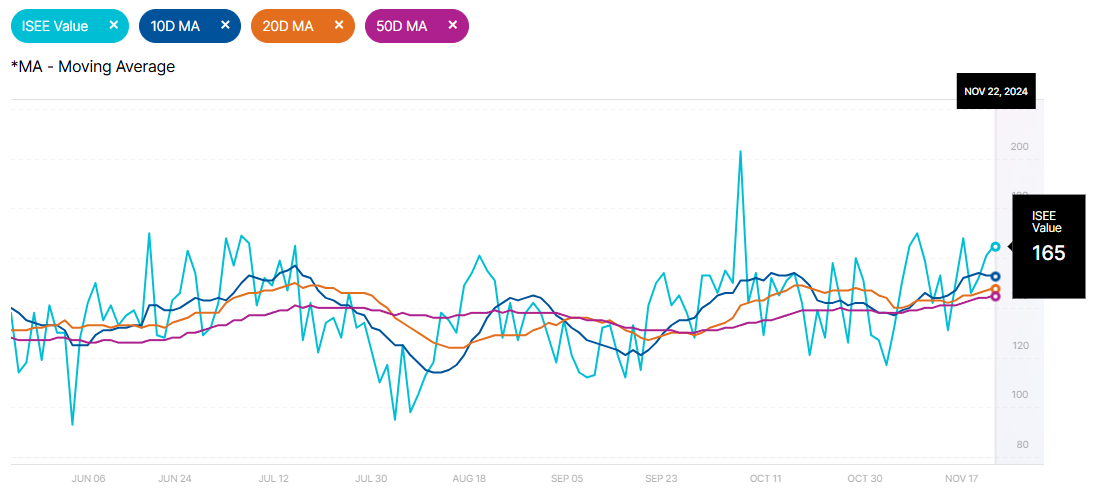
ISEE Sentiment Index
The ISEE (International Securities Exchange Sentiment) Index is a measure of investor sentiment derived from options trading. Unlike traditional put/call ratios, the ISEE Index focuses only on opening long customer transactions and is adjusted to remove market-maker and firm trades, providing a purer sentiment reading.
The ISEE Index typically ranges from 0 to 200, with readings above 100 indicating more call options being bought relative to put options, suggesting bullish sentiment. Conversely, readings below 100 suggest bearish sentiment, with more puts being purchased relative to calls.
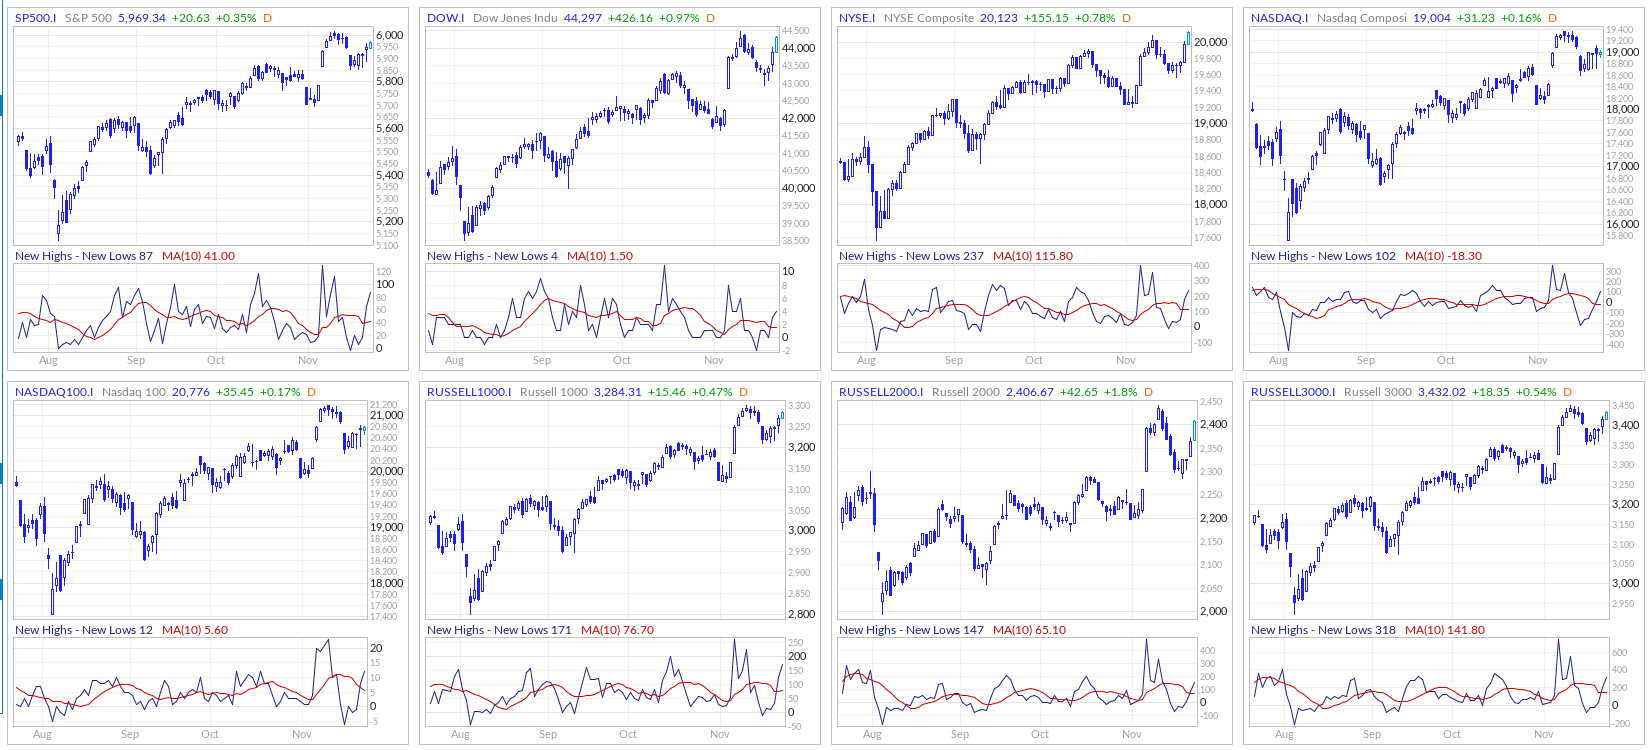
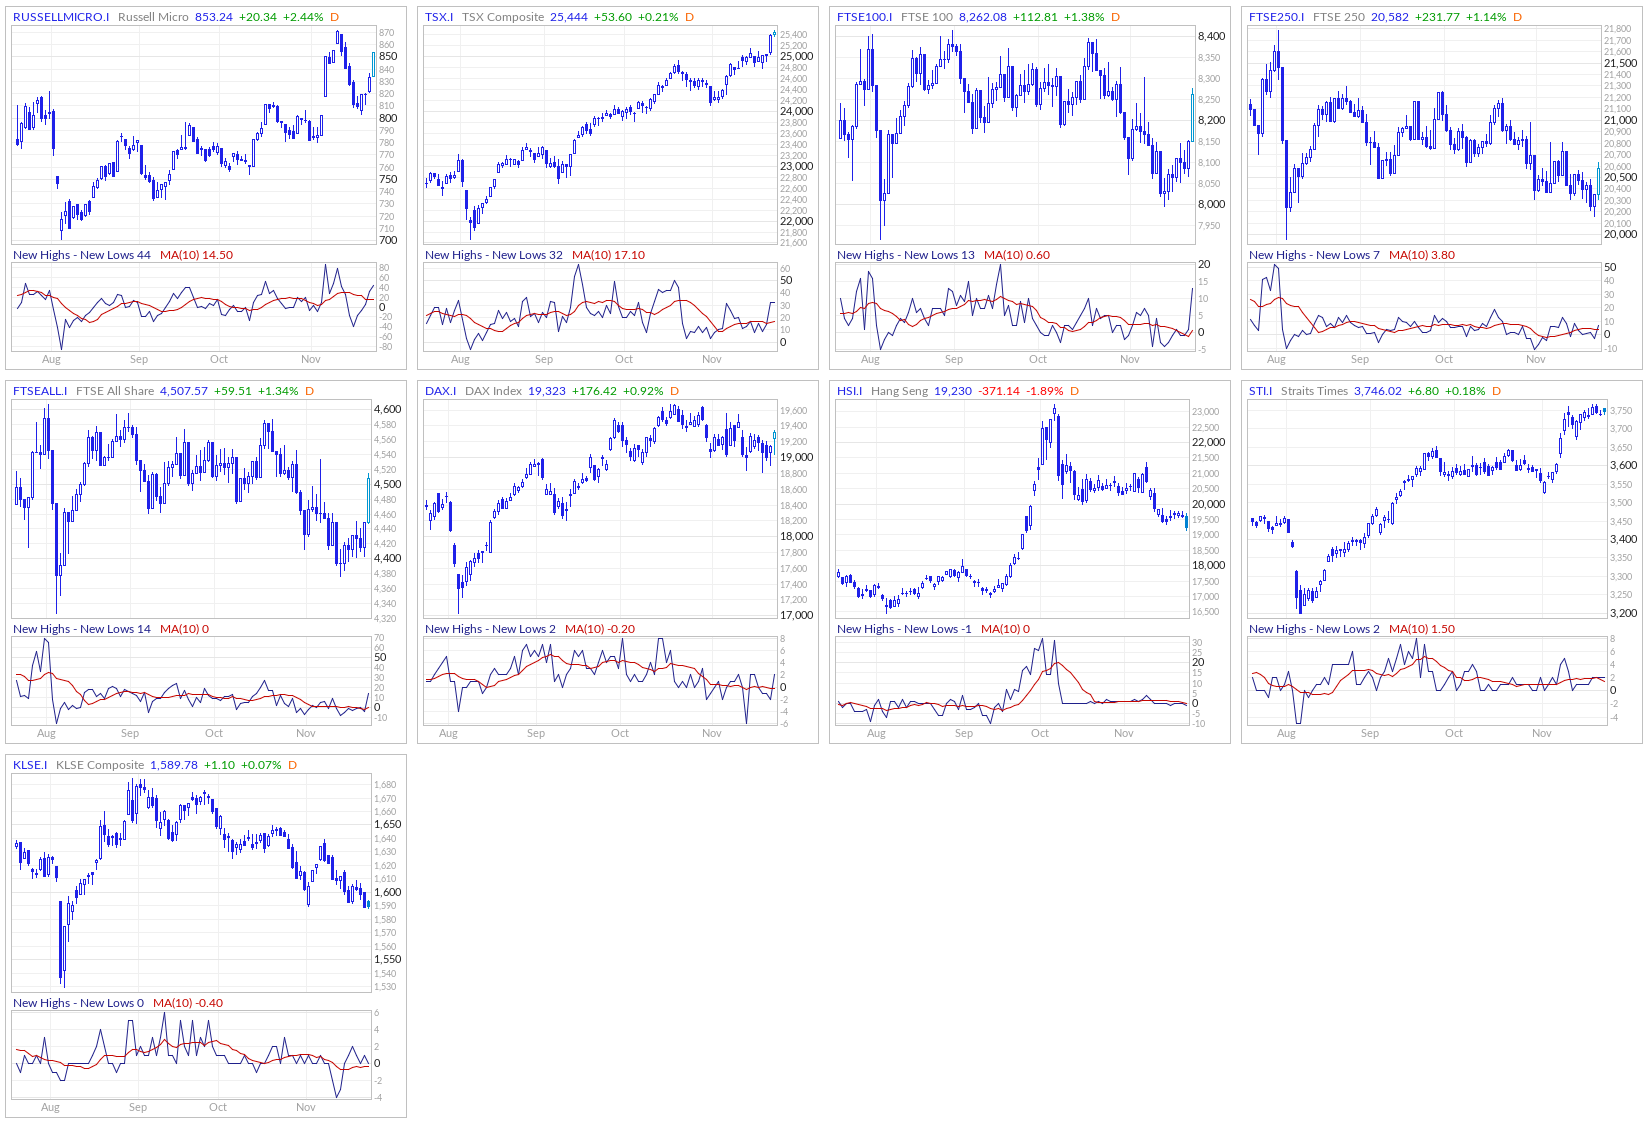
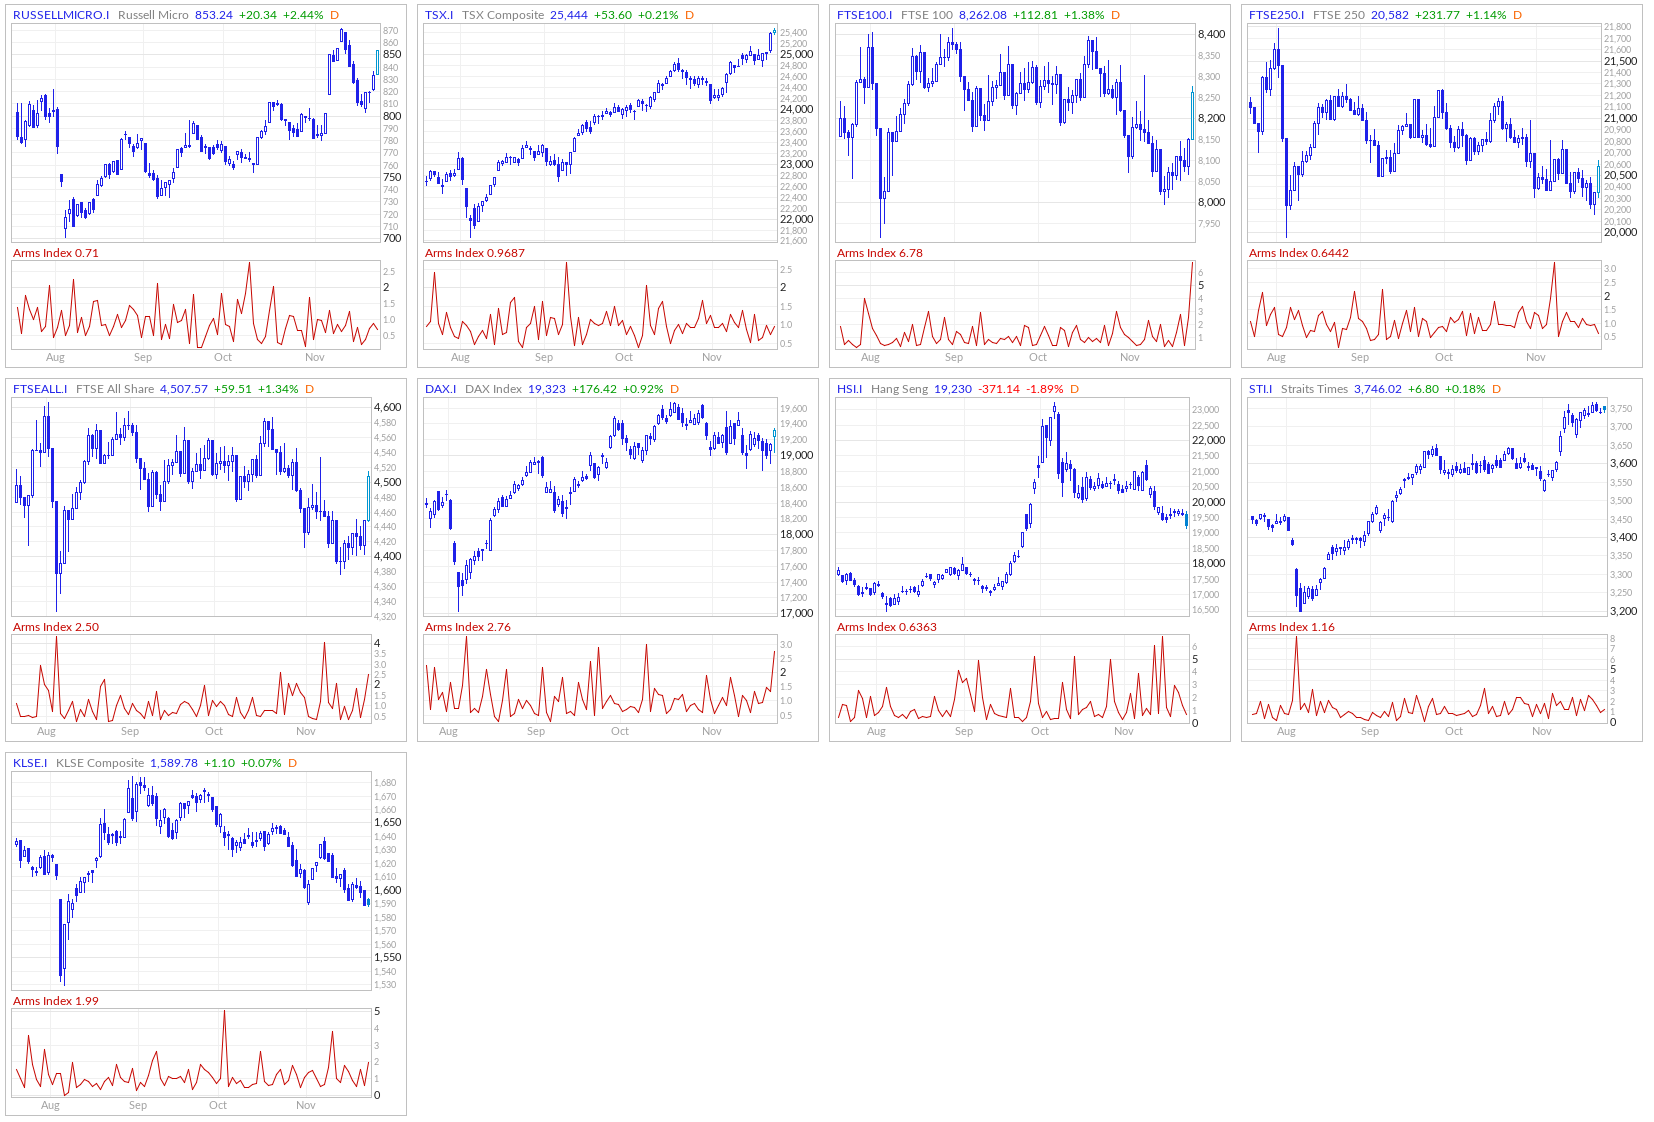
New Highs - New Lows
The New Highs - New Lows indicator (NH-NL) displays the daily difference between the number of stocks reaching new 52-week highs and the number of stocks reaching new 52-week lows. The NH-NL indicator generally reaches its extreme lows slightly before a major market bottom. As the market then turns up from the major bottom, the indicator jumps up rapidly. During this period, many new stocks are making new highs because it's easy to make a new high when prices have been depressed for a long time. The NH-NL indicator oscillates around zero. If the indicator is positive, the bulls are in control. If it is negative, the bears are in control. As the cycle matures, a divergence often occurs as fewer and fewer stocks are making new highs (the indicator falls), yet the market indices continue to reach new highs. This is a classic bearish divergence that indicates that the current upward trend is weak and may reverse.
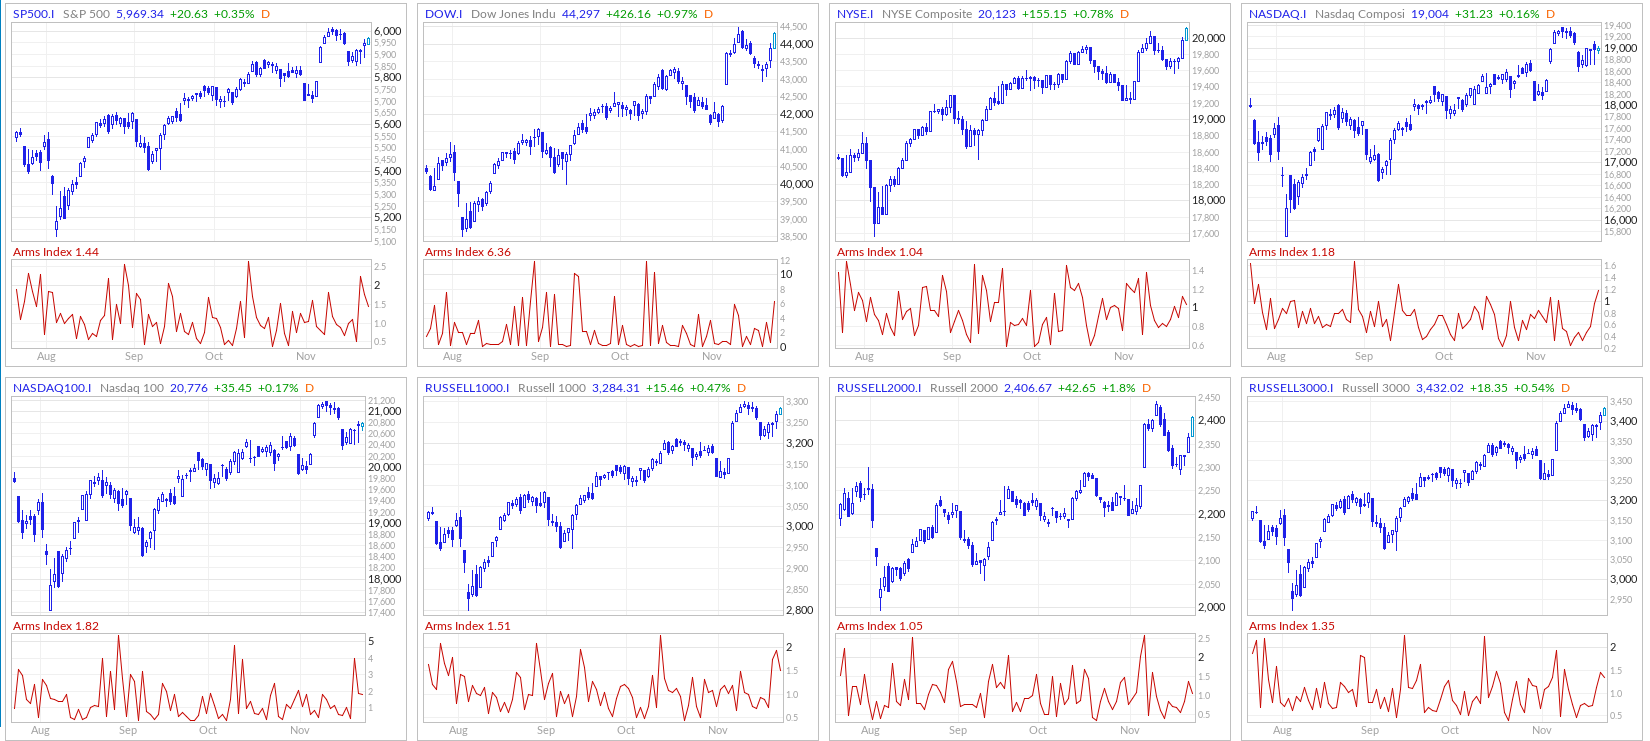
ARMS Index
The Arms Index, also known as the TRIN (Short-Term TRading INdex), was developed by Richard Arms in the 1960s. It is calculated by dividing the ratio of advancing stocks to declining stocks by the ratio of advancing volume to declining volume. Interpreting the Arms Index involves looking at its value in relation to certain thresholds. A value below "1" is considered bullish, indicating that advancing stocks and volume dominate the market. Conversely, a value above "1" is considered bearish, suggesting that declining stocks and volume are more prevalent. Extremely low values (below 0.5) or high values (above 2) are often seen as potential reversal signals.
CME Fedwatch
What is the likelihood that the Fed will change the Federal target rate at upcoming FOMC meetings, according to interest rate traders? Use CME FedWatch to track the probabilities of changes to the Fed rate, as implied by 30-Day Fed Funds futures prices.
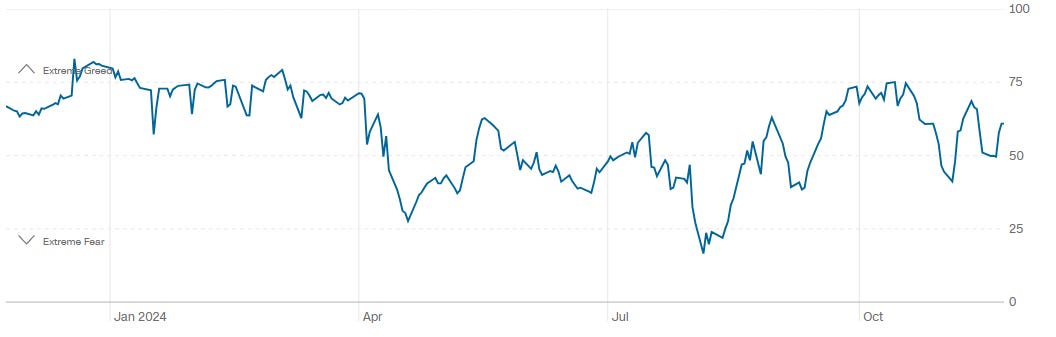
CNN Fear & Greed Constituent Data Points & Composite Index
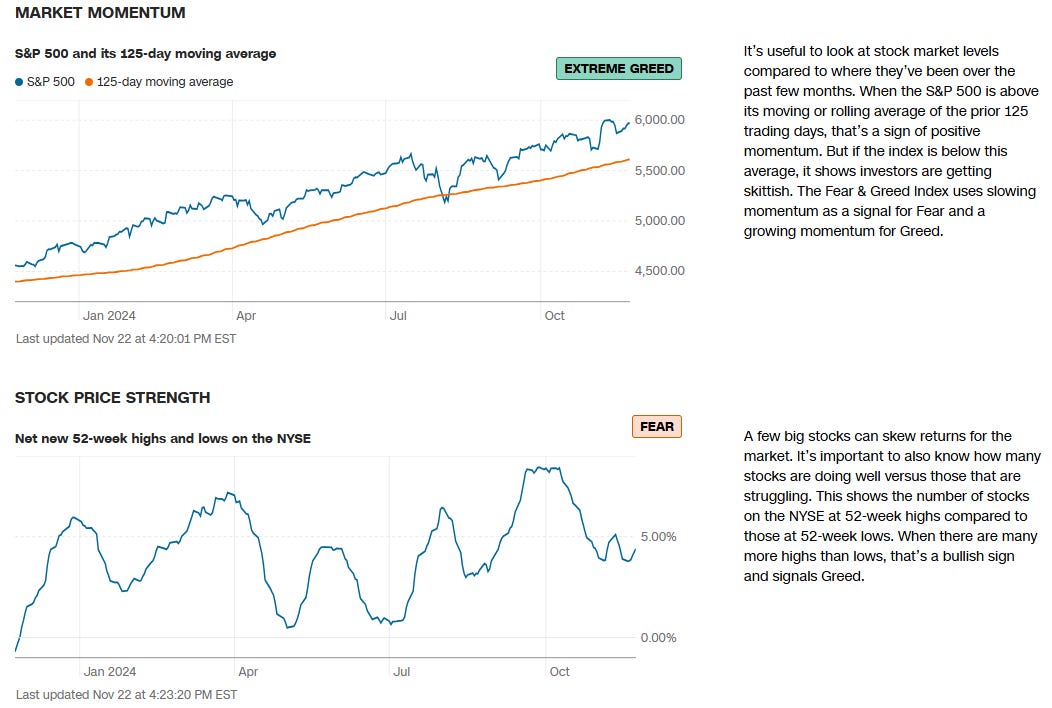
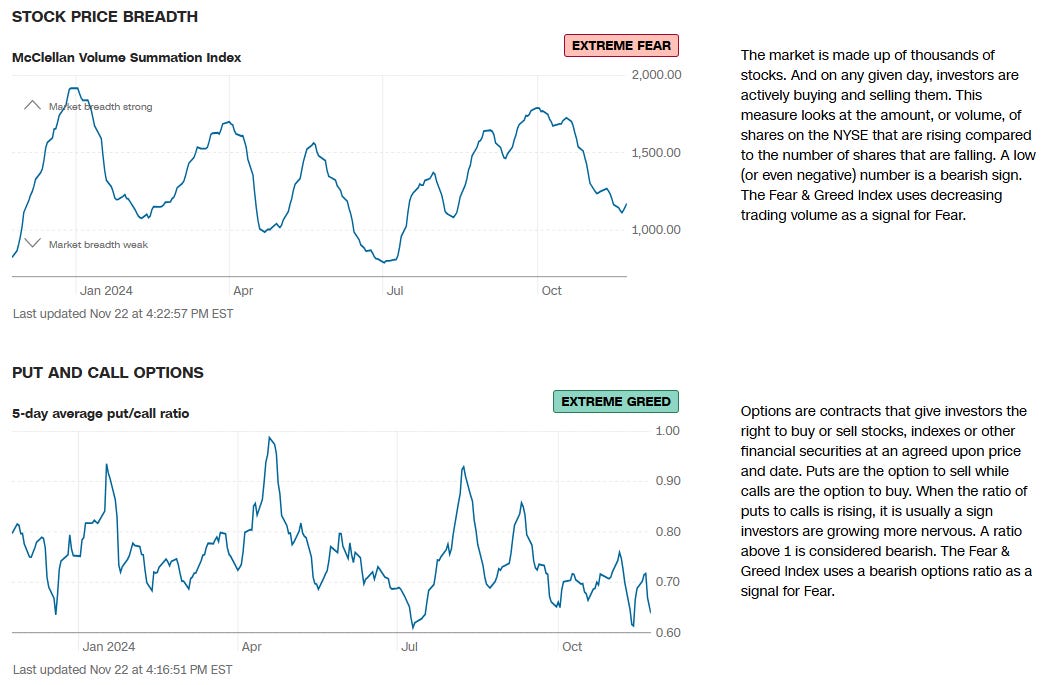
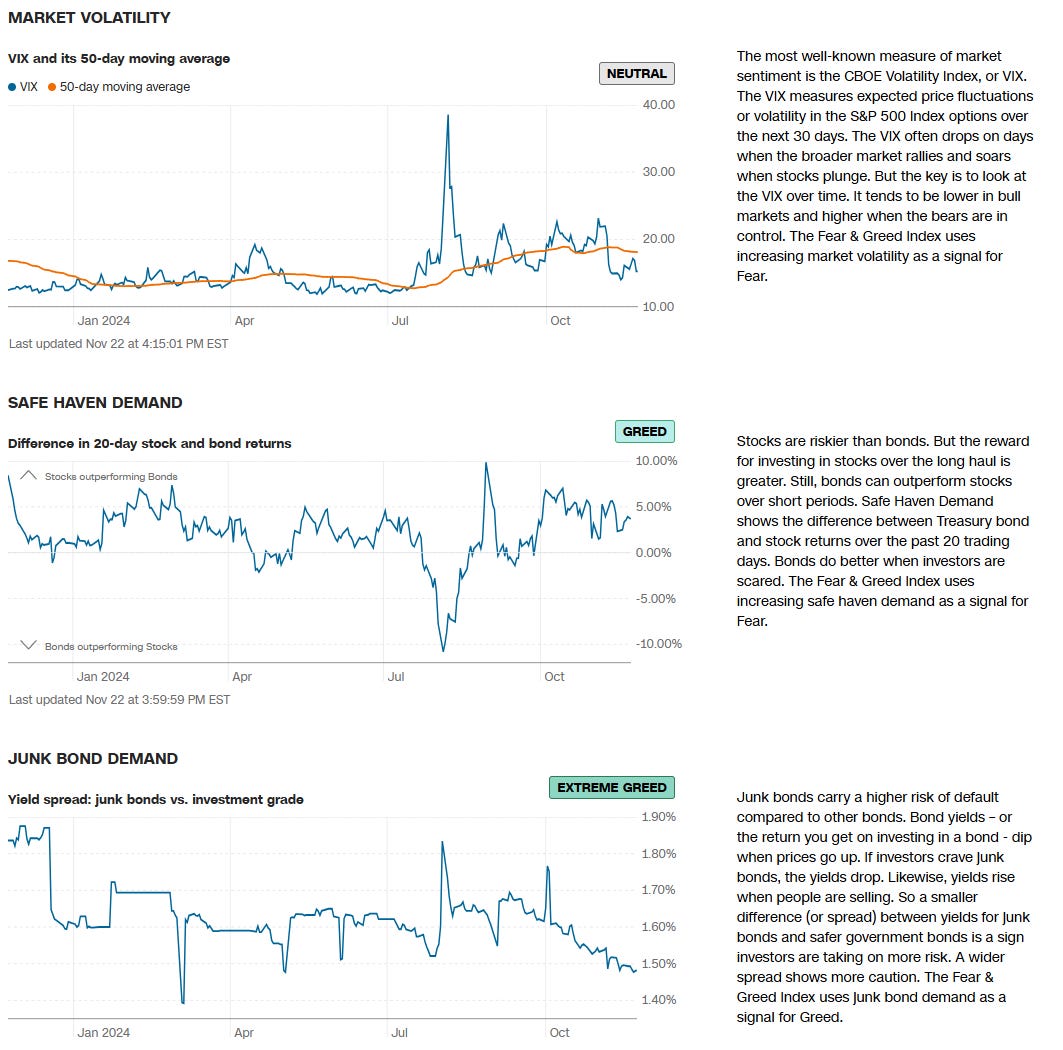
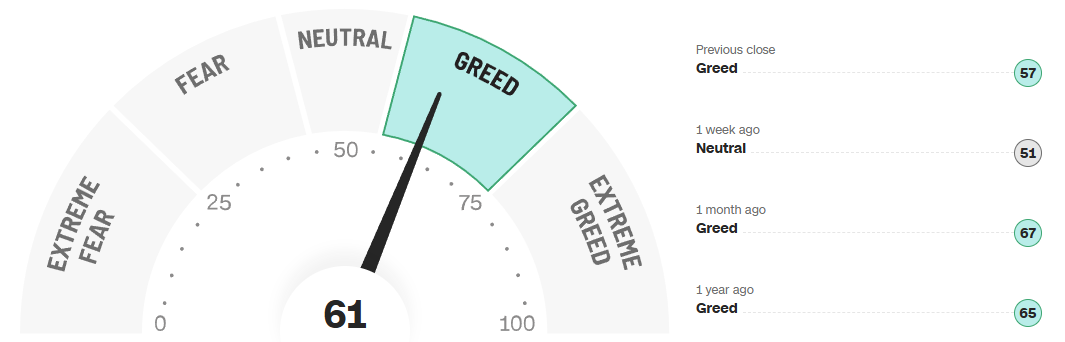
Final Composite Fear & Greed Index Reading
Institutional S/R Levels for Major Indices
When you’re a large institutional player, your primary goal is to find liquidity - places to do a ton of business with the least amount of slippage possible. VolumeLeaders.com automatically identifies and visually plots the exact spots where institutions are doing business and where they are likely to return for more. It’s one of the primary reasons “support” and “resistance” concepts work and truly one of the reasons “price has memory”.
Levels from the VolumeLeaders.com platform can help you formulate trades theses about:
Where to add or take profit
Where to de-risk or hedge
What strikes to target for options
Where to expect support or resistance
And this is just a small sample; there are countless ways to leverage this information into trades that express your views on the market. The platform covers thousands of tickers on multiple timeframes to accommodate all types of traders. Observe for yourself how accurate the levels are by marking-up your charts with the information in the “Trade Levels” boxes and play-along in real-time this week.
SPY -0.01%↓
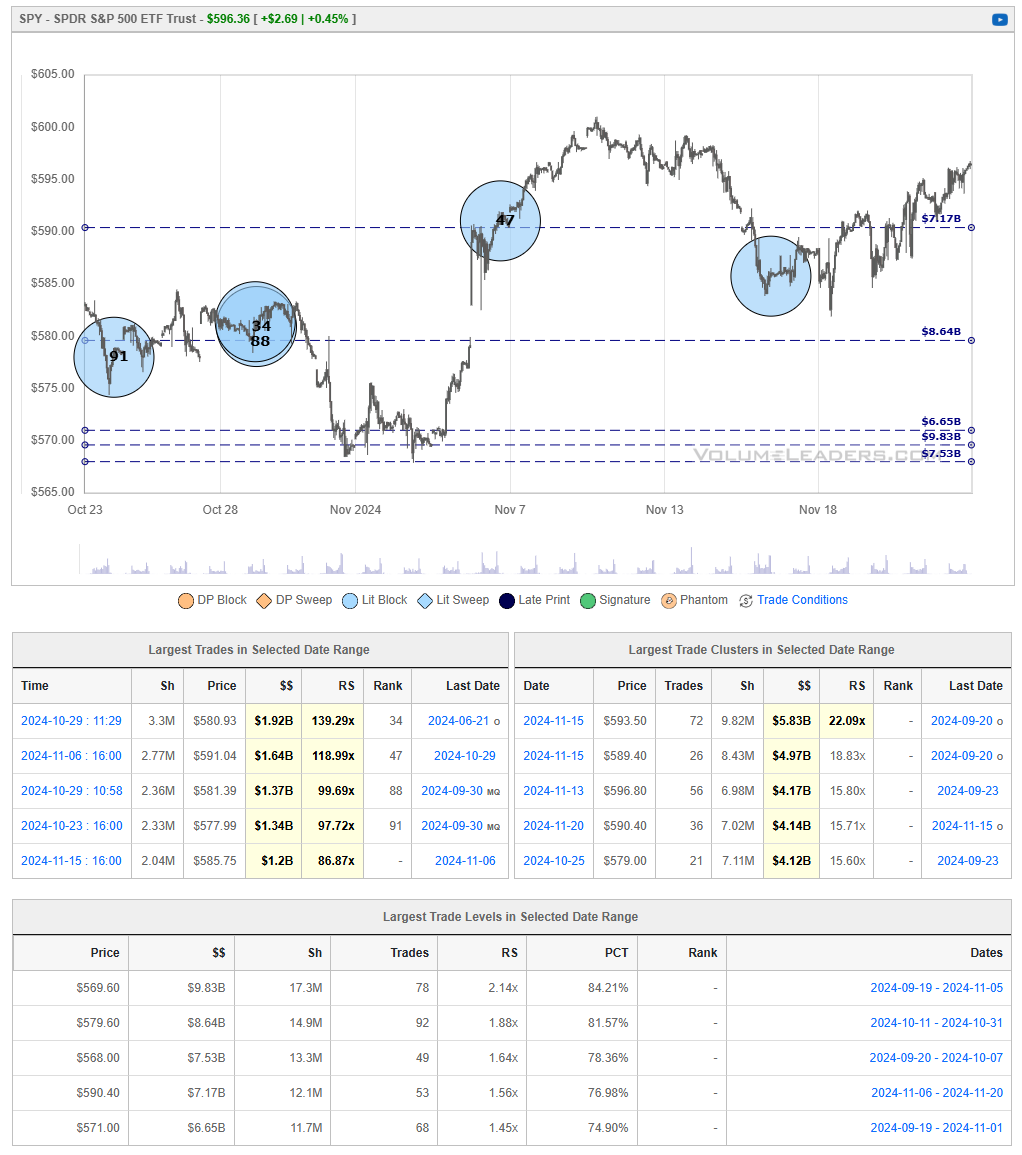
Support Levels:
$569.60: Strong institutional support with $9.83B traded; key floor in case of a pullback.
$577 - $580: Another robust support zone with high relative size (RS) trades in late October.
Resistance Levels:
$590.40 - $593.50: Recent high-value trades ($7.17B at $590.40) indicate significant resistance.
Recent Activity:
Institutional buying on Nov 6 at $591.04 (RS 118.99%) suggests strong interest near the $590 level.
Consolidation near $593 suggests potential breakout above resistance or further testing of lower support zones.
Conclusion: Watch for support at $569.60 and $577-$580. A breakout above $593.50 signals bullish momentum, while failure to hold $577 could lead to further downside.
QQQ 0.06%↑
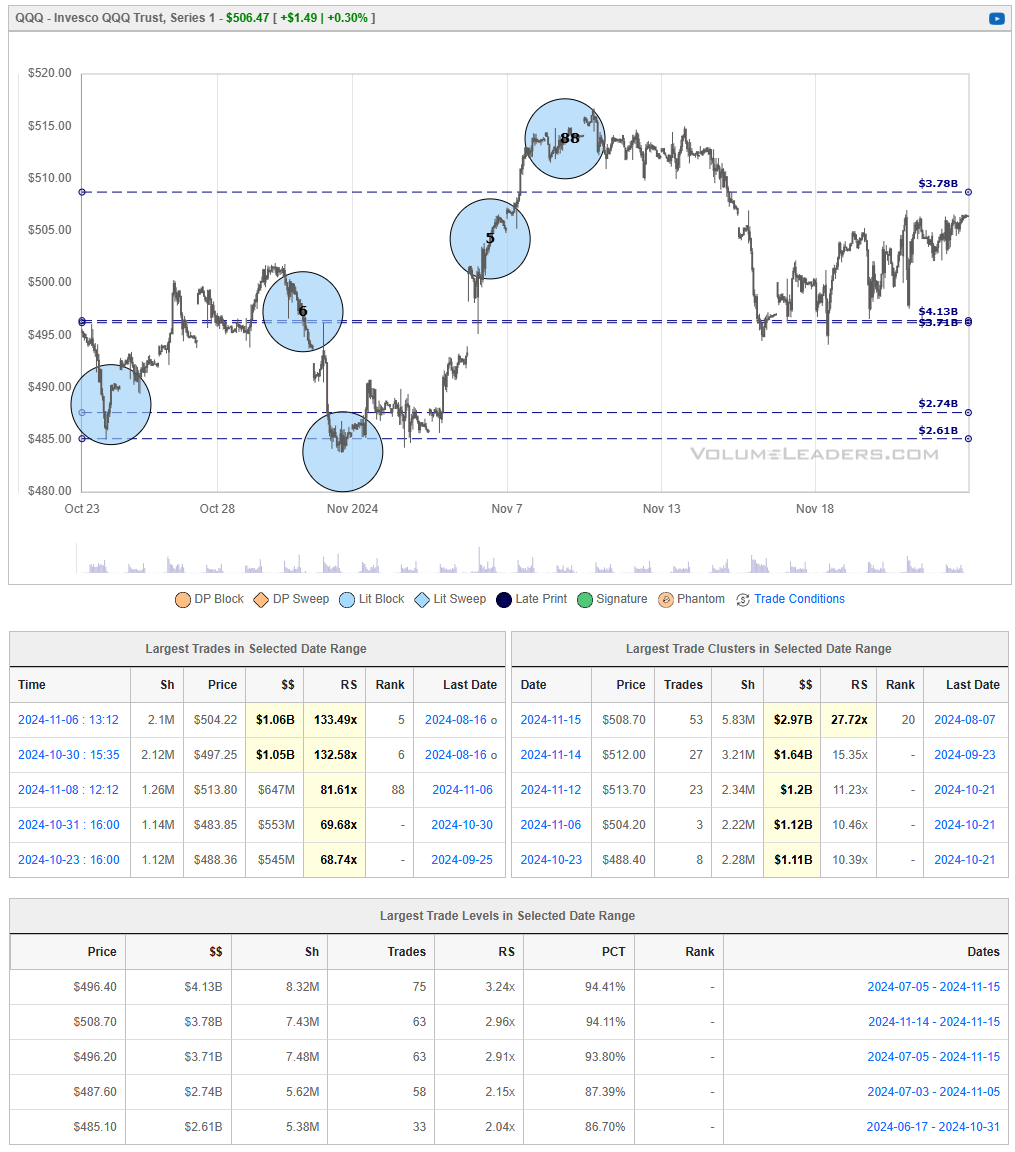
Support Levels:
$485.10 - $487.60: Strong institutional support with $2.61B to $2.74B traded, forming a key floor.
$496.40: High cumulative volume ($4.13B) suggests additional support here in case of a retracement.
Resistance Levels:
$504.22 - $508.70: Recent heavy institutional trades (RS up to 133.49%) highlight this as a key resistance zone.
$512.00: A secondary resistance level with notable selling activity.
Recent Activity:
Institutional buying peaked on Nov 6 at $504.22 (RS 133.49%), marking a crucial resistance level.
Consolidation in the $500 range indicates indecision, with buyers and sellers balanced.
Conclusion: Monitor support at $485.10 - $487.60 and $496.40. A breakout above $508.70 signals further upside, while a drop below $485 could lead to additional downside pressure.
IWM 0.08%↑
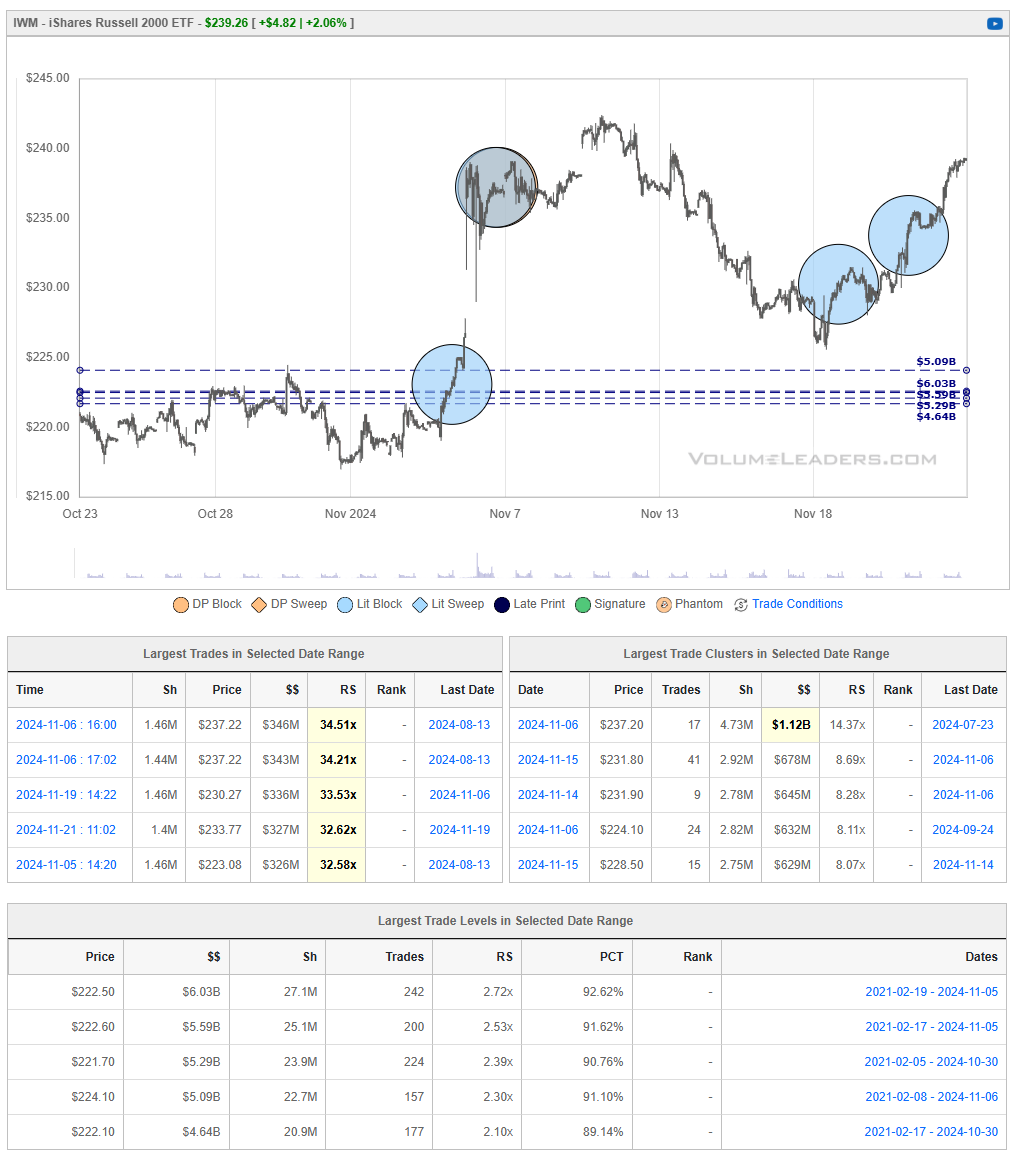
Support Levels:
$222.50: Strong institutional support with $6.03B traded, marking a critical floor.
$224.10: Intermediate support backed by $5.09B in activity.
Resistance Levels:
$237.22: Significant resistance with $346M traded on Nov 6 (RS 34.51%).
$231.90 - $233.77: Resistance zone with substantial trades and RS values above 32%.
Recent Activity:
Institutional buying on Nov 6 at $237.22 indicates resistance near the $237 level.
Price action shows strong recovery from the $222 support zone, reflecting bullish sentiment.
Conclusion: Watch for support at $222.50 and $224.10. A breakout above $237.22 signals further upside, while a failure to hold $224 may lead to a retest of lower levels.
DIA 0.05%↑
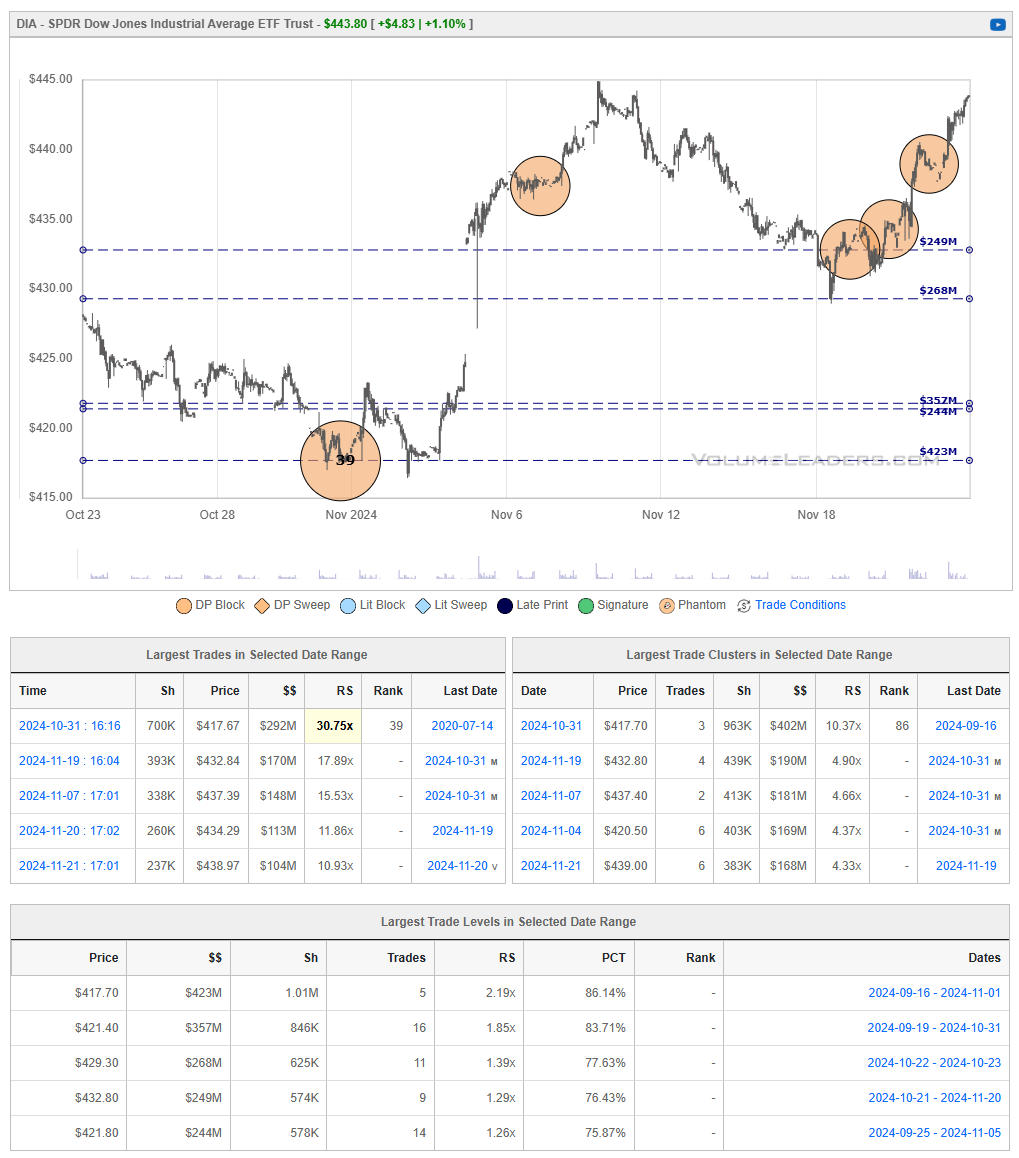
Support Levels:
$417.70: Strong institutional support with $423M traded and an RS of 2.19x, serving as a critical floor.
$421.80 - $429.30: Additional support zones backed by cumulative activity of $244M and $268M, respectively.
Resistance Levels:
$432.84 - $438.97: Notable resistance with high-value trades (RS up to 15.53%) and consistent institutional activity.
$439.00: Upper resistance, marked by a significant trade on Nov 21 ($104M).
Recent Activity:
Institutional buying peaked on Nov 21 at $439.00, indicating potential short-term resistance.
DIA has shown strong recovery from the $417 support zone, maintaining bullish momentum.
Conclusion: Key support lies at $417.70 and $421.80, with resistance at $432.84 and $439.00. A breakout above $439 could signal further upside, while a retracement may test support around $429.30.
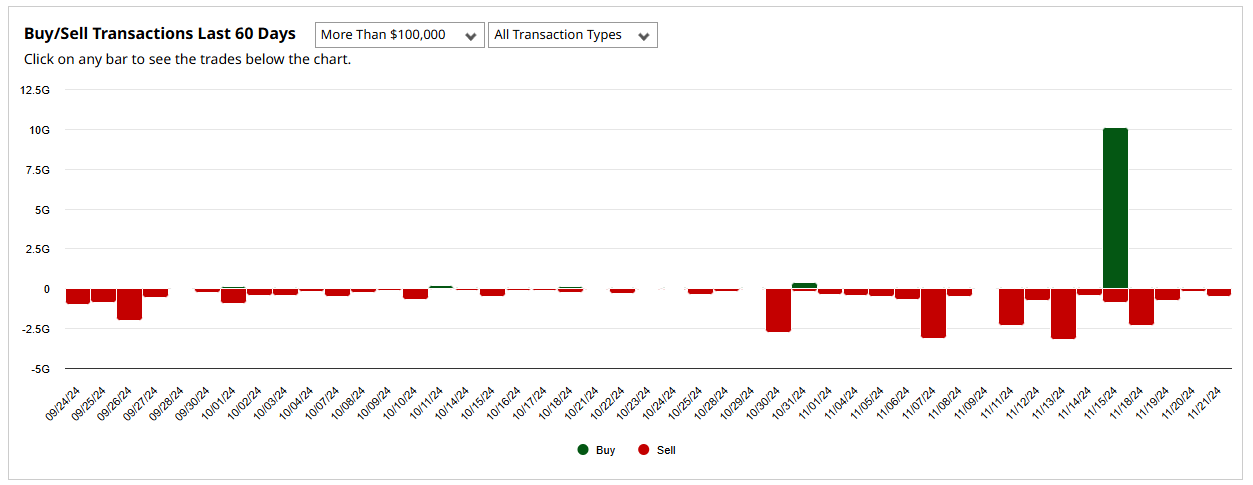
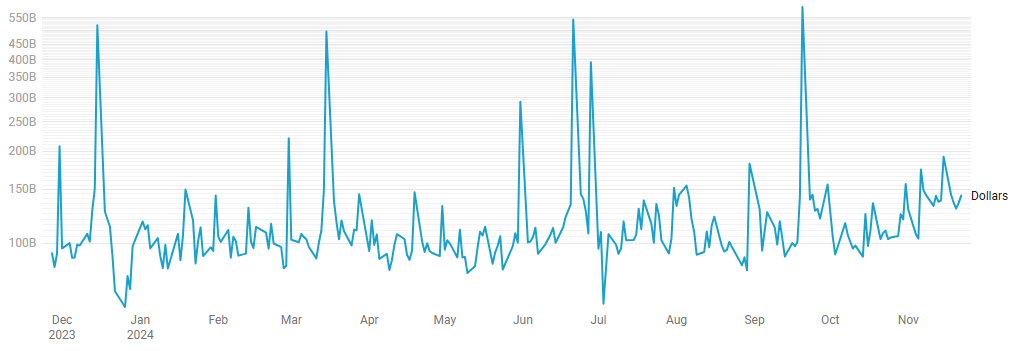
Institutional Order Flow
Rolling 1-Yr Dollars By Day
This chart shows institutional activity by dollars on a rolling 1-year basis. A log scale is used to dampen the outsized-effects of OpEx-days and to help highlight more nuanced activity at the lows.
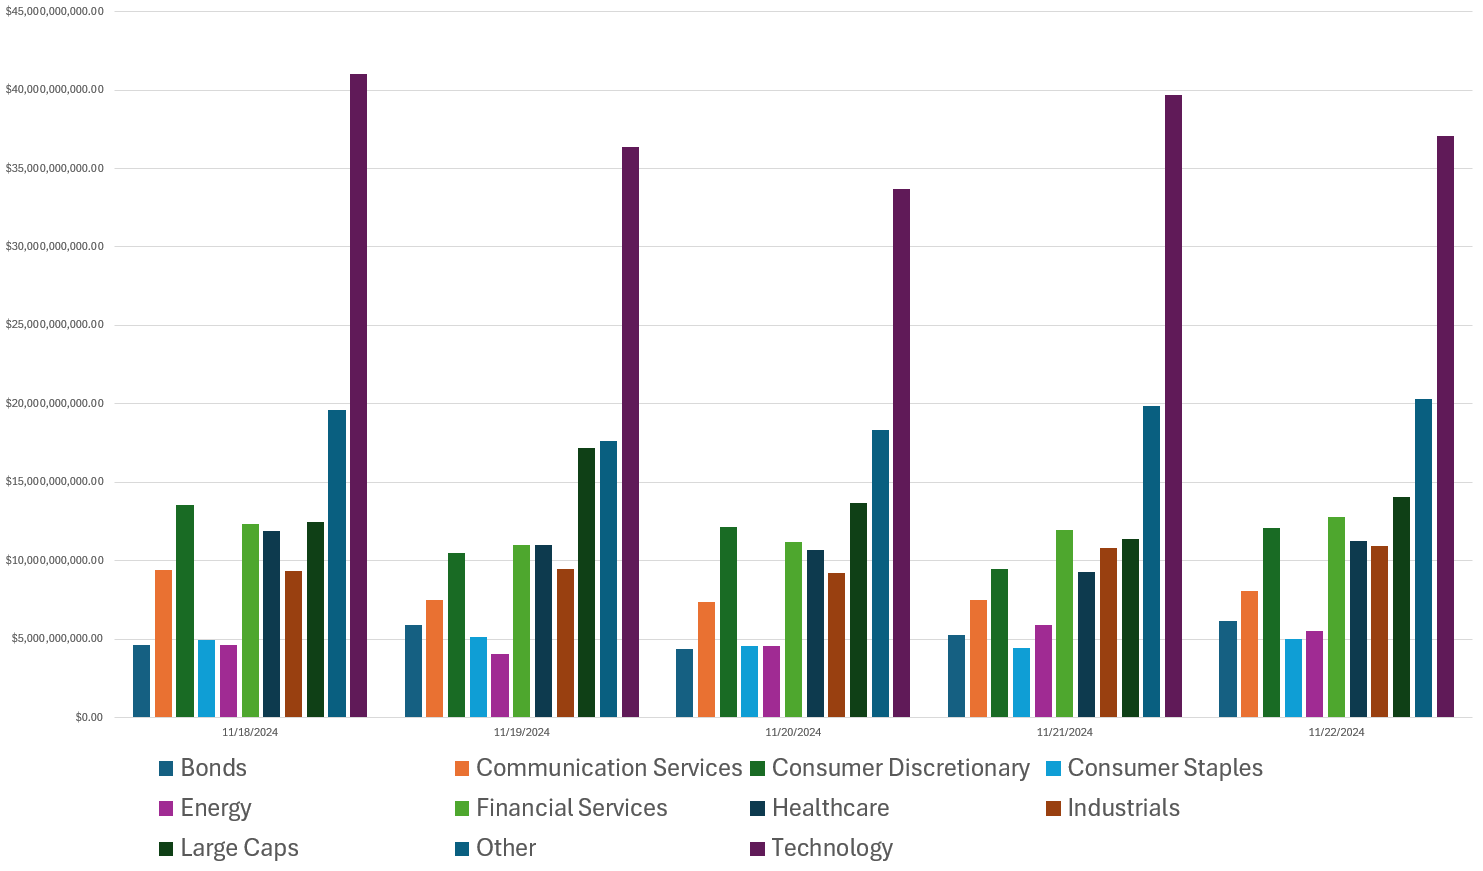
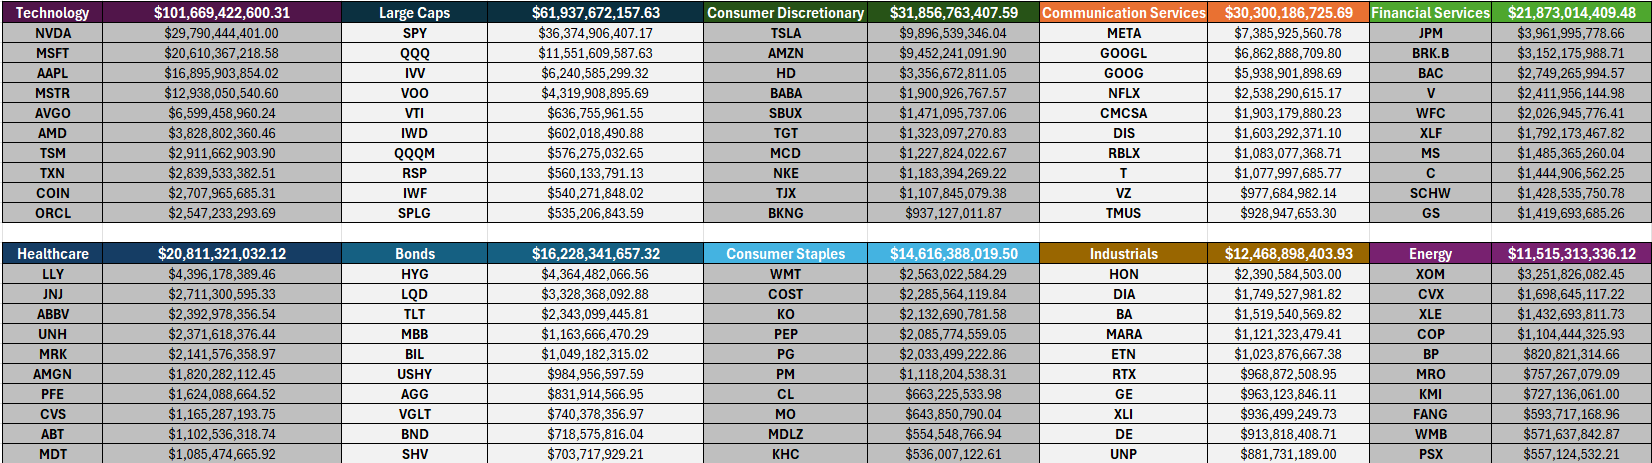
Last Week’s Institutional Activity By Sector
This is an incredibly important chart to watch as it contains lots of nuanced suggestions at a thematic level. Watch this chart closely week-to-week to stay informed about where institutional money is flowing, adjust your strategies based on momentum, align your portfolio with macroeconomic and market trends, and manage risks more effectively by avoiding sectors losing institutional favor. The Top 10 active sectors are identified and the rest grouped as “Other”.
Sector Rotation Insights: The chart highlights which sectors are attracting institutional activity and which are losing favor. Institutions often lead market trends, so tracking shifts in their focus can indicate sector rotations.
Sentiment Analysis: The level of institutional activity reflects confidence in specific sectors. Rising activity in traditionally defensive sectors (e.g., healthcare, utilities) may indicate caution, while a surge in growth sectors (e.g., technology, consumer discretionary) could suggest optimism.
Emerging Trends: Sudden spikes in a previously overlooked sector, like industrials or consumer staples, might hint at emerging opportunities or structural shifts.
Macro Themes: Changes in sector activity often align with broader macroeconomic themes like inflation, interest rates, or geopolitical events. For instance:
Increased activity in energy might indicate concerns about oil supply or rising prices.
Growth in technology could align with innovations or favorable policies.
Risk Management: Declining institutional activity in a sector might signal weakening fundamentals or heightened risks.
Spotting Overcrowding: Excessive activity in a single sector over multiple weeks may suggest overcrowding, which could lead to heightened volatility if institutions begin to exit.
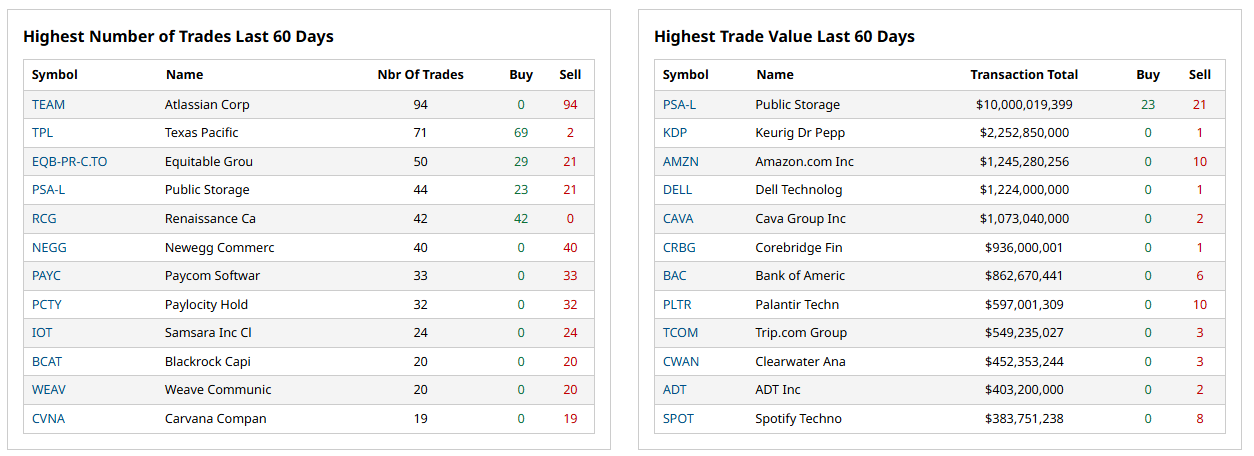
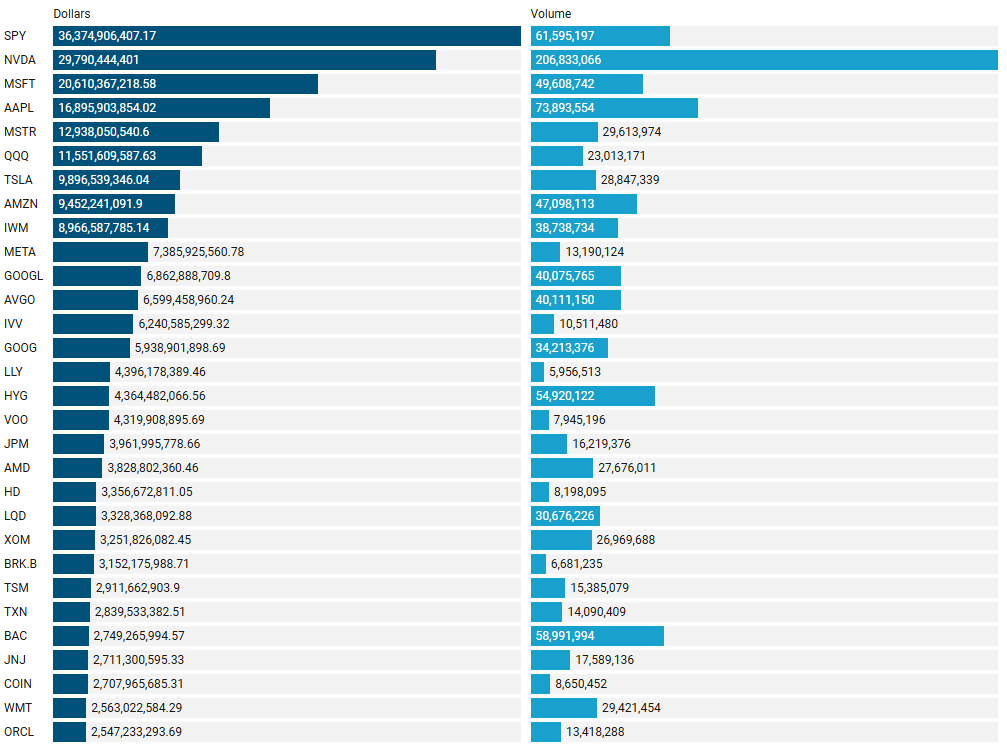
Top Institutional Orderflow In Individual Names
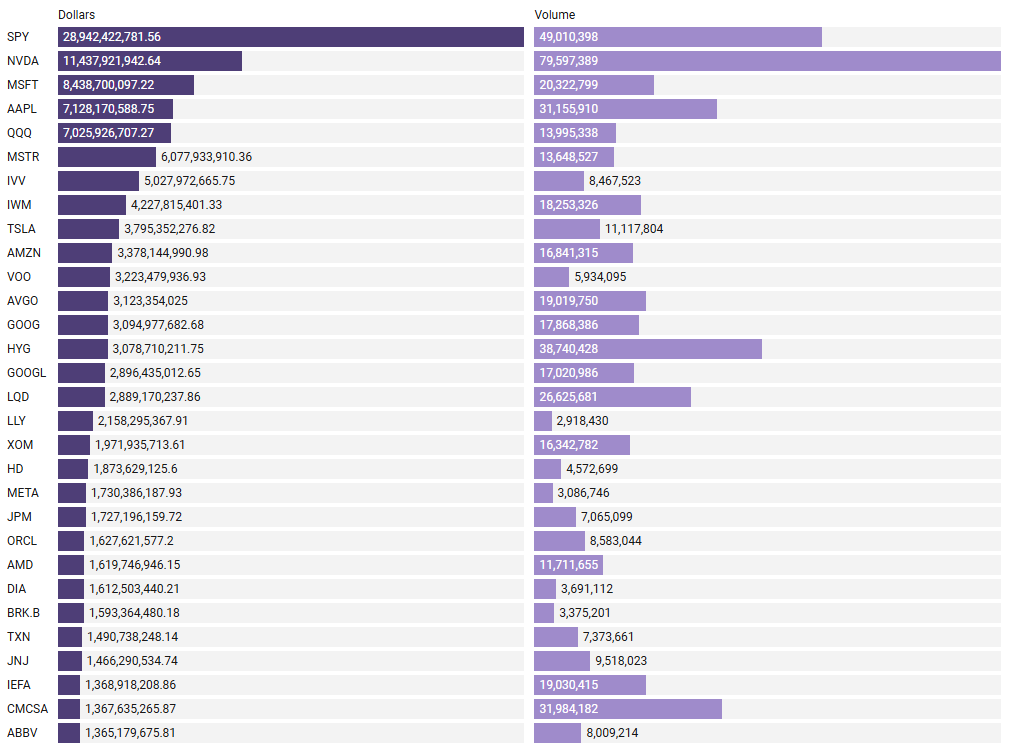
Many excellent trade ideas and sources of inspiration can be found in these prints. While only the top 30 from each group are displayed, the complete results are accessible in VolumeLeaders.com for you to explore at your convenience any time. Remember to configure trade alerts within the platform to ensure you never overlook institutional order flows that capture your interest or are significant to you. The blue charts encompass all types of trades, including blocks on lit exchanges; the purple charts exclusively depict dark pool trades; and the green charts represent sweeps only.
Top Aggregate Dollars Transacted by Ticker
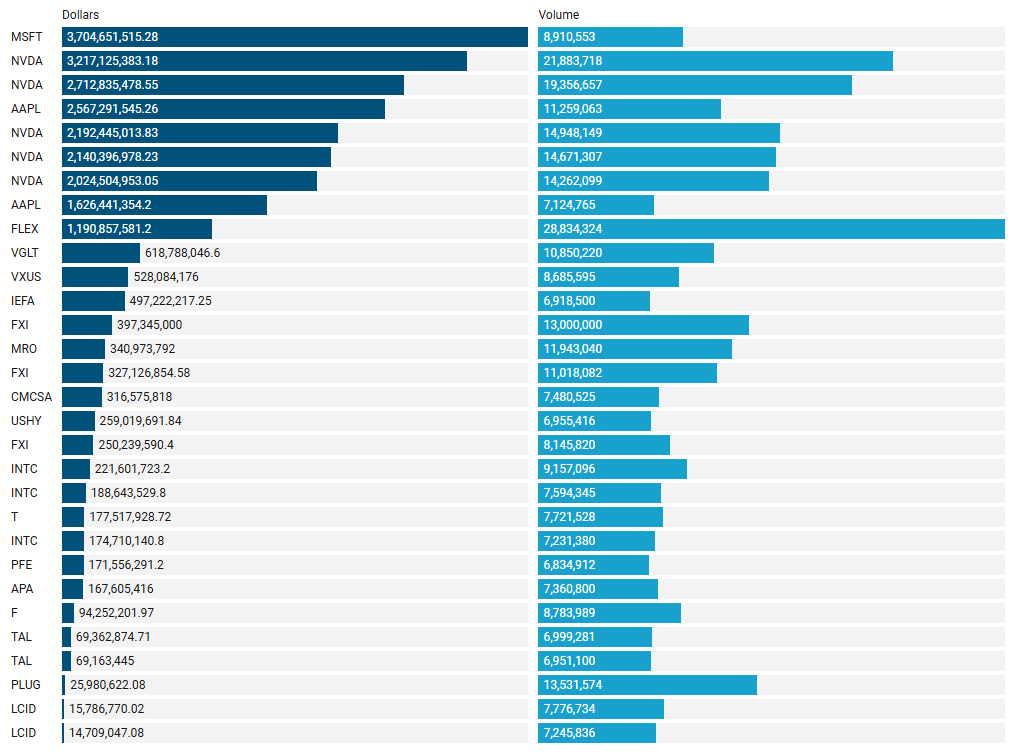
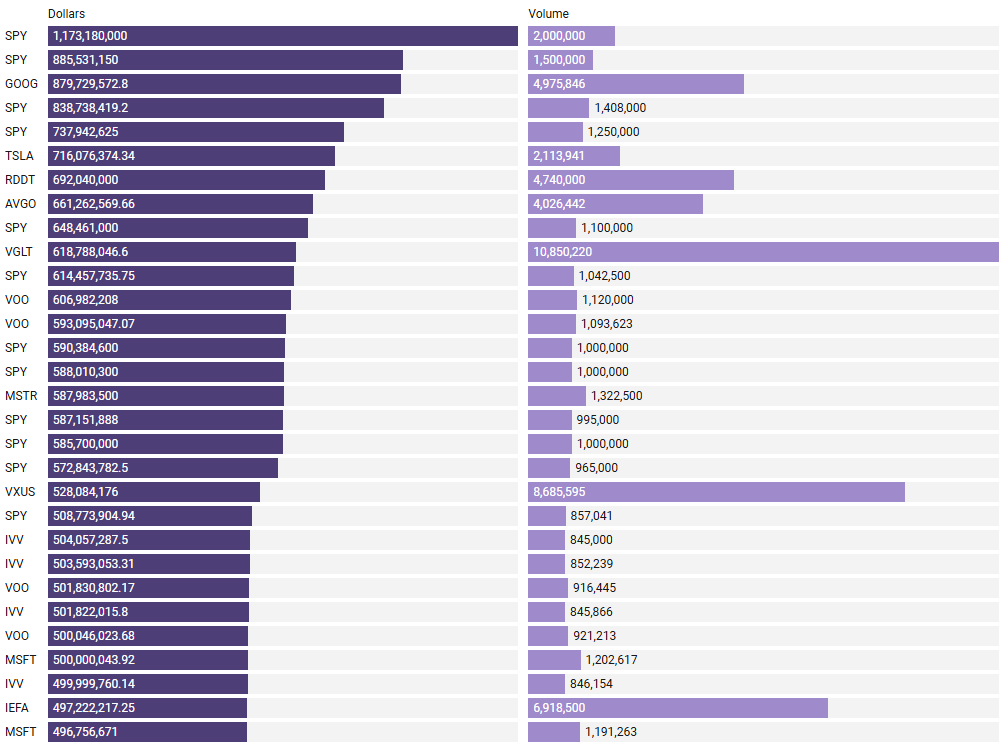
Largest Individual Trades by Dollars Transacted
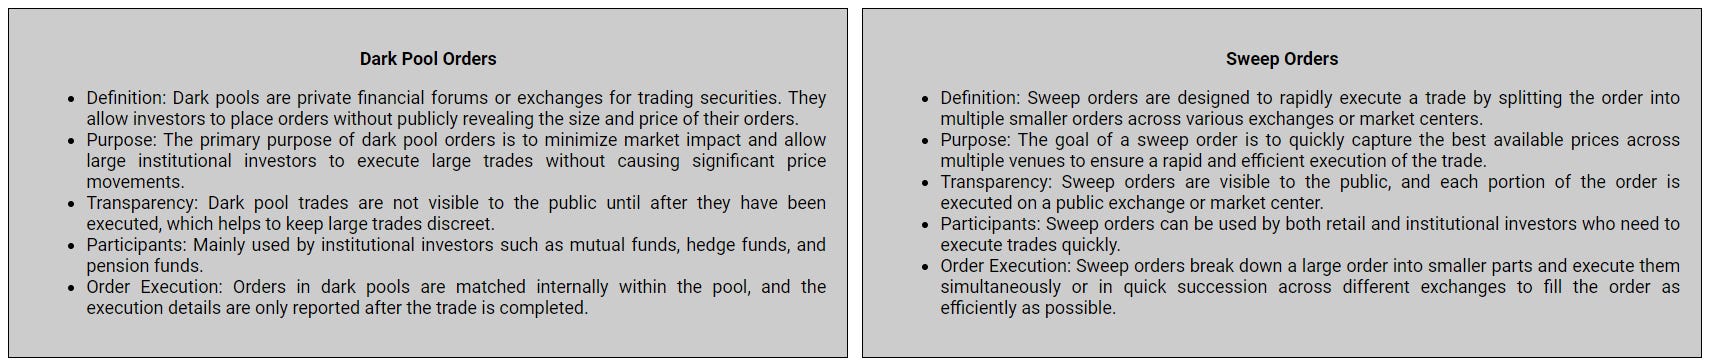
Top Aggregate Dark Pool Activity by Ticker
Largest Individual Dark Pool Blocks by Dollars
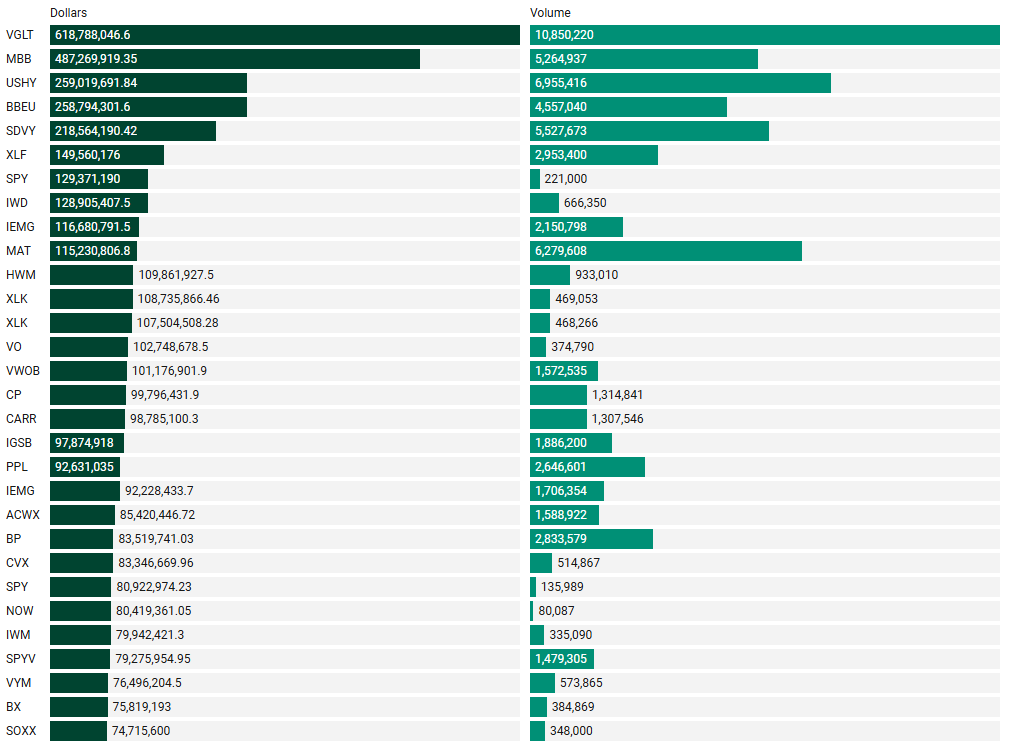
Top Aggregate Sweeps by Ticker
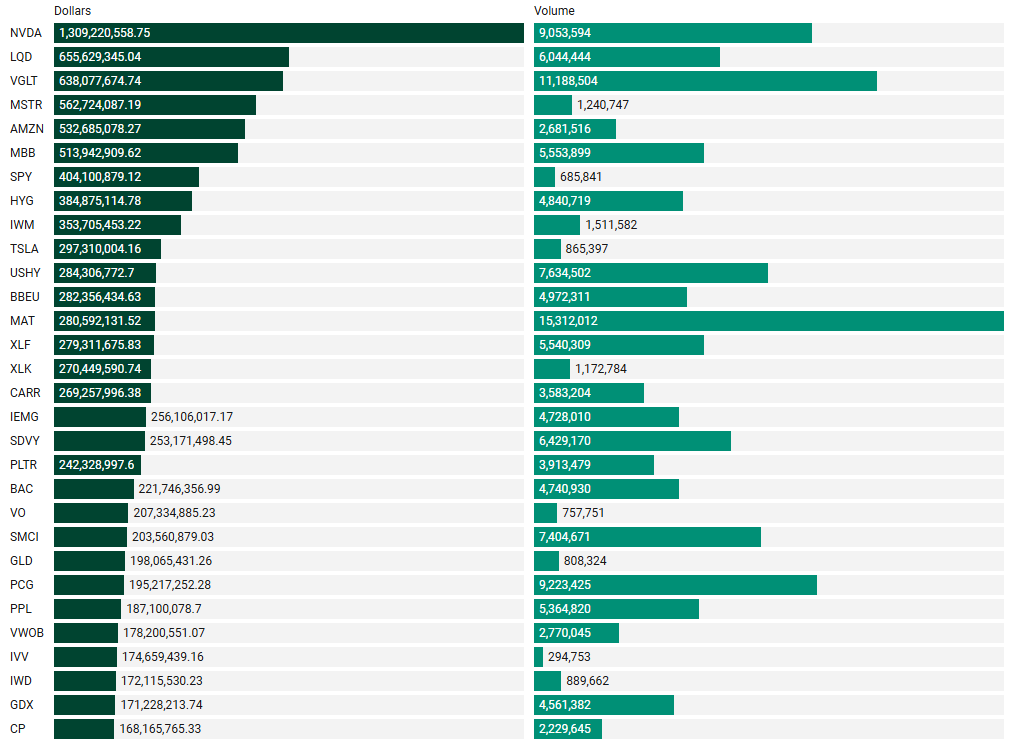
Top Individual Sweeps by Dollars Transacted
Last Week’s Institutionally-Backed Gainers & Losers
If you’re going to bet on a name, consider one that is officially endorsed by an institution! These are the top percent gainers (green) and percent losers (red) from this week’s open-to-close that had a trade price greater than $20 and institutional involvement. Continue watching tickers from this and prior stacks as these names frequently turn into multi-leg trades with a lot of movement!
Top Institutionally Backed Gainers
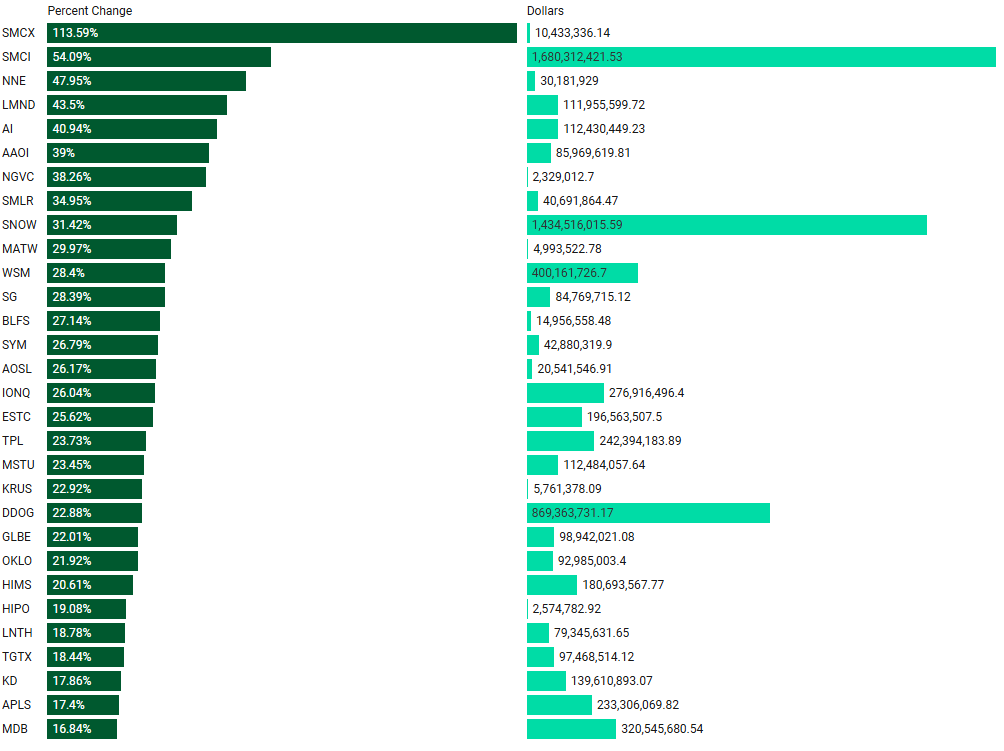
Top Institutionally Backed Losers

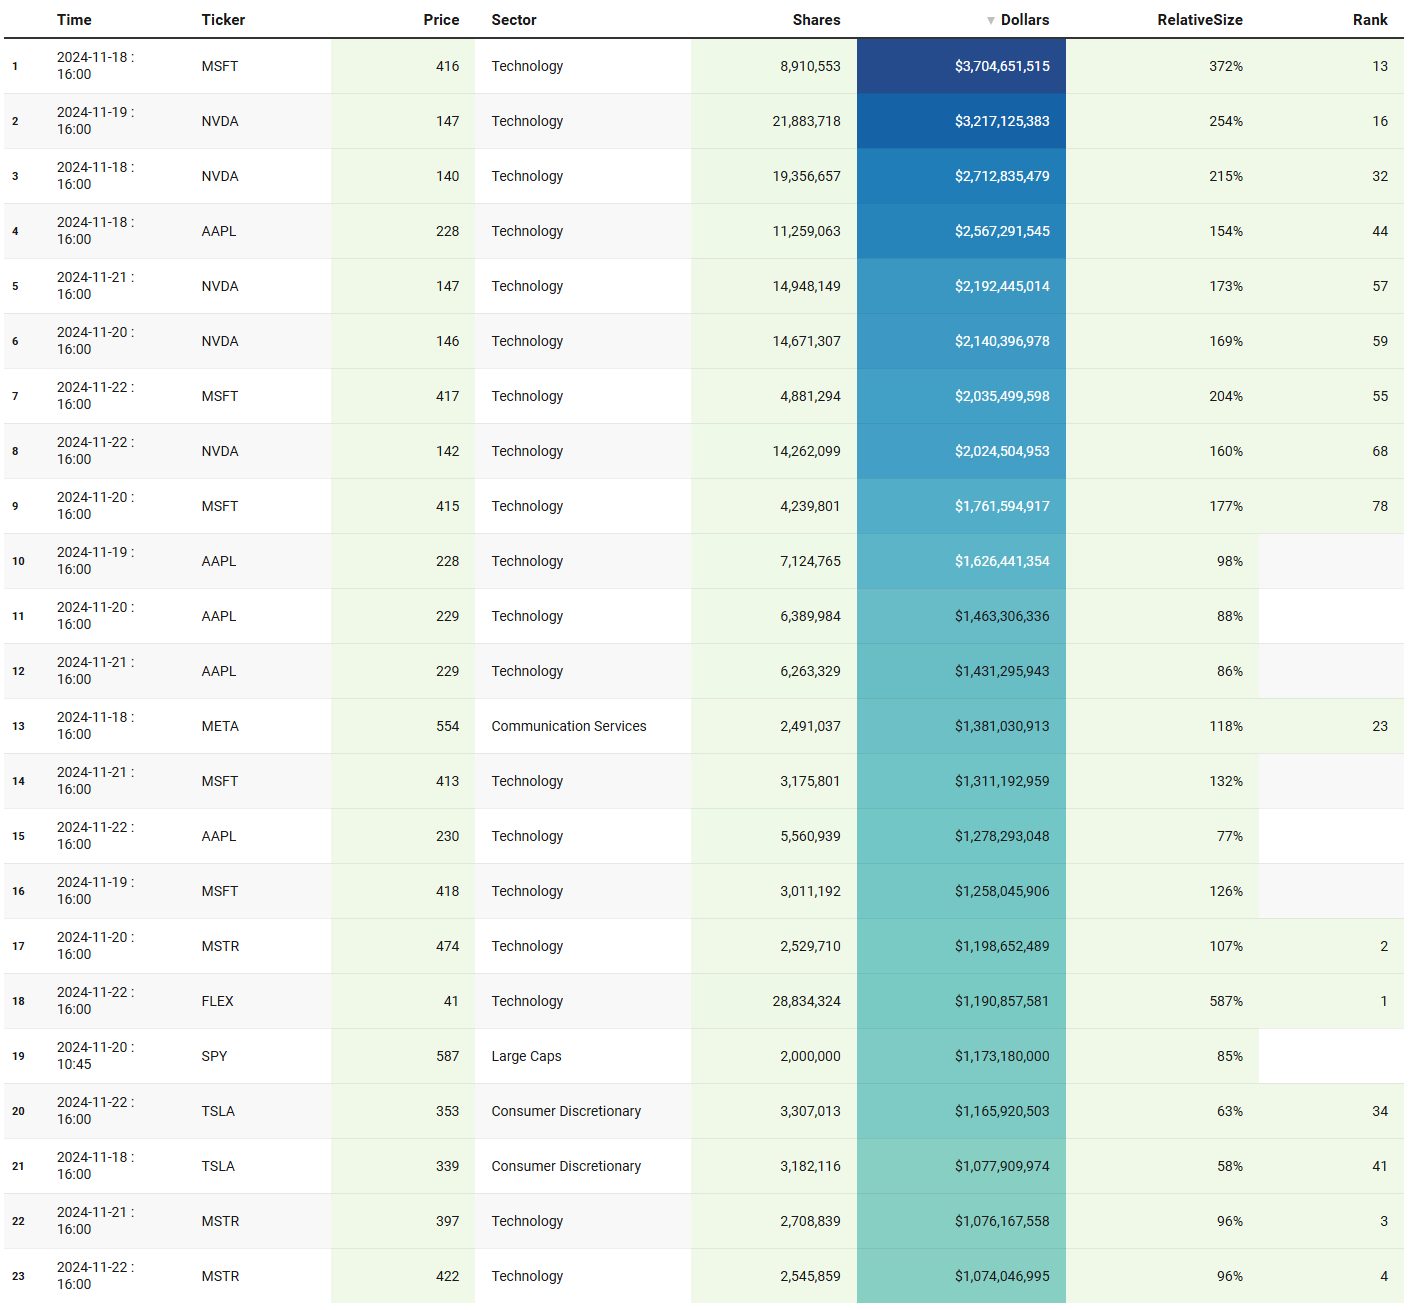
Last Week’s Billion-Dollar Prints
Tickers that printed a trade worth at least $1B last week get a special shout-out… Welcome to the club. Subs should login to VolumeLeaders.com to get the exact trade price and relevant institutional levels around the trade - these are massive commitments by institutions that should not be ignored.
Investments In Focus: Bull vs Bear Arguments
Please read “Institutional S/R Levels For Major Indices” at the top of this stack to understand the nature and importance of what we’re looking at here visually. Institutions leave footprints that VolumeLeaders.com can illustrate for you while providing context to assess things like institutional conviction and urgency. Theses and data given below are not financial advice, just personal observations that may be wrong; consult a certified financial advisor before making any investment decisions.
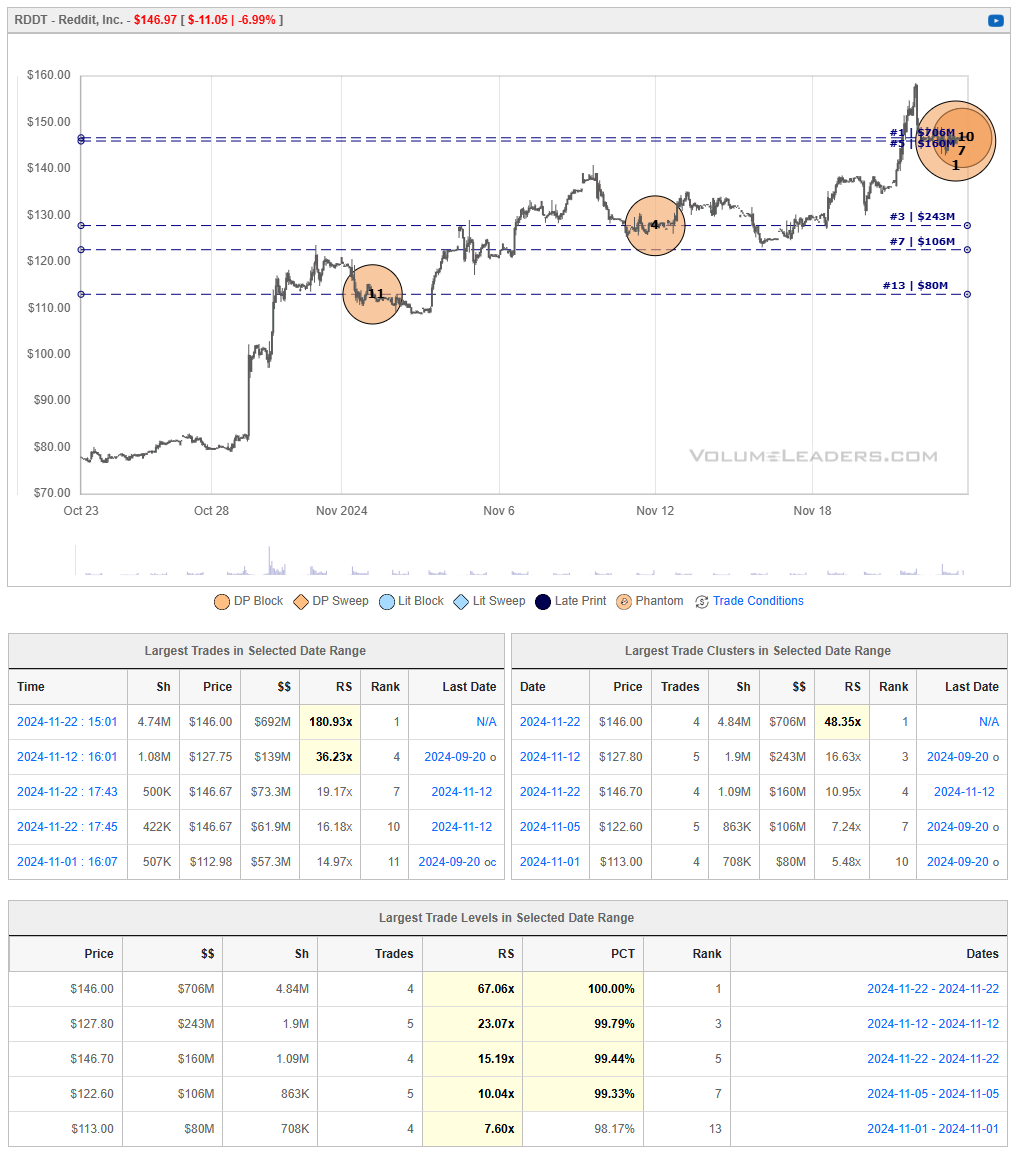
RDDT 0.09%↑
Reddit, Inc. (NYSE: RDDT) is a prominent social media platform that facilitates user-generated content and community engagement across a wide array of topics. Since its initial public offering (IPO) in March 2024, Reddit has demonstrated significant growth in both user base and financial performance.
Analysts have provided mixed views on Reddit's prospects. Bernstein analyst Mark Shmulik described Reddit as a "rocketship" and a "Jekyll and Hyde story," highlighting its transition from pre-IPO struggles to significant AI-driven growth post-IPO.
Advance Magazine Publishers' Credit Facility: Advance Magazine Publishers, the parent company of Condé Nast, plans to establish a credit facility by borrowing against its Reddit stake. This involves offering 7.8 million Reddit shares, valued up to $1.2 billion, and purchasing derivatives to maintain its ownership level. Tencent Holdings' Share Reduction: Chinese conglomerate Tencent Holdings has reduced its Reddit holdings from 10.7 million to 7.7 million shares, with the current stake valued at approximately $1.1 billion. These actions led to a decline in Reddit's stock price by more than 8% on Friday, November 22, 2024, despite the stock remaining significantly higher than its post-IPO closing price from March.
Bull Thesis for Reddit, Inc. (RDDT):
Strong Financial Performance: In Q3 2024, Reddit reported its first-ever profit, with earnings of $0.16 per share, surpassing analyst expectations of a $0.07 loss. Revenue increased by 68% year-over-year to $348.4 million, driven by a 47% rise in daily active users to 97 million.
Rapid User Growth: The platform's daily active users grew by 47% year-over-year, reaching 97 million, indicating strong user engagement and platform relevance.
AI Integration Enhancing Engagement: Reddit's implementation of AI-driven features, such as language translation and an improved "Ask Me Anything" product, has increased user engagement and contributed to revenue growth.
Positive Analyst Outlook: Analysts have raised their price targets for Reddit, with Piper Sandler increasing its 2025 revenue estimate to $1.75 billion and EBITDA estimate to $524 million, surpassing consensus expectations.
Strong Stock Performance: Since its IPO in March 2024, Reddit's stock has surged by 191%, reflecting investor confidence in the company's growth trajectory and strategic initiatives.
Bear Thesis for Reddit, Inc. (RDDT):
Shareholder Divestment: Advance Magazine Publishers, a significant shareholder, plans to borrow against its $1.2 billion stake in Reddit by offering 7.8 million shares, which may indicate a lack of confidence in the company's future performance.
Insider Selling: Tencent Holdings reduced its stake in Reddit by 28%, selling $400 million worth of shares, which could signal concerns about the company's valuation or future prospects.
Stock Price Volatility: Following reports of shareholder divestments, Reddit's stock fell more than 8%, indicating potential volatility and investor uncertainty.
Dependence on Advertising Revenue: A significant portion of Reddit's revenue comes from advertising, making it susceptible to fluctuations in the digital advertising market and economic downturns.
Competitive Social Media Landscape: Reddit faces intense competition from other social media platforms, which could impact user growth and engagement if competitors introduce more appealing features or services.
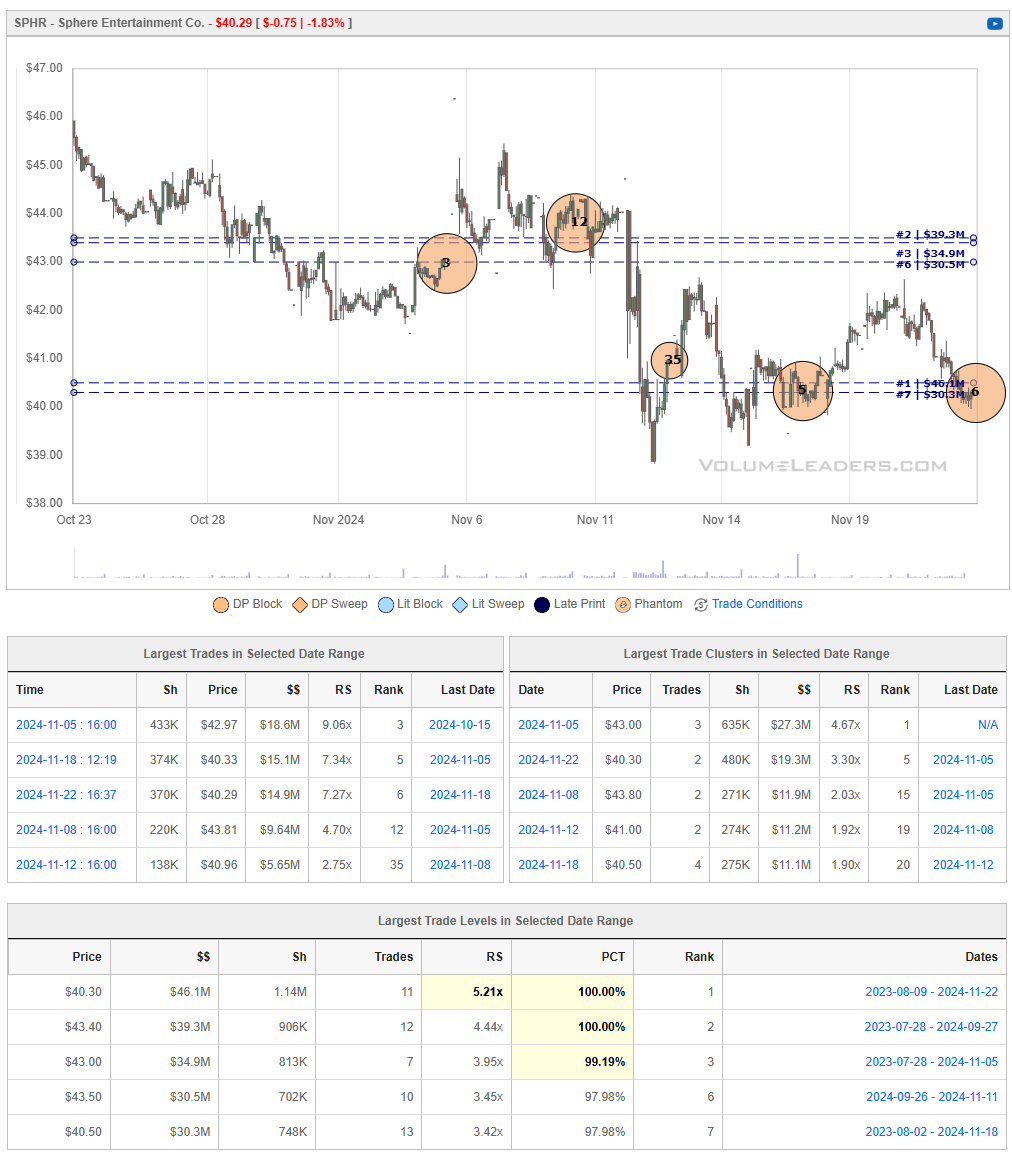
SPHR 0.00%↑
Sphere Entertainment Co. (NYSE: SPHR) is a live entertainment and media company based in New York City. The company operates through two primary segments: Sphere, which focuses on next-generation entertainment experiences, and MSG Networks, offering regional sports and entertainment content.
In its recent financial performance, Sphere Entertainment reported first-quarter revenue of $227.9 million, marking a 93.1% increase year-over-year. Despite this growth, the company posted a net loss of $105.28 million for the quarter.
Analyst opinions on SPHR are mixed. Macquarie analyst Paul Golding maintained a "Hold" rating, citing mixed results and strategic uncertainties. Conversely, JPMorgan Chase & Co. upgraded the stock to "Overweight," raising the price target from $37.00 to $57.00, indicating confidence in the company's growth prospects.
Price is sitting on a large trade-level right now. 3 of the top-10 ranked trades garnish price action in the chart below and $40 has been the YTD median price. The frequency of ranked trades since the end of Oct is notable.
Bull Thesis for Sphere Entertainment Co. (SPHR):
Innovative Entertainment Ventures: Sphere Entertainment is pioneering immersive experiences with its cutting-edge venues, such as the Sphere in Las Vegas, which has garnered significant attention and is expected to attract high-profile events and performances.
Strategic Partnerships: The company has established collaborations with renowned artists and entertainment entities, enhancing its brand visibility and potential revenue streams through exclusive events and content.
Positive Analyst Outlook: Analysts have expressed optimism about Sphere Entertainment's prospects, citing its strong operating performance and consistent cash flow as factors contributing to a robust share price.
Experienced Leadership Team: The company's management comprises seasoned professionals with extensive experience in the entertainment and media industries, positioning Sphere Entertainment for strategic growth and innovation.
Diversified Revenue Streams: Beyond live events, Sphere Entertainment is exploring opportunities in advertising, virtual reality, and other digital platforms, aiming to diversify its income sources and capitalize on emerging market trends.
Bear Thesis for Sphere Entertainment Co. (SPHR):
Financial Challenges: Sphere Entertainment reported a net loss of $2.95 per share in the latest quarter, indicating ongoing financial challenges that may impact its ability to invest in growth initiatives.
High Operational Costs: The development and maintenance of advanced venues like the Sphere require substantial capital investment, which could strain financial resources, especially if projected revenues do not materialize as expected.
Market Volatility: The stock has experienced significant volatility, with recent fluctuations influenced by market sentiment and investor expectations, which may pose risks for investors seeking stable returns.
Dependence on Event Attendance: The company's revenue is heavily reliant on the success of live events. Factors such as economic downturns, health crises, or competition from other entertainment options could adversely affect attendance and profitability.
Regulatory and Compliance Risks: Operating large-scale entertainment venues involves navigating complex regulatory environments, including safety regulations, zoning laws, and licensing requirements, which could pose operational challenges and potential legal liabilities.
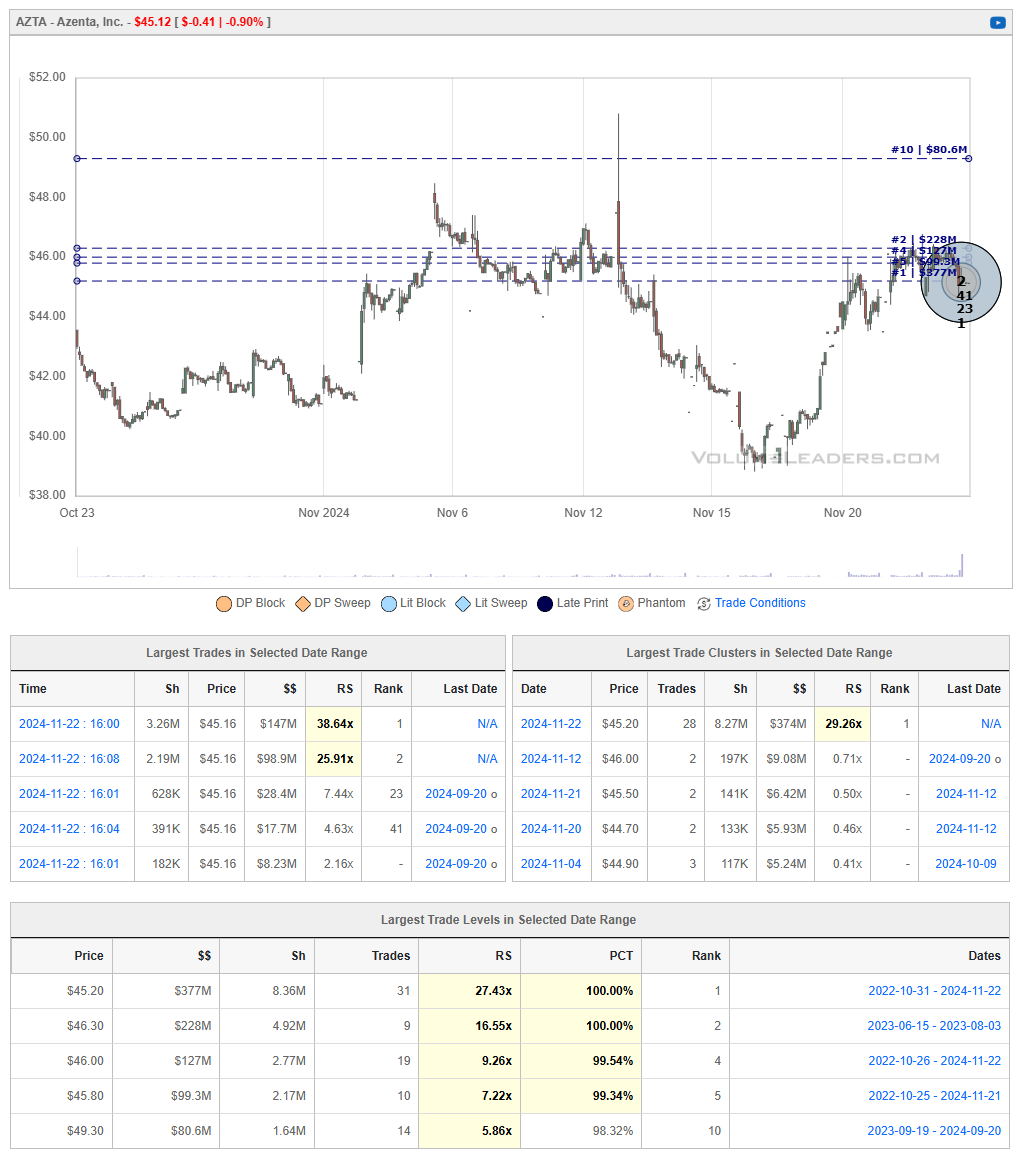
AZTA -0.35%↓
Azenta, Inc. (NASDAQ: AZTA) is a leading provider of life sciences solutions, specializing in cold-chain sample management and multiomics services for pharmaceutical, biotech, and healthcare institutions. The company offers comprehensive services that facilitate the storage, analysis, and management of biological samples, supporting advancements in drug development and clinical research.
In its recent financial performance, Azenta reported fourth-quarter and full-year results for fiscal 2024. The company achieved a 4% revenue growth in its core segments, reflecting steady progress in its primary business areas. Additionally, Azenta announced plans to divest its B Medical Systems unit, a strategic move aimed at streamlining its portfolio and focusing on its core competencies.
Leadership changes have also been a focal point for Azenta. The company appointed Lawrence Y. Lin as Chief Financial Officer, bringing extensive financial expertise to the executive team. Furthermore, Azenta expanded its board by adding three new independent directors, enhancing its governance structure and strategic oversight.
We clearly have a ton of highly concentrated activity that is easily seen by looking at the clustering of blue-dashed lines representing trade levels. In addition to that, #1-ranked and #2-ranked trades printed at the bell on Friday. This is certainly watchlist-worth as it contains key ingredients for an explosive move; watch the newswires for a “why” after price gets moving.
Bull Thesis for Azenta, Inc. (AZTA):
Strong Financial Performance: In Q4 2024, Azenta reported adjusted earnings of $0.18 per share, surpassing analysts' expectations of $0.10. This indicates effective cost management and operational efficiency.
Revenue Growth: The company achieved revenues of $146 million in the same quarter, exceeding forecasts by $3.9 million, reflecting robust demand for its products and services.
Insider Confidence: Recent insider buying activity, including significant share acquisitions by company executives, suggests strong confidence in Azenta's future prospects.
Strategic Divestitures: Azenta announced plans to sell B Medical Systems, focusing on its core competencies and potentially enhancing shareholder value through streamlined operations.
Analyst Optimism: Analysts maintain a favorable outlook on Azenta, with a consensus rating of "Buy" and a 12-month price target of $63.60, indicating potential upside from current levels.
Bear Thesis for Azenta, Inc. (AZTA):
Stock Volatility: Despite recent gains, AZTA stock has experienced significant fluctuations, with a 9.14% increase on November 20, 2024, indicating potential instability and investor uncertainty.
Market Competition: Azenta operates in a highly competitive industry, facing challenges from both established players and new entrants, which could pressure margins and market share.
Operational Risks: The company's reliance on specific market segments may expose it to risks associated with demand fluctuations and technological advancements.
Integration Challenges: Past acquisitions and divestitures may present integration challenges, potentially affecting operational efficiency and financial performance.
Economic Sensitivity: As a provider of life sciences solutions, Azenta's performance is sensitive to economic cycles and healthcare funding, which could impact revenue growth during downturns.
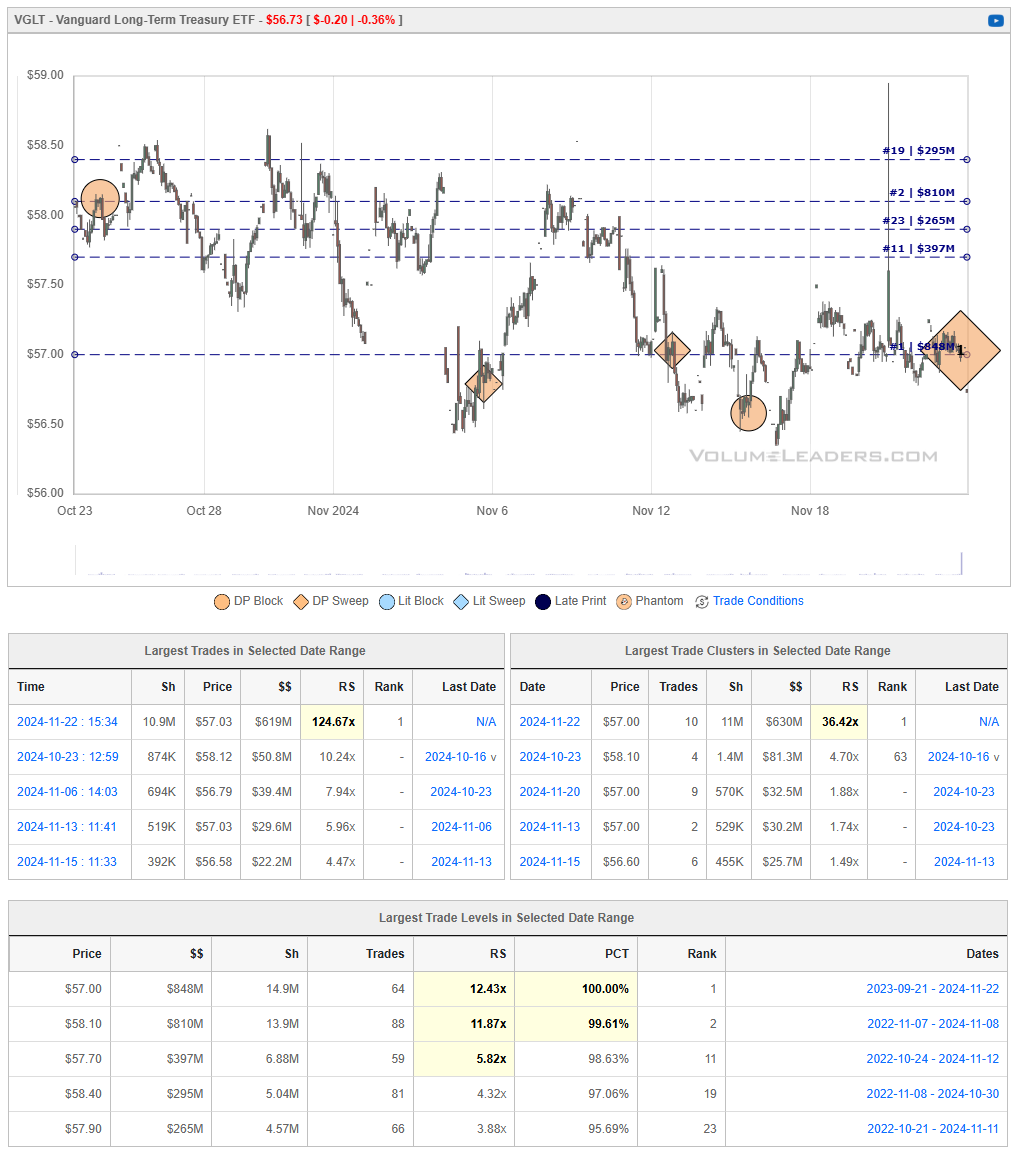
VGLT 0.00%↑
The Vanguard Long-Term Treasury ETF (VGLT) is an exchange-traded fund that seeks to track the performance of the Bloomberg U.S. Long Treasury Index. This index comprises U.S. Treasury bonds with maturities exceeding 10 years, providing investors with exposure to long-term government debt.
As of November 22, 2024, VGLT's market price was $56.75, reflecting a 0.39% decrease from the previous close. The fund's 52-week range spans from $54.96 to $63.41, indicating some volatility over the past year.
VGLT offers a dividend yield of approximately 4.10%, with a net expense ratio of 0.04%, making it a cost-effective option for investors seeking income from long-term government securities.
However, it's important to note that long-term Treasury ETFs like VGLT are sensitive to interest rate fluctuations. Rising interest rates can lead to declining bond prices, impacting the fund's performance. For instance, in April 2024, VGLT experienced pressure as investors reacted to economic growth and inflation data, highlighting the fund's susceptibility to macroeconomic factors.
Friday gifted us with a #1-ranked trade, a Dark Pool sweep at the #1 trade level that has been super active (look at the number of trades taking place there). The amount of activity culminating at this price certainly portends an imminent move and with a #1 DP sweep, it may be ready.
Bull Thesis for Vanguard Long-Term Treasury ETF (VGLT):
Attractive Yield: VGLT offers a dividend yield of approximately 4.10%, providing investors with a steady income stream.
Low Expense Ratio: With an expense ratio of 0.04%, VGLT is a cost-effective option for investors seeking exposure to long-term U.S. Treasury bonds.
High Credit Quality: The ETF invests exclusively in U.S. Treasury securities, which are considered low-risk due to government backing, appealing to risk-averse investors.
Potential for Capital Appreciation: In declining interest rate environments, long-term bonds like those in VGLT can experience price appreciation, benefiting investors.
Diversification Benefits: Including VGLT in a portfolio can provide diversification, as long-term Treasury bonds often have low correlation with equities, potentially reducing overall portfolio volatility.
Bear Thesis for Vanguard Long-Term Treasury ETF (VGLT):
Interest Rate Sensitivity: VGLT has a high duration, making it sensitive to interest rate increases, which can lead to significant price declines.
Recent Performance Decline: The ETF has experienced a 6.7% decline in 2024, reflecting challenges in the current interest rate environment.
Inflation Risk: Long-term bonds are susceptible to inflation, which can erode real returns over time, impacting investor purchasing power.
Opportunity Cost: Investing in VGLT may result in missed opportunities in higher-yielding or better-performing asset classes, especially during periods of rising interest rates.
Market Volatility: The ETF has experienced fluctuations, with a recent dip of over 3% following the Q3 earnings call, indicating sensitivity to market sentiment and investor expectations.
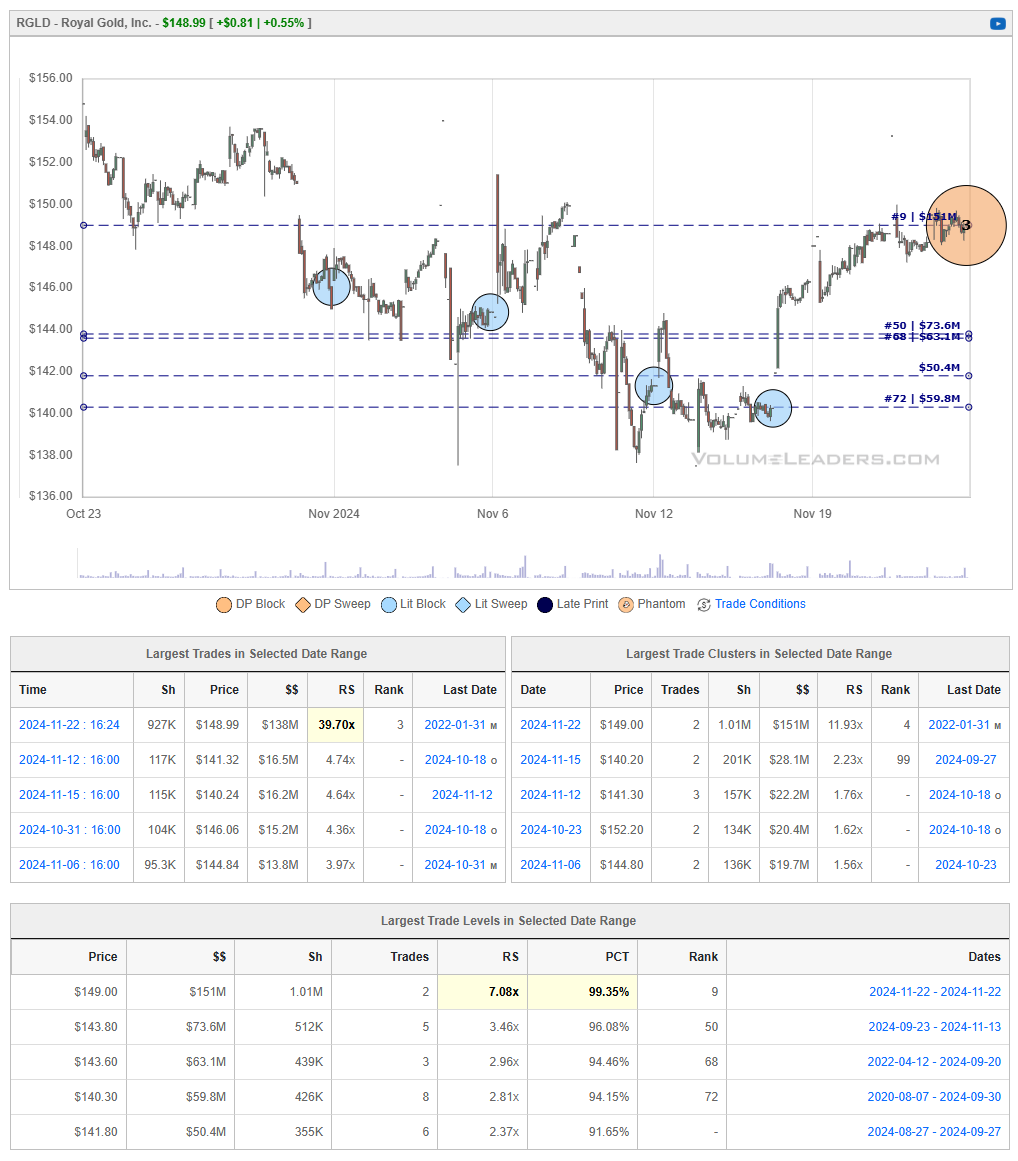
RGLD 0.00%↑
Royal Gold, Inc. (NASDAQ: RGLD) is a leading precious metals streaming and royalty company based in Denver, Colorado. Established in 1981, the company specializes in acquiring and managing precious metal streams, royalties, and similar production-based interests. This business model provides investors with exposure to precious metals without the operational risks associated with traditional mining companies.
In its recent financial performance, Royal Gold reported record revenue of $193.8 million for the third quarter of 2024, marking a significant increase from previous periods. The company also achieved a debt-free balance sheet, underscoring its strong financial health. Additionally, Royal Gold announced a 12.5% increase in its quarterly dividend to $0.45 per share, reflecting its commitment to returning value to shareholders.
Analysts have responded positively to these developments. Scotiabank raised its price target for Royal Gold to $166 from $157, indicating confidence in the company's growth prospects. Furthermore, the company's stock has shown resilience, with a 52-week range between $100.55 and $155.10, and a recent closing price of $147.89 as of November 19, 2024.
On Friday we got a #3-ranked trade that firmed-up the now-#1-ranked trade-level. Institutions are getting business done at this level. Short-term chart and recent news are supporting constructive price action but take a look at the bull & bear theses before you leap.
Bull Thesis for Royal Gold, Inc. (RGLD):
Record Financial Performance: In Q3 2024, Royal Gold reported revenues of $193.8 million, a 42% increase from the same period in 2023, achieving record revenue and a debt-free balance sheet.
Dividend Increase: The company announced a 12.5% increase in its quarterly dividend to $0.45 per share, marking the 24th consecutive annual increase, reflecting strong cash flow and a commitment to returning value to shareholders.
Analyst Upgrades: Analysts have raised their price targets for Royal Gold, with Scotiabank increasing it to $166 from $157, indicating confidence in the company's growth prospects.
Strong Governance: Royal Gold has strengthened its governance by extending employment agreements for key executives and amending its bylaws to enhance transparency, demonstrating a commitment to effective leadership and shareholder engagement.
Diversified Portfolio: The company's portfolio includes royalty and streaming interests in over 180 properties across various geographies and commodities, reducing risk and providing multiple revenue streams.
Bear Thesis for Royal Gold, Inc. (RGLD):
Insider Selling: Mutual of America Capital Management LLC decreased its position in Royal Gold by 5.6% during the third quarter, selling 2,104 shares, which may indicate concerns about future performance.
Market Volatility: The stock has experienced fluctuations, with a recent dip of over 3% following the Q3 earnings call, indicating sensitivity to market sentiment and investor expectations.
Commodity Price Dependence: As a royalty and streaming company, Royal Gold's revenue is closely tied to commodity prices, particularly gold and silver, which can be volatile and subject to global economic conditions.
Operational Risks: The company faces potential challenges such as geopolitical risks in operating regions, regulatory changes, and environmental concerns that could impact operations and profitability.
Valuation Concerns: Despite strong financial performance, some analysts caution that the stock's current valuation may be high relative to peers, potentially limiting upside potential.
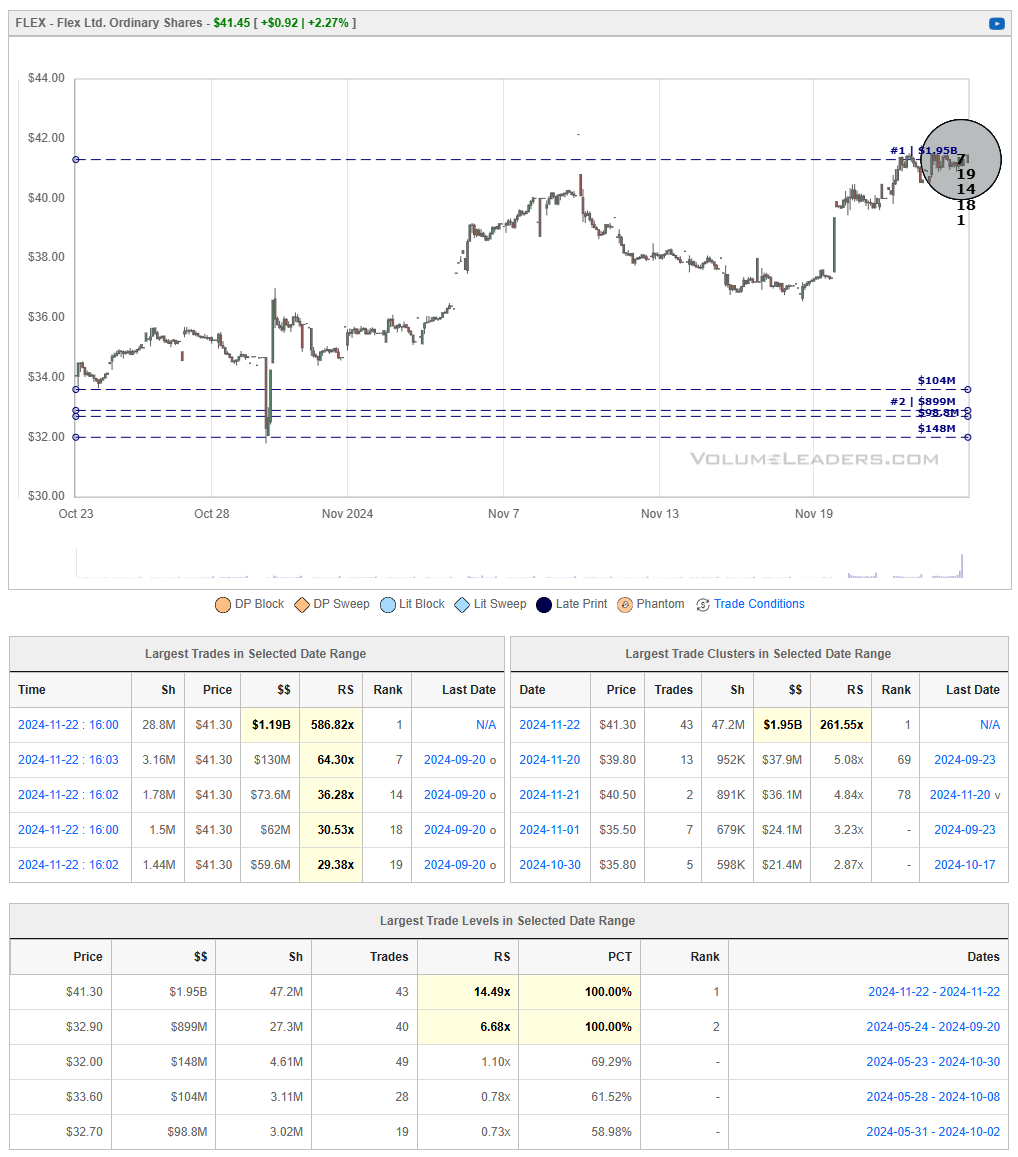
FLEX 0.00%↑
Flex Ltd. (NASDAQ: FLEX) is a global leader in electronics manufacturing services (EMS) and original design manufacturing (ODM). Founded in 1969 and headquartered in Austin, Texas, the company operates in over 30 countries, employing approximately 172,000 individuals. Flex collaborates with a diverse range of industries, including automotive, healthcare, consumer electronics, and industrial, providing comprehensive design, engineering, and manufacturing solutions.
In recent developments, Flex reported robust financial performance for the second quarter of fiscal year 2025, ending September 27, 2024. The company achieved net sales of $6.5 billion and adjusted earnings per share of $0.64, surpassing analyst expectations of $0.56. This strong performance led Flex to raise its full-year earnings guidance, reflecting confidence in its operational execution and market demand.
Additionally, Flex announced the appointment of Kevin S. Krumm as Chief Financial Officer, effective January 6, 2025. Krumm brings over two decades of financial leadership experience, most recently serving as Executive Vice President and CFO of APi Group Corp. He will succeed interim CFO Jaime Martinez, who will assist during the transition. This strategic leadership change underscores Flex's commitment to enhancing shareholder value and sustaining long-term financial success.
On Friday, we got a boat-load of top-ranked activity - $41.30 clearly means something to someone so if you’re involved or planning to get involved, this is the price to watch.
Bull Thesis for Flex Ltd. (FLEX):
Strong Financial Performance: In Q2 FY2025, Flex reported net sales of $6.5 billion, reflecting robust demand across its diverse customer base.
Strategic Acquisitions: The company completed the acquisition of Crown Technical Systems, enhancing its capabilities in custom-engineered power distribution and protection systems, which is synergistic with its data center power solutions.
Leadership Strengthening: Flex appointed Kevin S. Krumm as Chief Financial Officer, effective January 6, 2025. Krumm brings over two decades of experience, including roles at APi Group Corp. and Ecolab Inc., which is expected to bolster the company's financial strategy.
Recognition in ESG: The company received Cisco's 2024 Excellence in ESG (Environmental, Social, and Governance) award, highlighting its commitment to sustainable and responsible operations.
Positive Analyst Outlook: Analysts maintain a favorable outlook on Flex, with a consensus rating of "Strong Buy" and a 12-month price target of $40.83, indicating potential upside from current levels.
Bear Thesis for Flex Ltd. (FLEX):
Stock Volatility: Despite recent gains, FLEX stock has experienced fluctuations, with a 1.17% decline on November 15, 2024, indicating potential instability and investor uncertainty.
Market Competition: Flex operates in a highly competitive industry, facing challenges from both established players and new entrants, which could pressure margins and market share.
Operational Risks: The company's reliance on specific market segments may expose it to risks associated with demand fluctuations and technological advancements.
Integration Challenges: Past acquisitions and divestitures may present integration challenges, potentially affecting operational efficiency and financial performance.
Economic Sensitivity: As a provider of manufacturing solutions, Flex's performance is sensitive to economic cycles and global supply chain disruptions, which could impact revenue growth during downturns.
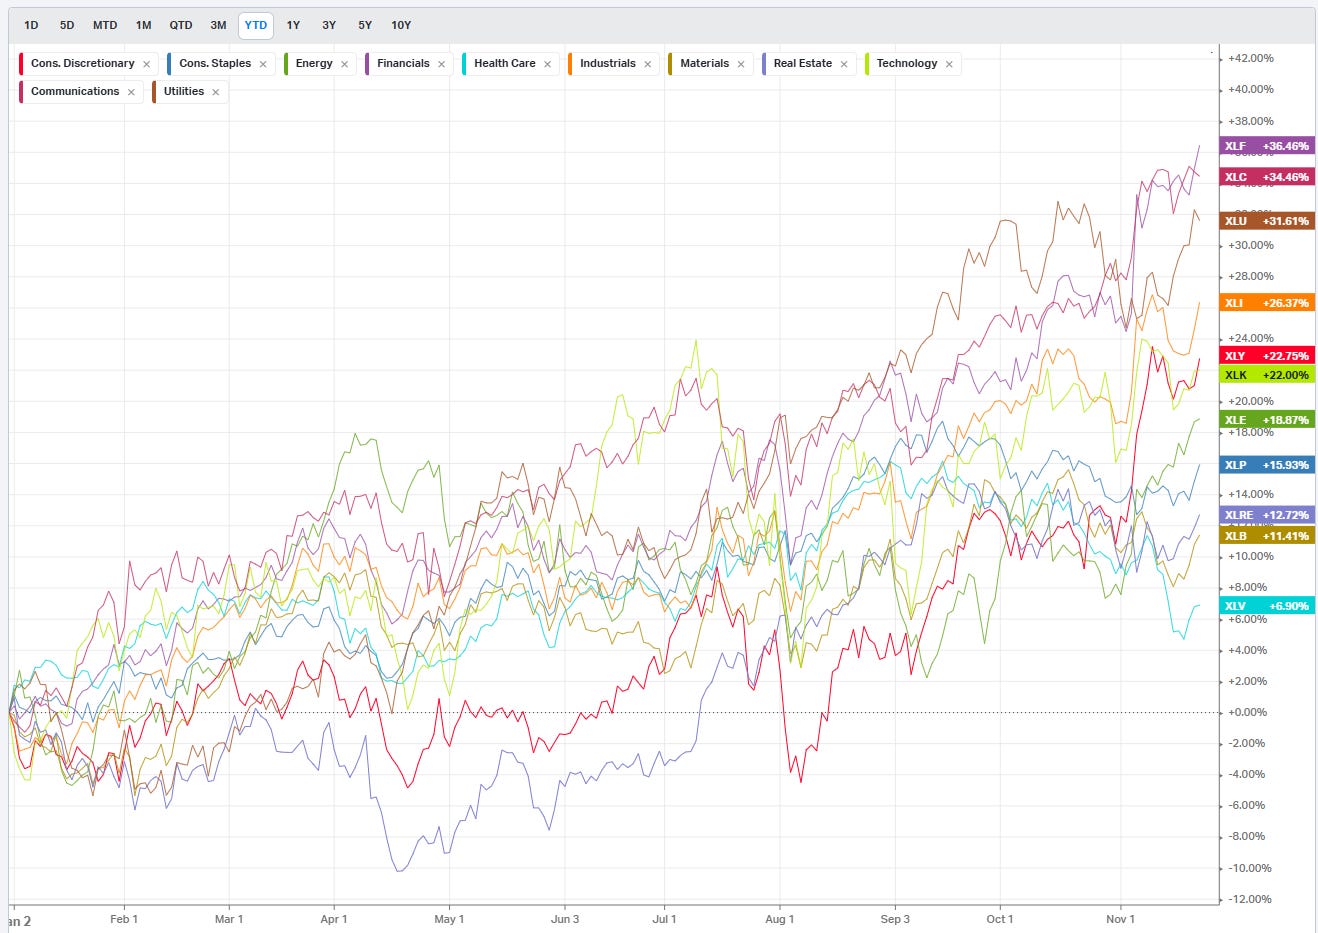
Summary Of Thematic Performance YTD
VolumeLeaders.com provides a lot of pre-built filters for thematics so that you can quickly dive into specific areas of the market. These performance overviews are provided here only for inspiration. Consider targeting leaders and/or laggards in the best and worst sectors, for example.
S&P By Sector
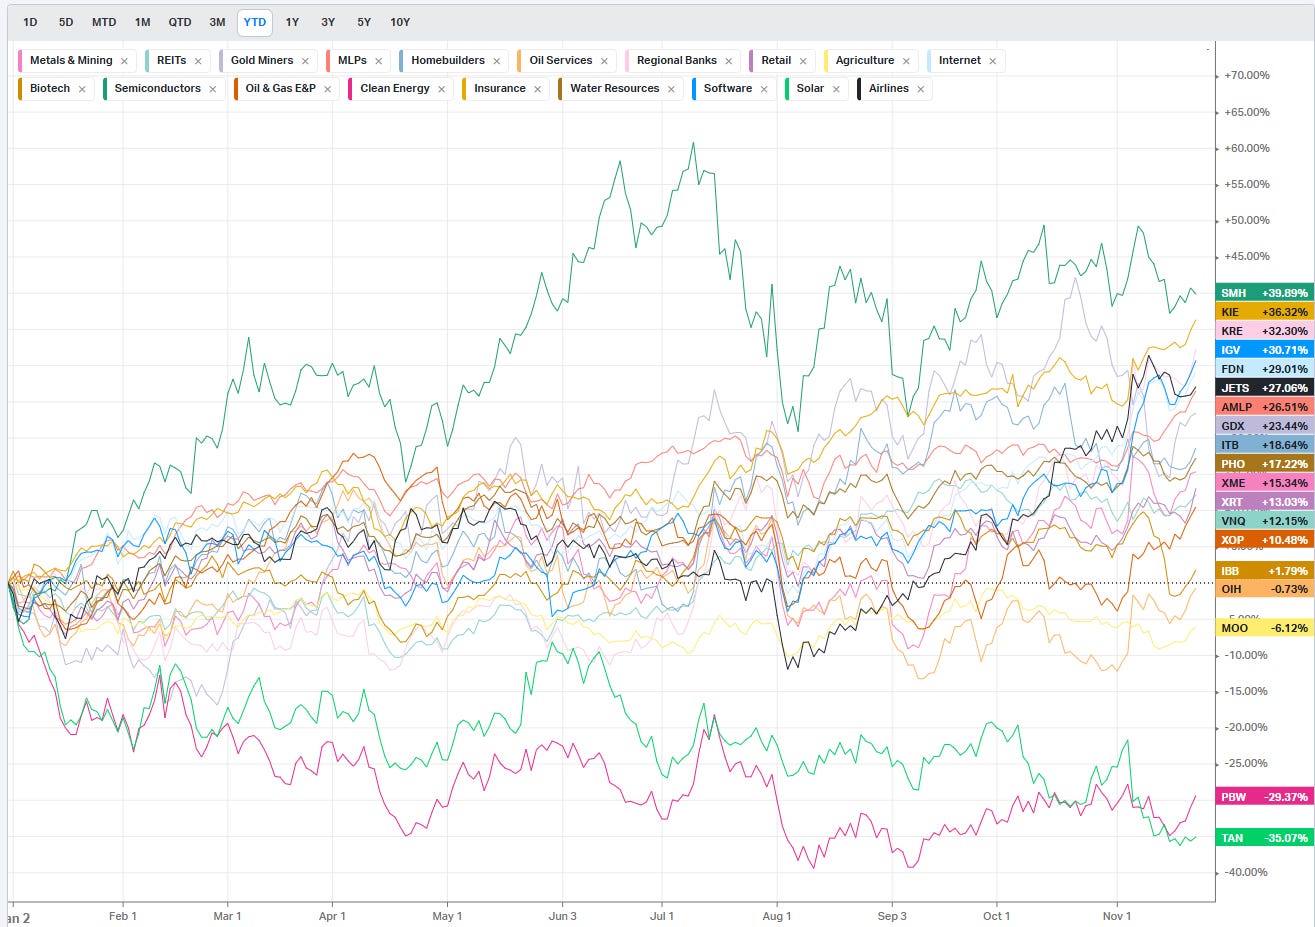
S&P By Industry
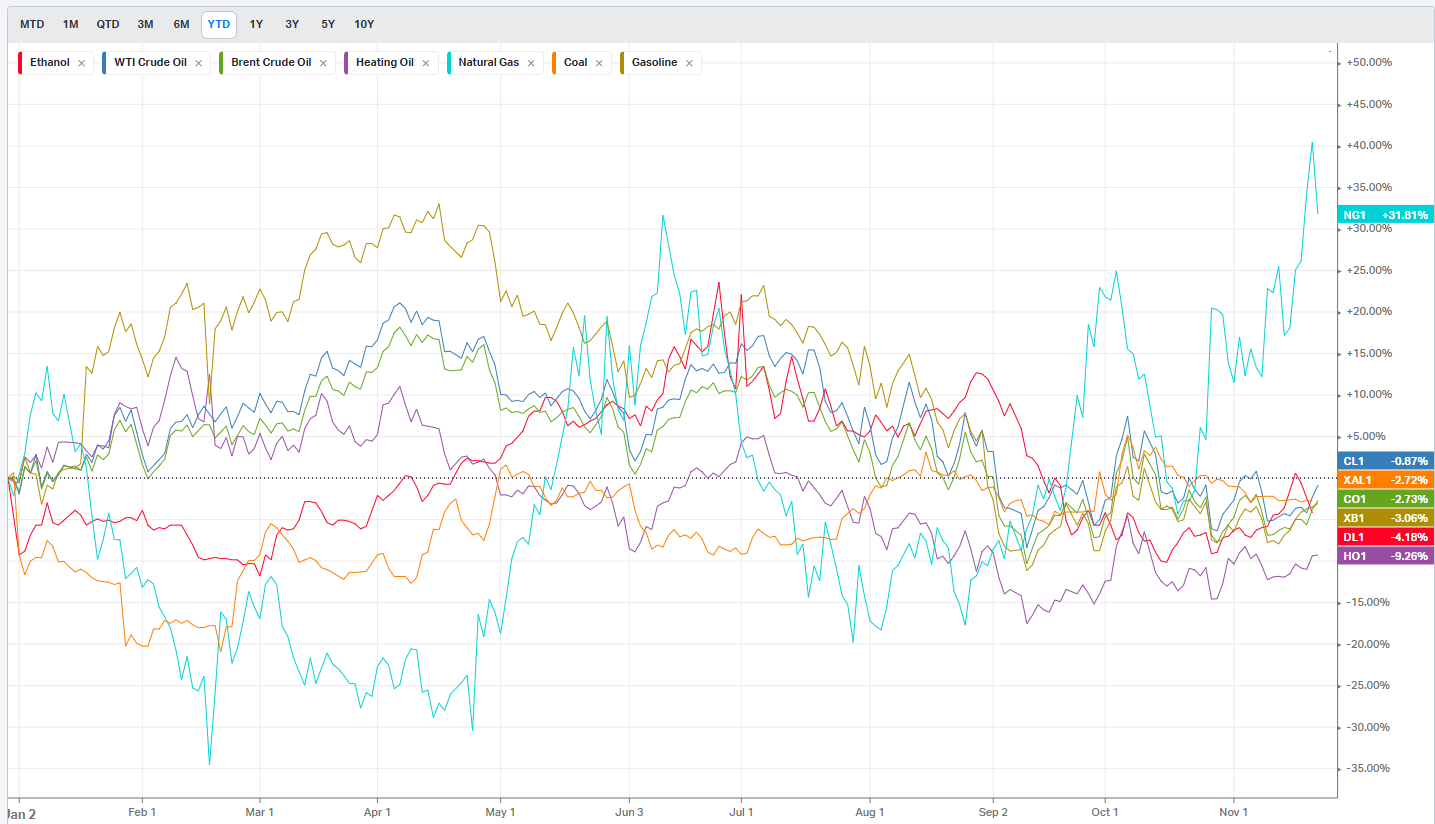
Commodities: Energy
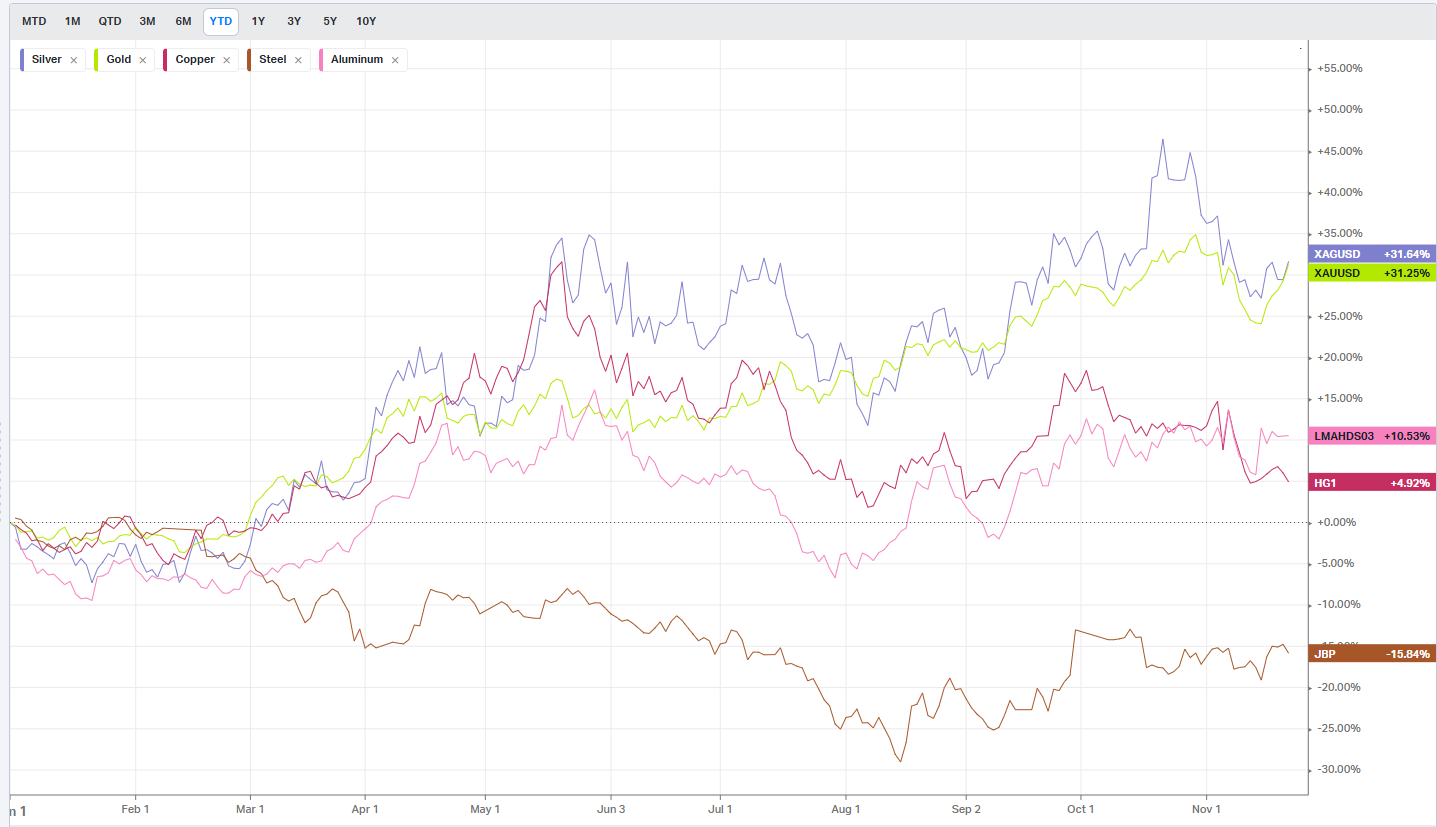
Commodities: Metals
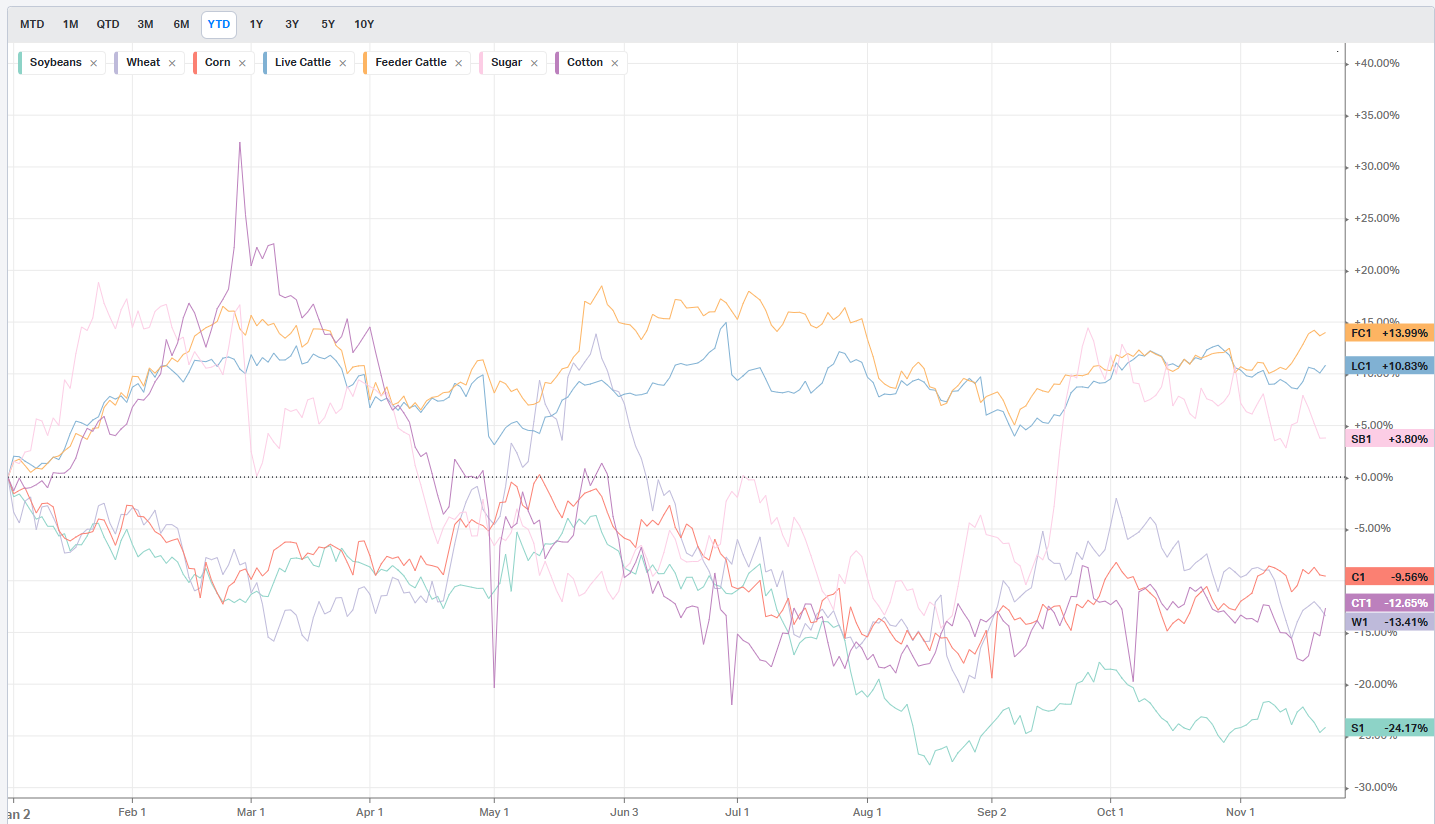
Commodities: Agriculture
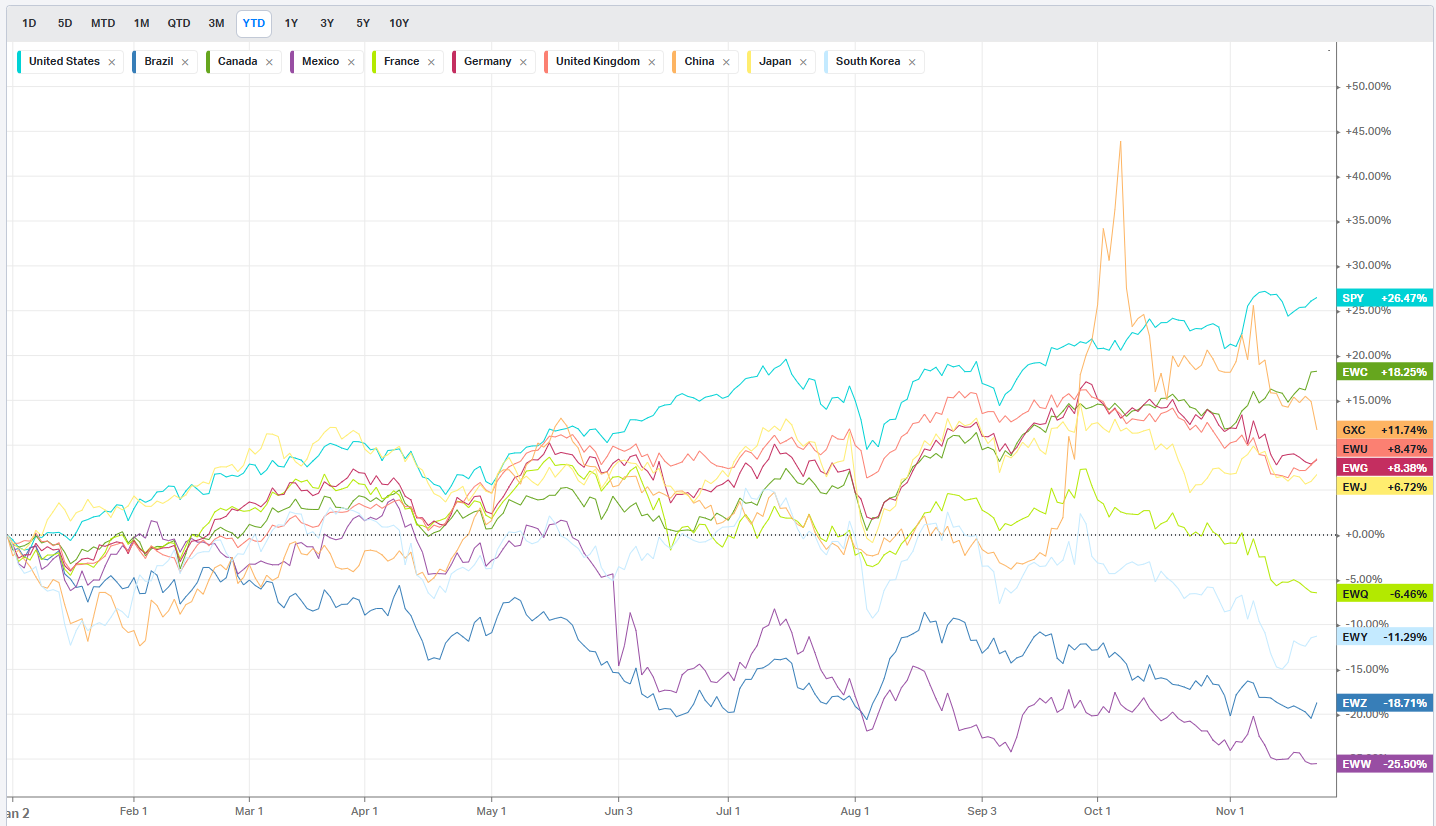
Country ETFs
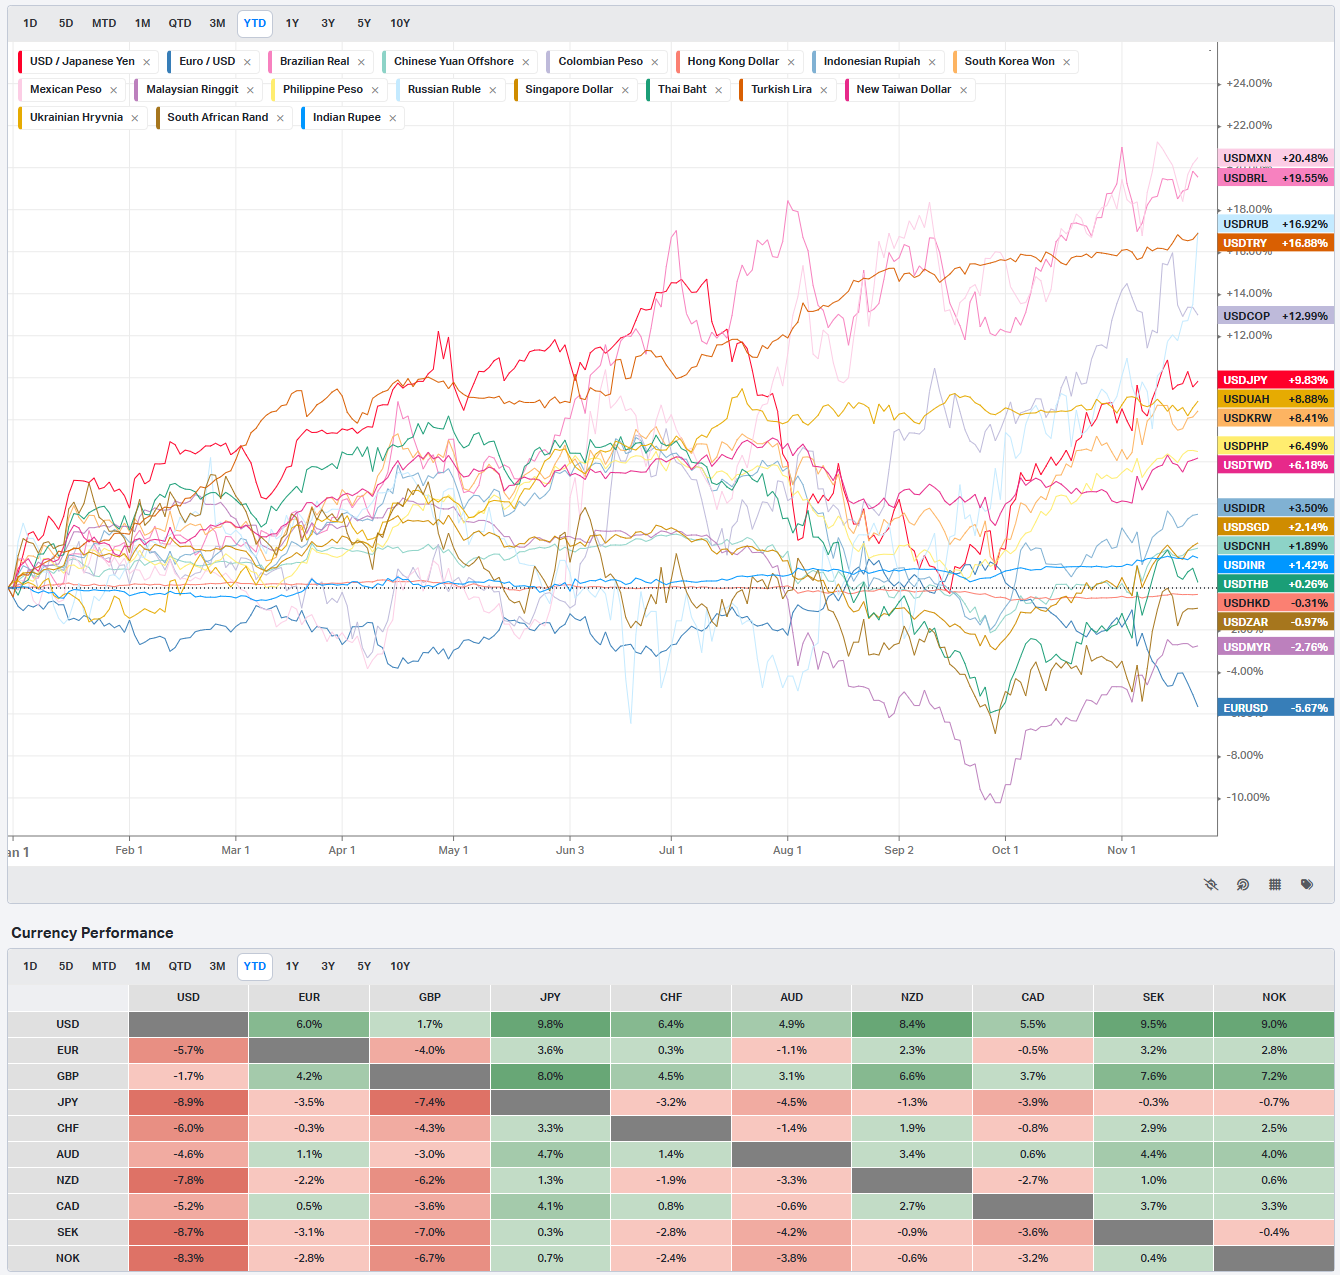
Currencies
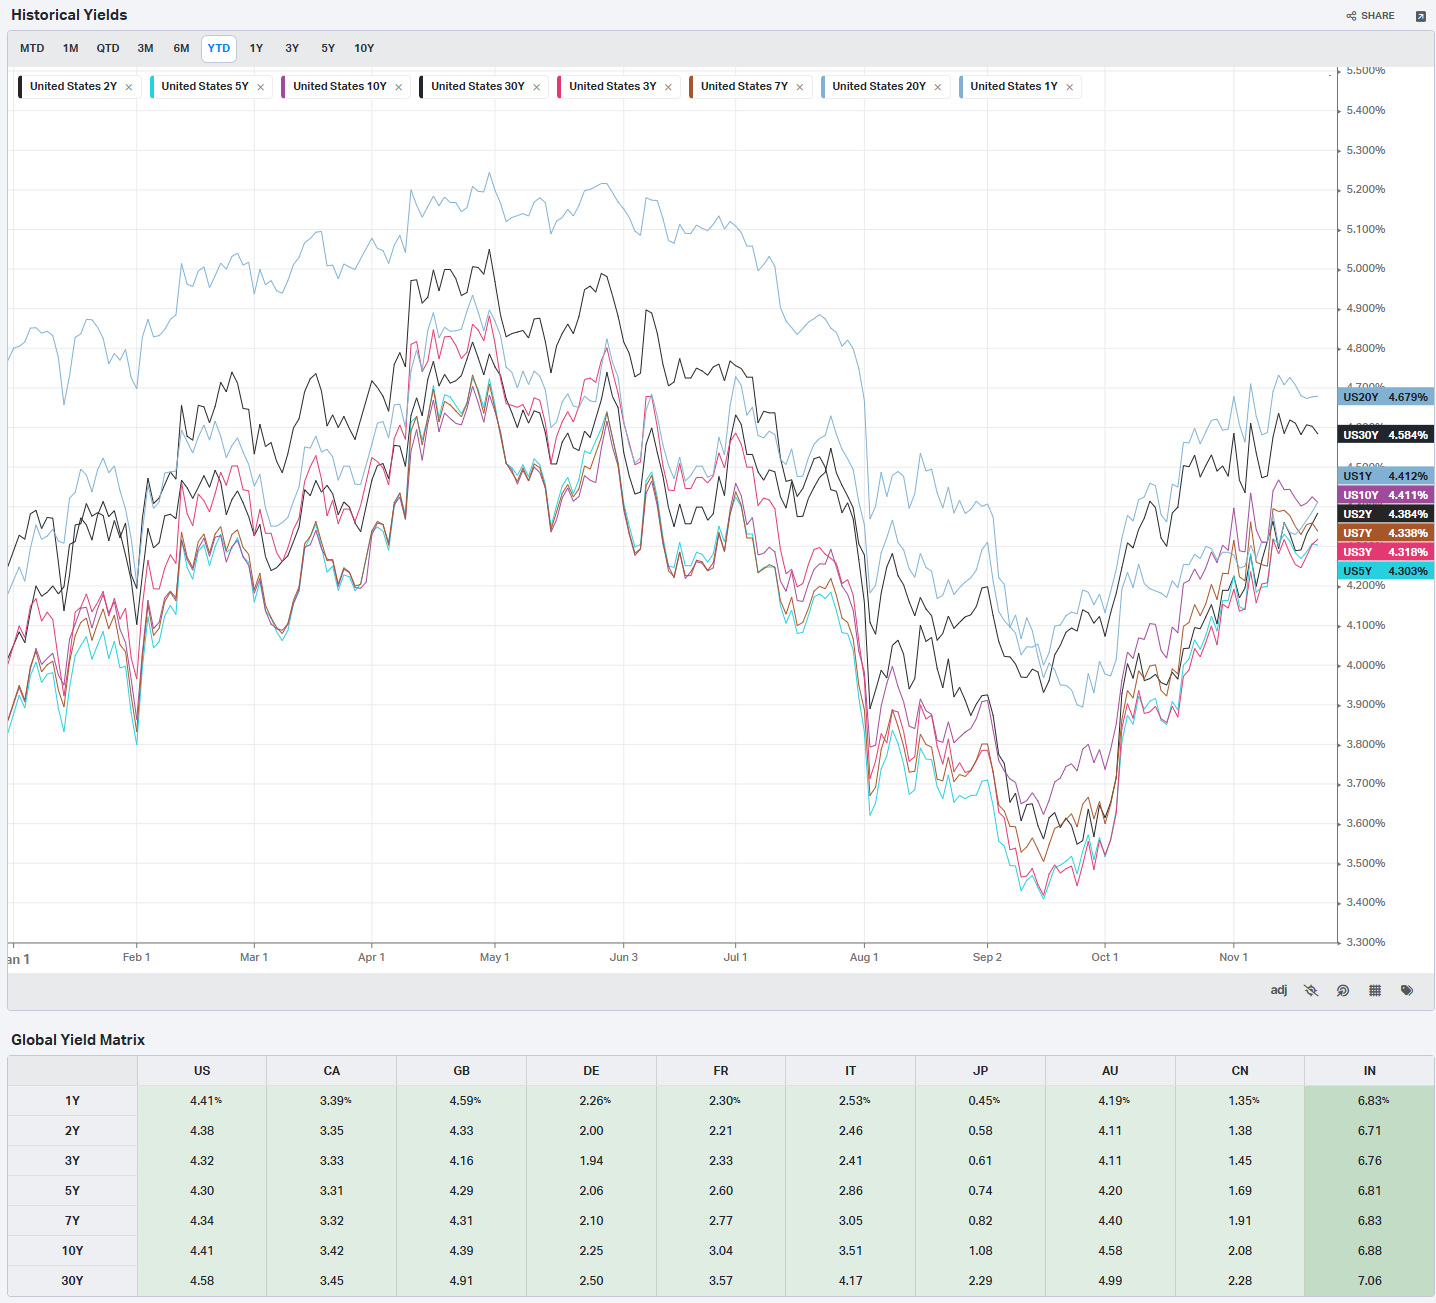
Global Yields
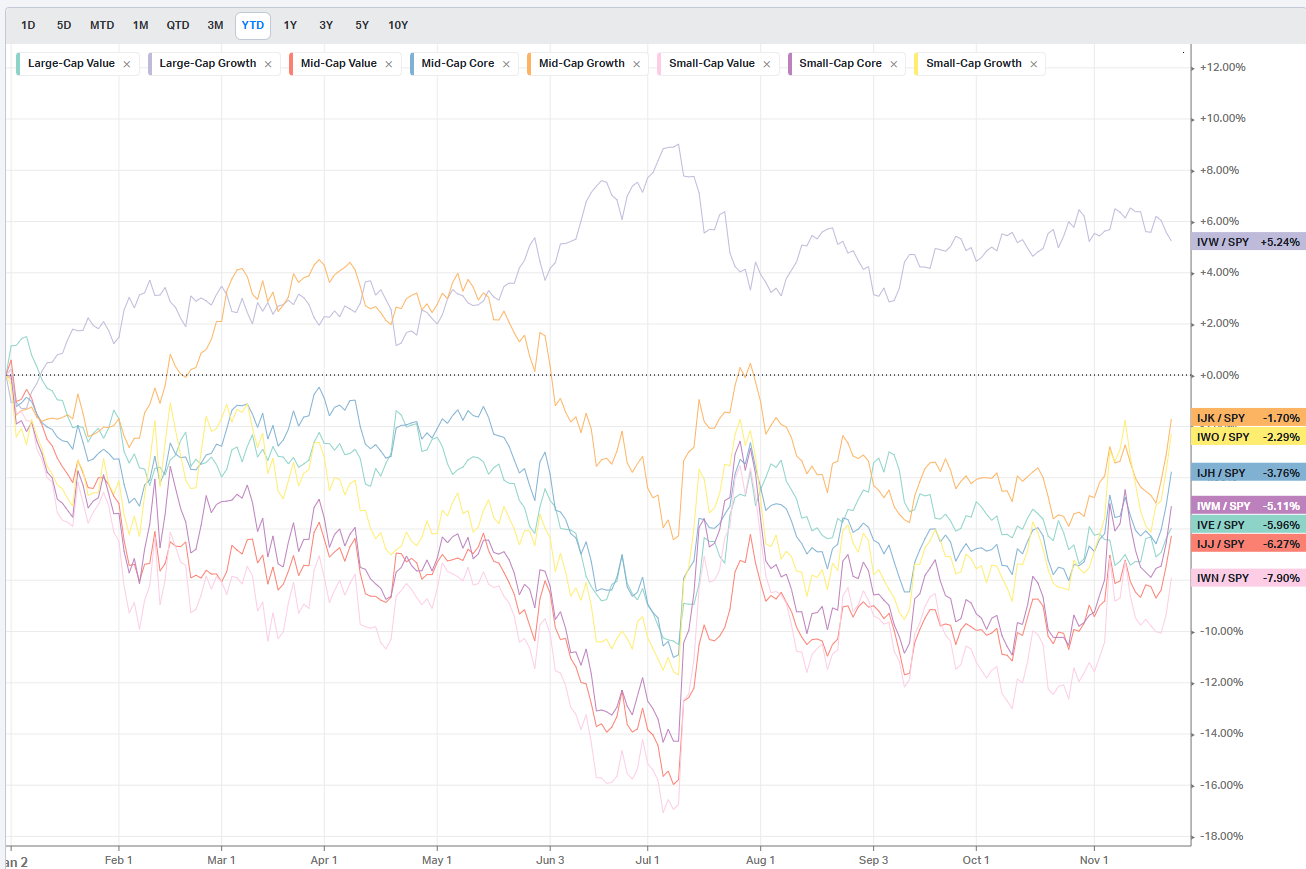
Factors: Size vs Value
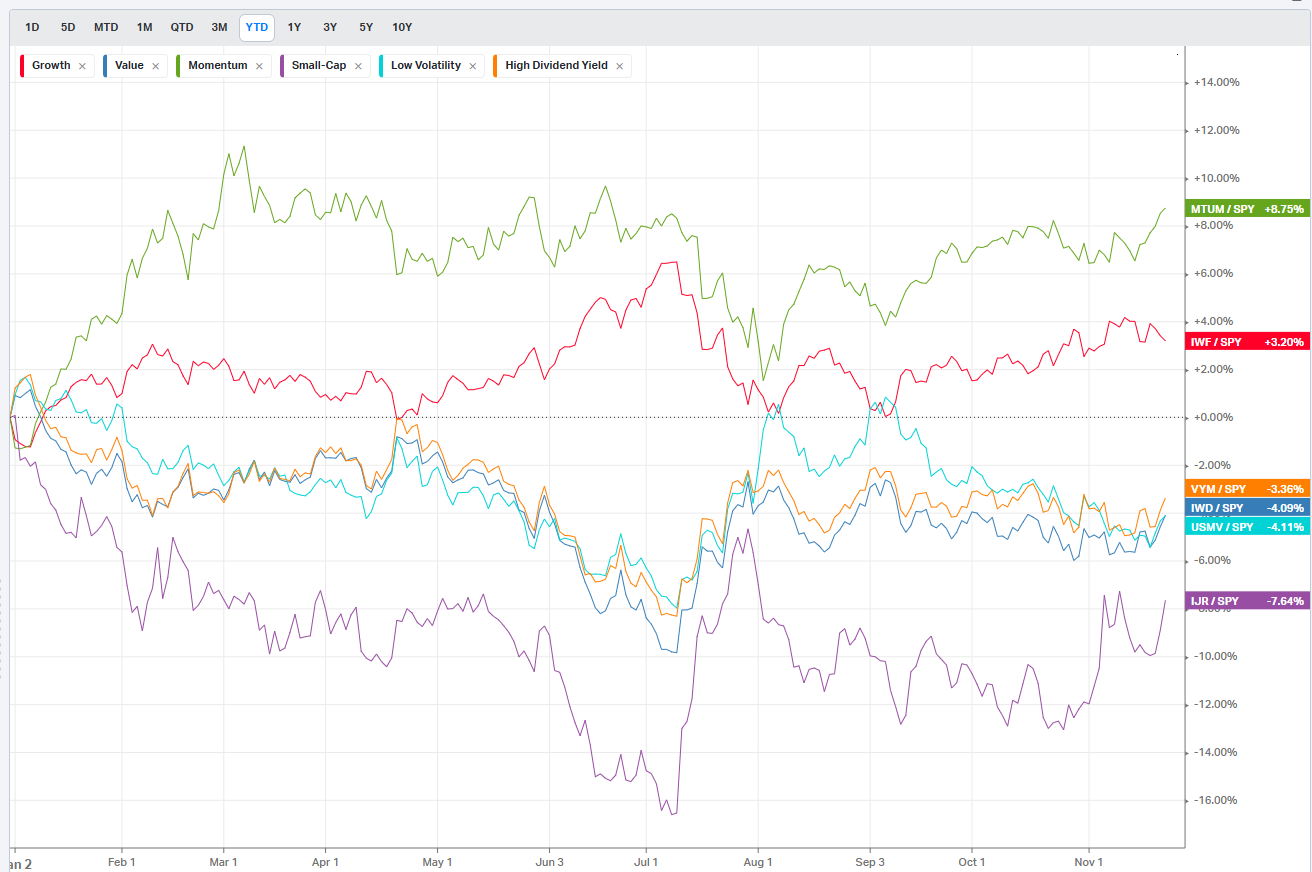
Factors: Style
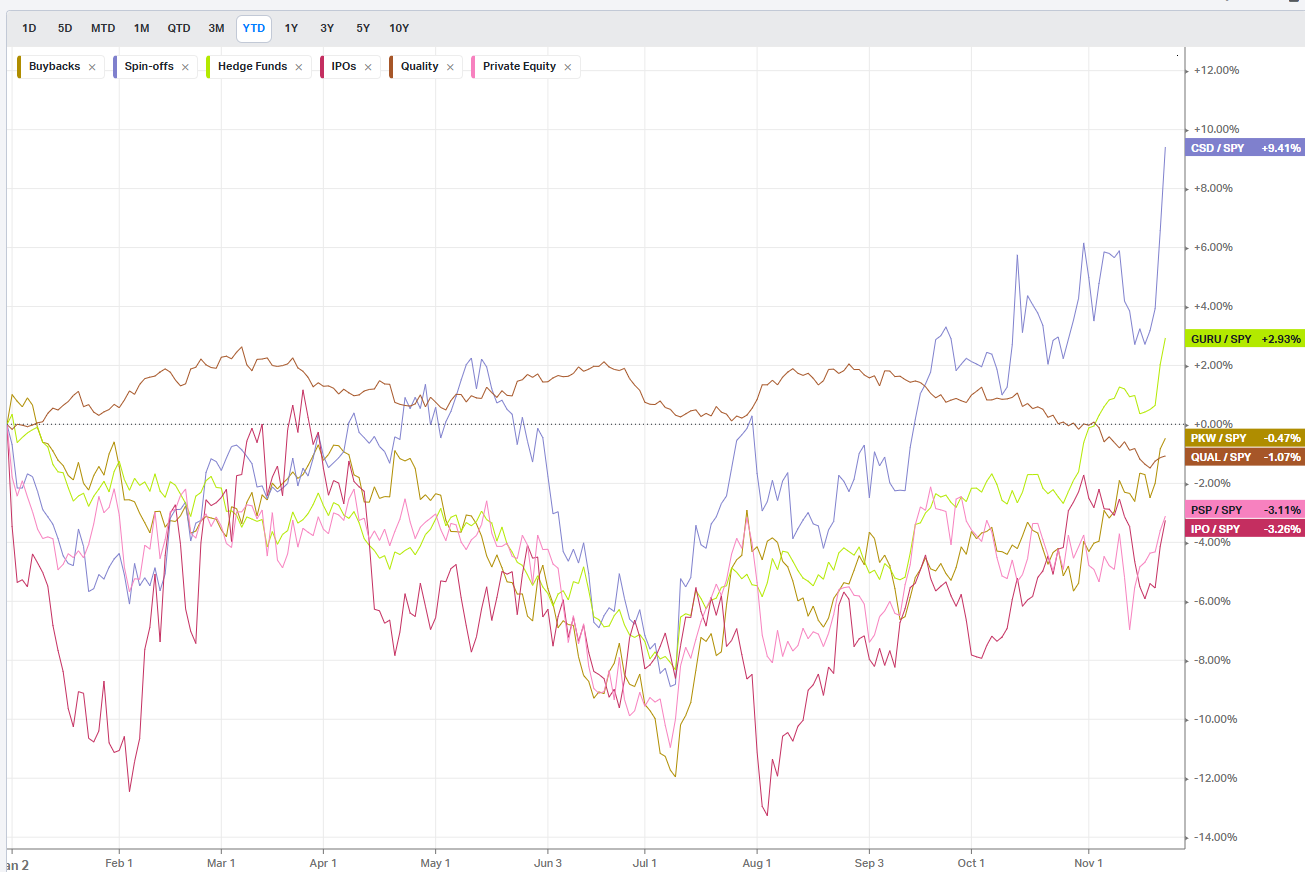
Factors: Qualitative
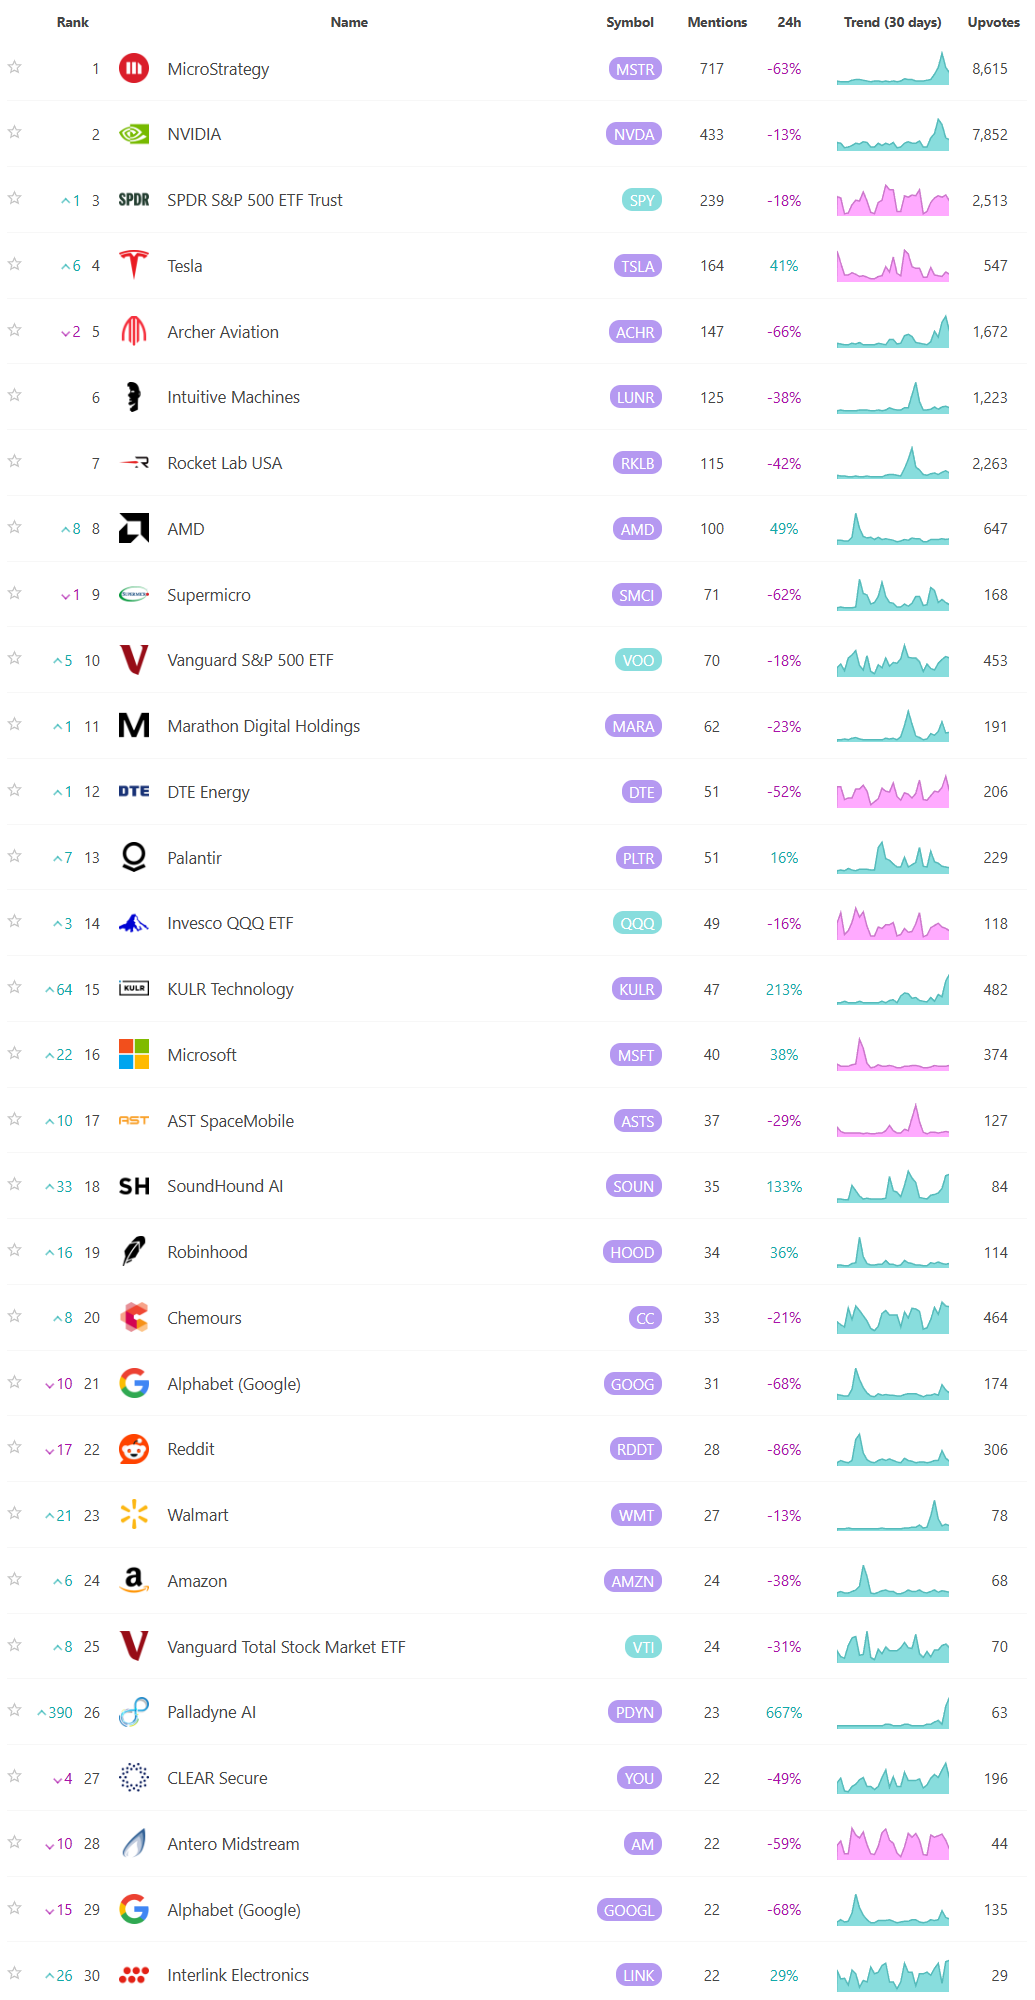
Social Media Favs
Analyzing social sentiment can provide valuable insights for investment strategies by offering a pulse on public perception, mood, and market sentiment that traditional financial indicators might not capture. Here’s how social sentiment analysis can enhance investment decisions:
Market Momentum: Positive or negative social sentiment can signal impending momentum shifts. When public opinion on a stock, sector, or asset class changes sharply, it can create buying or selling pressure, especially if that sentiment becomes widespread.
Early Detection of Trends: Social sentiment data can help investors spot trends before they show up in technical or fundamental data. For example, increased positive chatter around a particular company or sector might indicate growing interest or excitement, which could lead to price appreciation.
Gauge Retail Investor Impact: With the rise of retail investor platforms, collective sentiment on social media can lead to significant price movements (e.g., meme stocks). Understanding how retail investors view certain stocks can help in identifying high-volatility opportunities.
Event Reaction Monitoring: Social sentiment can provide real-time reactions to news events, product releases, or earnings reports. Investors can use this information to gauge market reaction quickly and adjust their strategies accordingly.
Complementing Quantitative Models: By adding a social sentiment layer to quantitative models, investors can enhance predictions. For example, a model that tracks historical price and volume data might perform even better when factoring in sentiment trends as a measure of market psychology.
Risk Management: Negative sentiment spikes can be a signal of potential downturns or increased volatility. By monitoring sentiment, investors might avoid or hedge against investments in companies experiencing a public relations crisis or facing negative perceptions.
Long-Term Sentiment Trends: Sustained sentiment trends, whether positive or negative, often mirror longer-term market cycles. Tracking sentiment trends over time can help identify shifts in investor psychology that could affect longer-term investments or sector rotations.
For these reasons, sentiment analysis, when combined with other tools, can provide a comprehensive view of both immediate market reactions and underlying investor attitudes, helping investors position themselves strategically across various time frames. Here are the most mentioned/discussed tickers on Reddit from some of the most active Subreddits for trading:
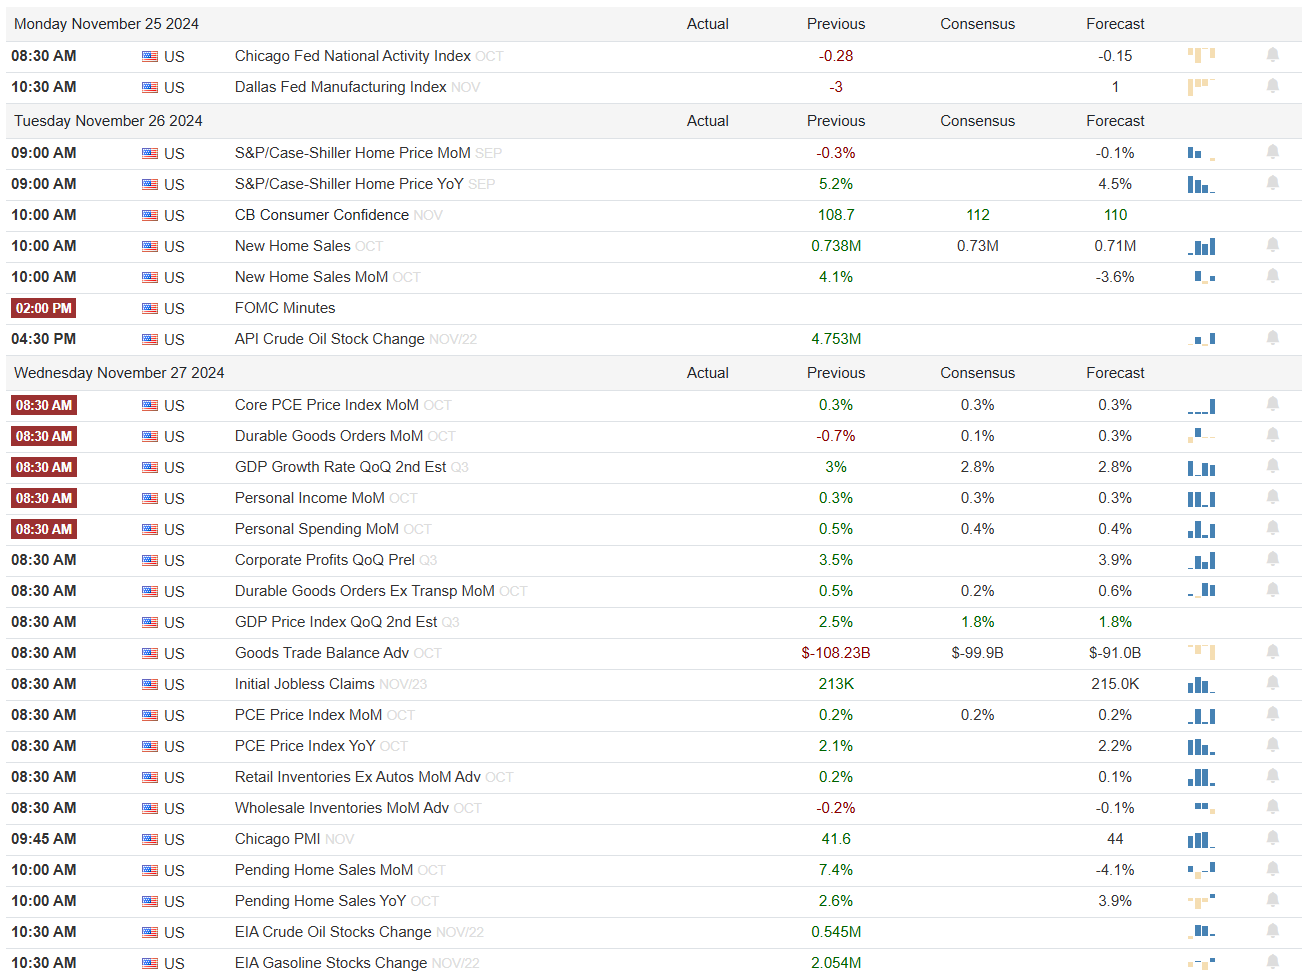
Events On Deck This Week
Here are key events happening this week that have the potential to cause outsized moves in the market or heightened short-term volatility.
Econ Events By Day of Week
Anticipated Earnings By Day of Week

Thank you for being part of our community and for taking the time to read this publication. Your engagement and insights mean a great deal to all of us, and we're genuinely grateful to share this space with such dedicated and thoughtful readers. Wishing you a productive and successful week ahead in the markets. May the coming days bring clarity and great opportunities. Happy trading!