Market Momentum: Your Weekly Financial Forecast
Issue 13 / What to expect Sept 16, 2024 thru Sept 20, 2024

Weekly Wrap-Up
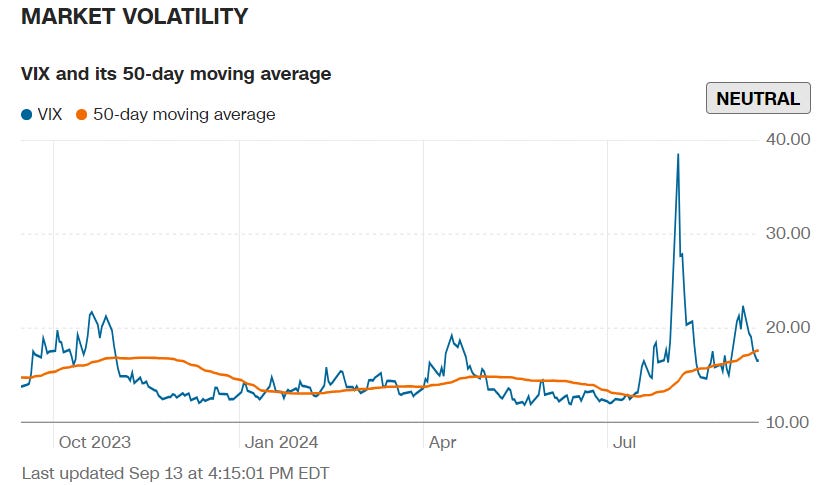
Market Volatility & General Sentiment: This week saw increased market swings, characterized by periods of notable pullbacks followed by strong rebounds. This was primarily driven by inflation data and expectations of upcoming Federal Reserve interest rate cuts. Despite the volatility, the broader stock market is still near all-time highs, suggesting a resilient underlying market sentiment.


Investors remained cautious due to persistent inflation, and this week's CPI data, while signaling some progress, suggested that the inflation fight isn’t over yet, particularly due to rising shelter costs. Core inflation remained stable at 3.2%, which is still above the Fed's 2% target.


Inflation Data and the Fed's Rate Decisions:
The inflation report showed modest progress, with prices rising 0.5% month-over-month due to rising shelter costs. However, prices for other key categories, such as used vehicles and medical care, showed improvement.
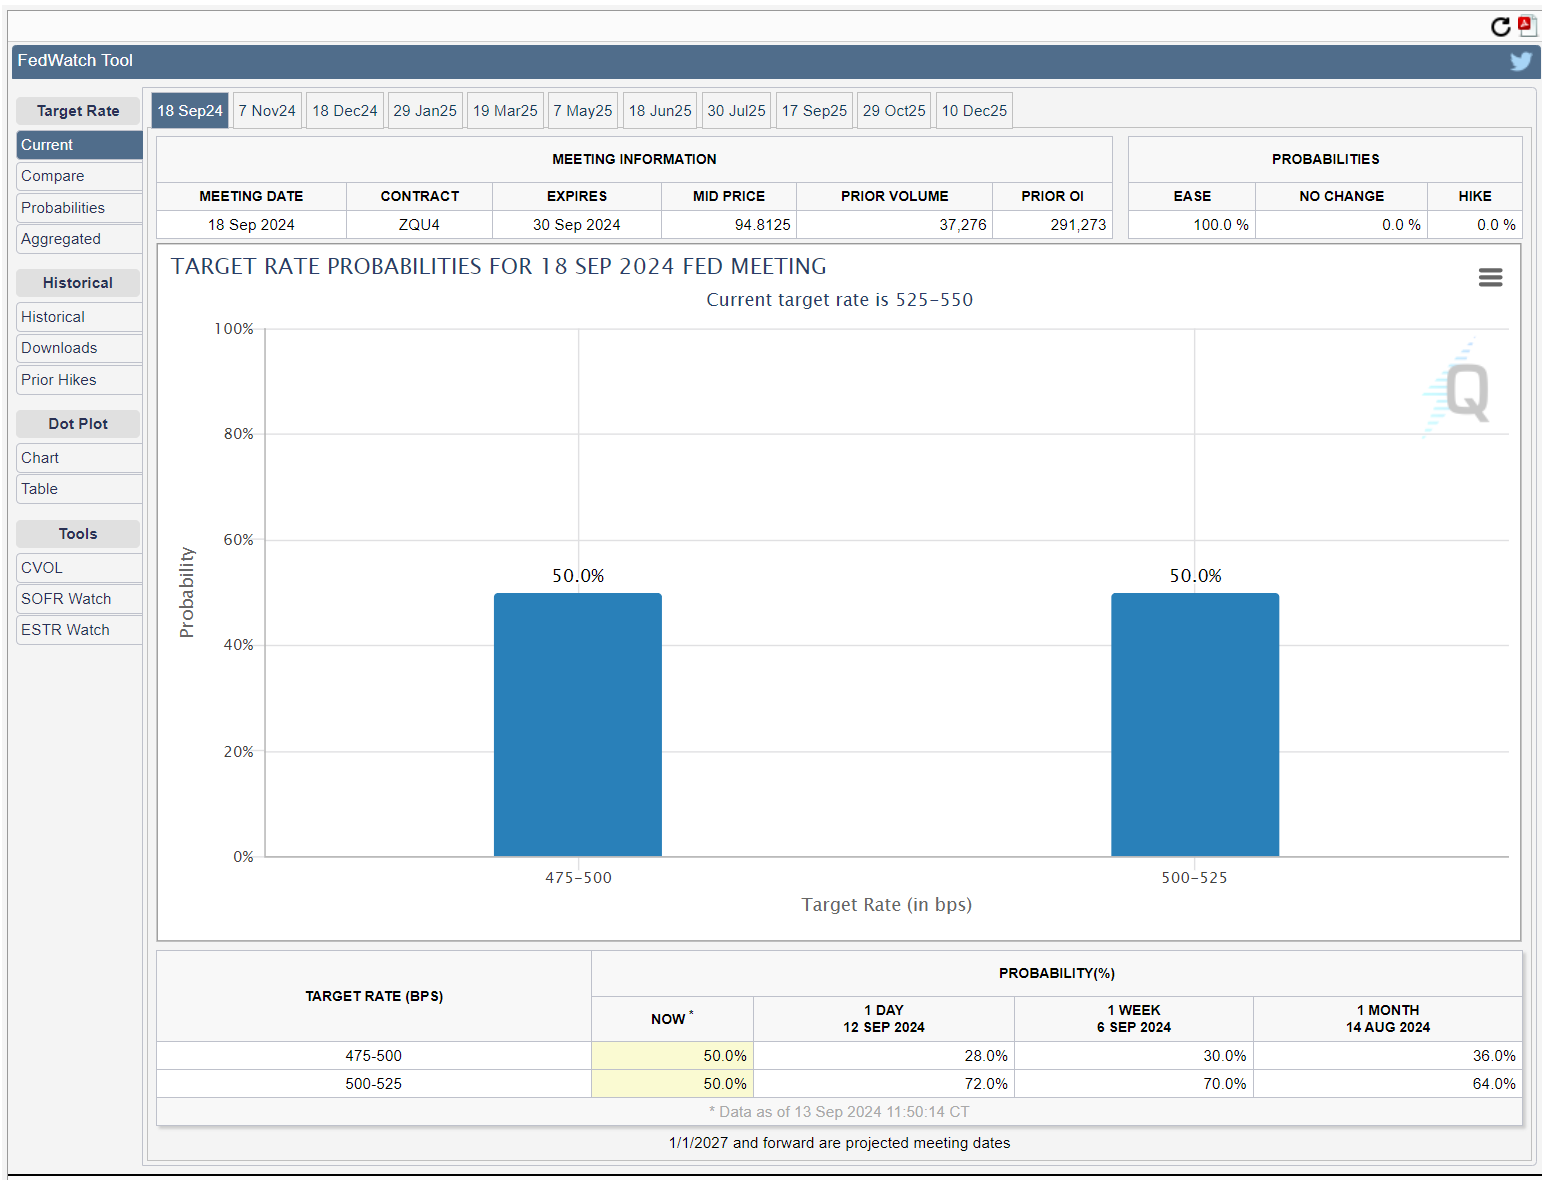
This data reduced expectations of a larger rate cut by the Federal Reserve, which was previously anticipated at 50 basis points. Markets are now more aligned with the view that the Fed will likely cut rates by 25 basis points during its meeting next week.


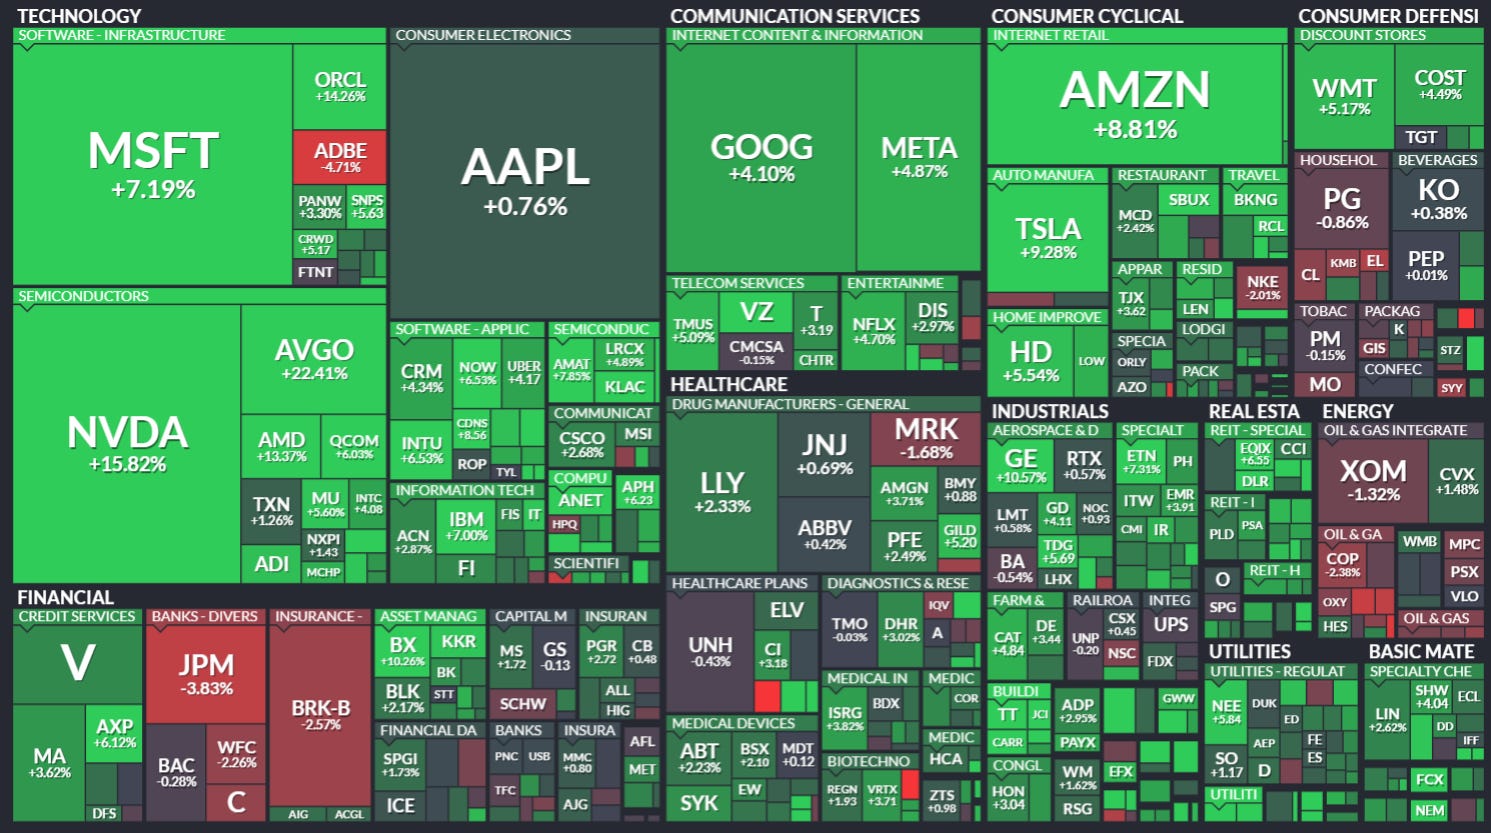
Sector Performance:
Information Technology was the standout sector, rebounding sharply by 7% this week, driven by renewed enthusiasm for AI and semiconductors. The PHLX Semiconductor Index soared 10%, fueled by positive comments from Nvidia's CEO and strong earnings reports from Oracle.
Defensive sectors such as energy lagged behind as growth stocks led the rally.
Bond Yields and Consumer Confidence:
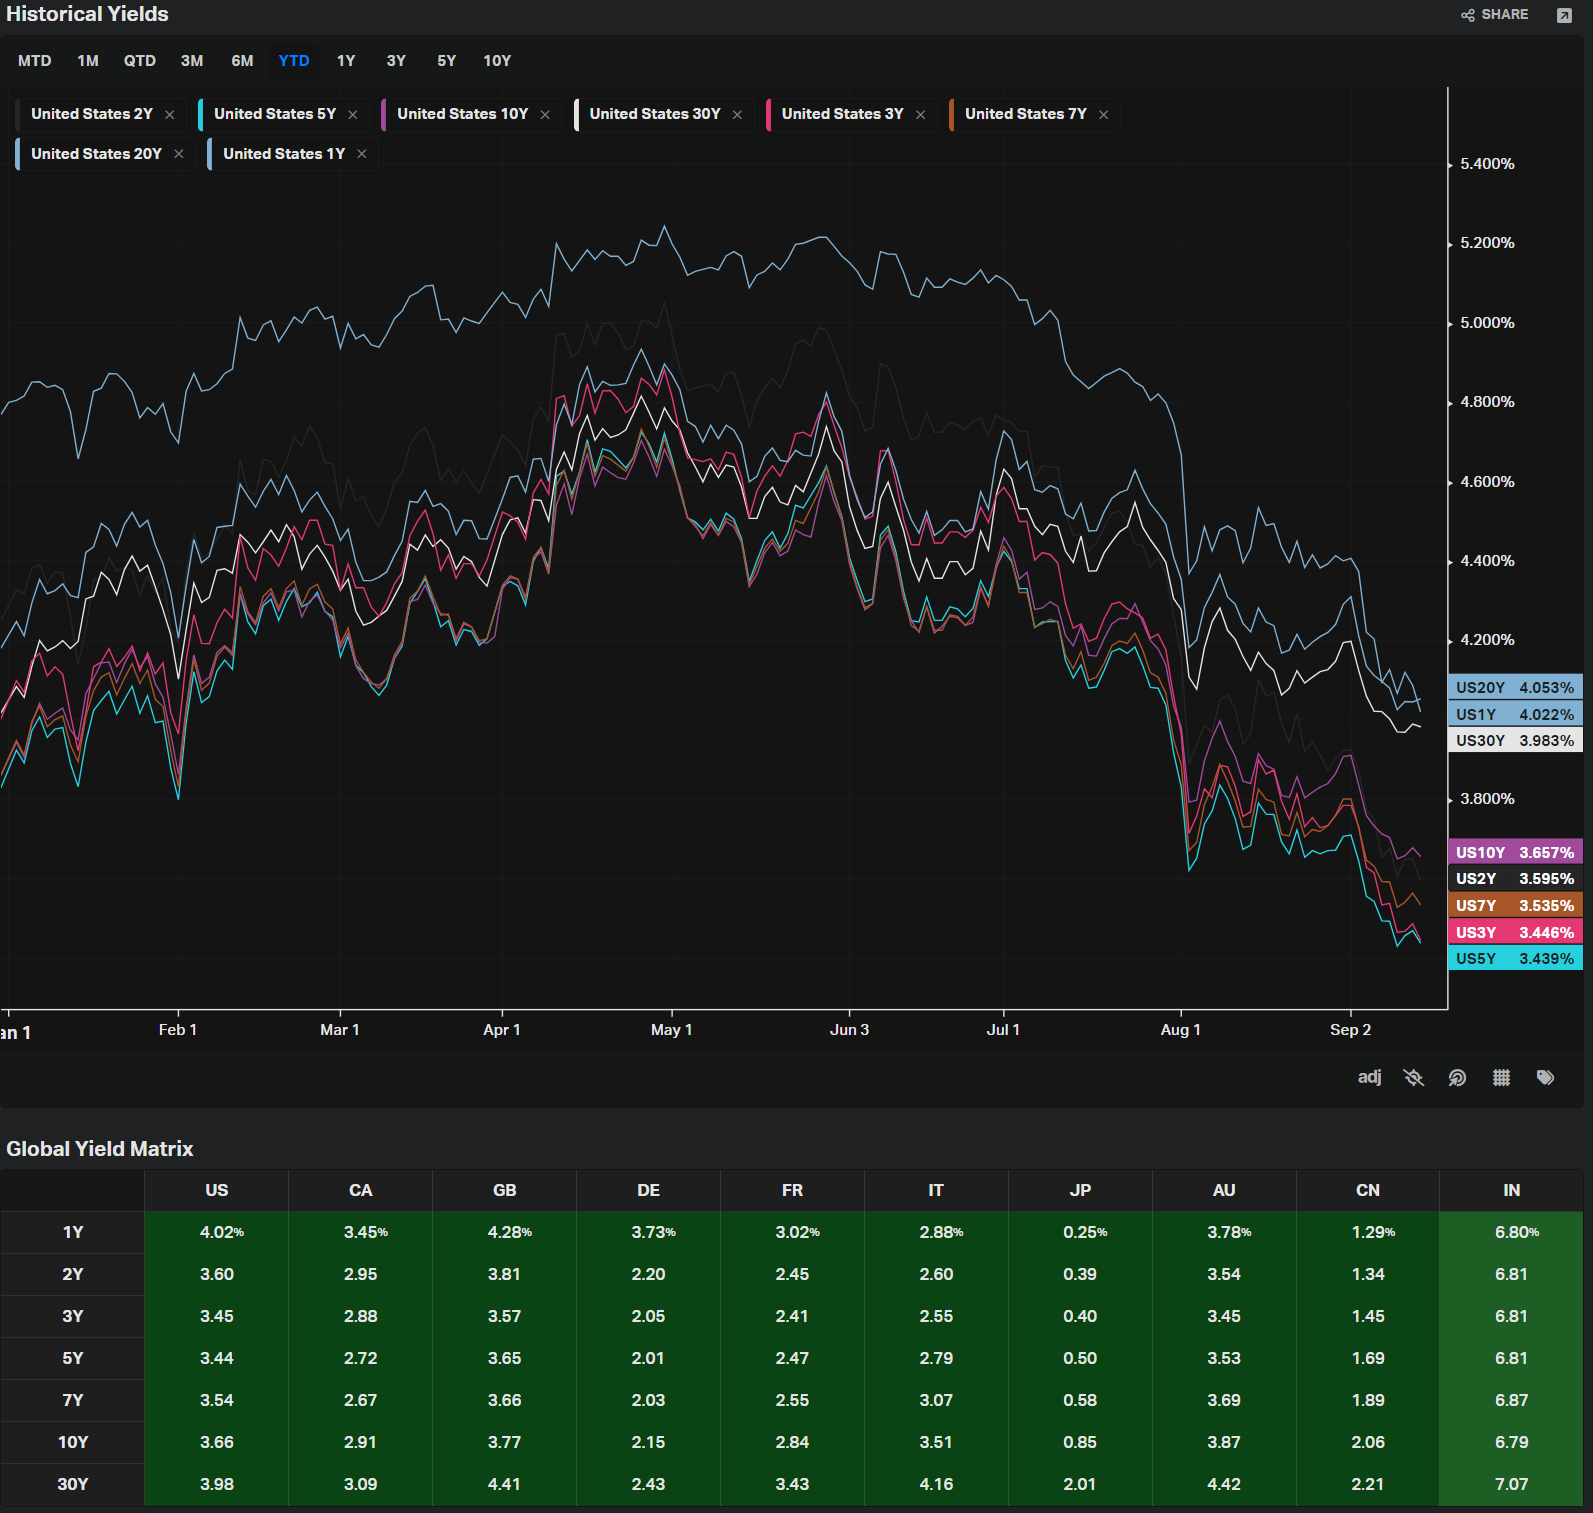
Bond yields declined further, with the 10-year Treasury yield dropping to 3.66%, the lowest since June 2023, as the market priced in expected rate cuts.
Consumer confidence improved, with the University of Michigan’s Consumer Sentiment Index rising to 69.0, indicating growing optimism about the economic outlook.
Gold Prices:
The price of gold surged above $2,600 per ounce, reflecting investor demand for safe-haven assets amid market uncertainty and expectations of lower interest rates.
Looking Ahead: The markets are now focused on the Federal Open Market Committee (FOMC) meeting next Wednesday, where the Fed is expected to begin its rate-cutting cycle. While the size of the cut remains uncertain, with possibilities of either a 25 or 50 basis point reduction, the general expectation is for a more moderate approach.

Additionally, key economic data releases next week, including August retail sales and housing starts, will offer further insights into consumer demand and housing market conditions.
This Week’s Snapshots
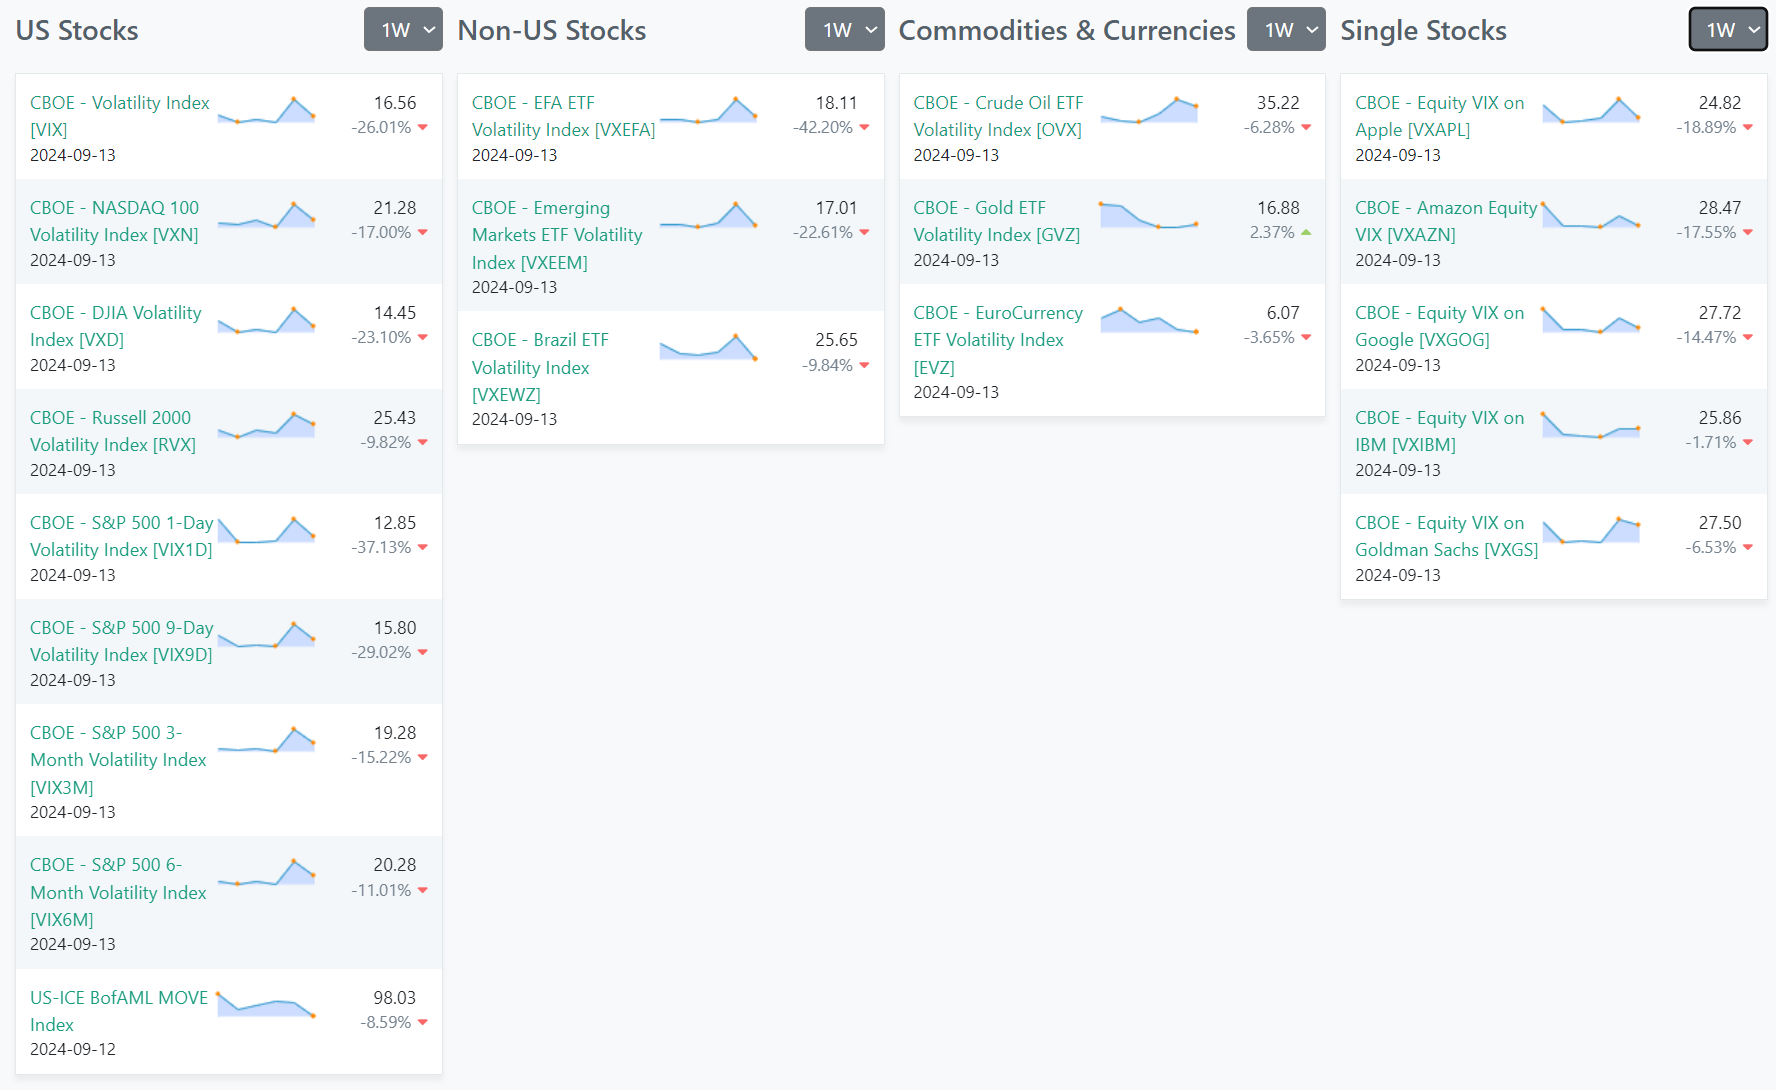
Volatility
ETFs
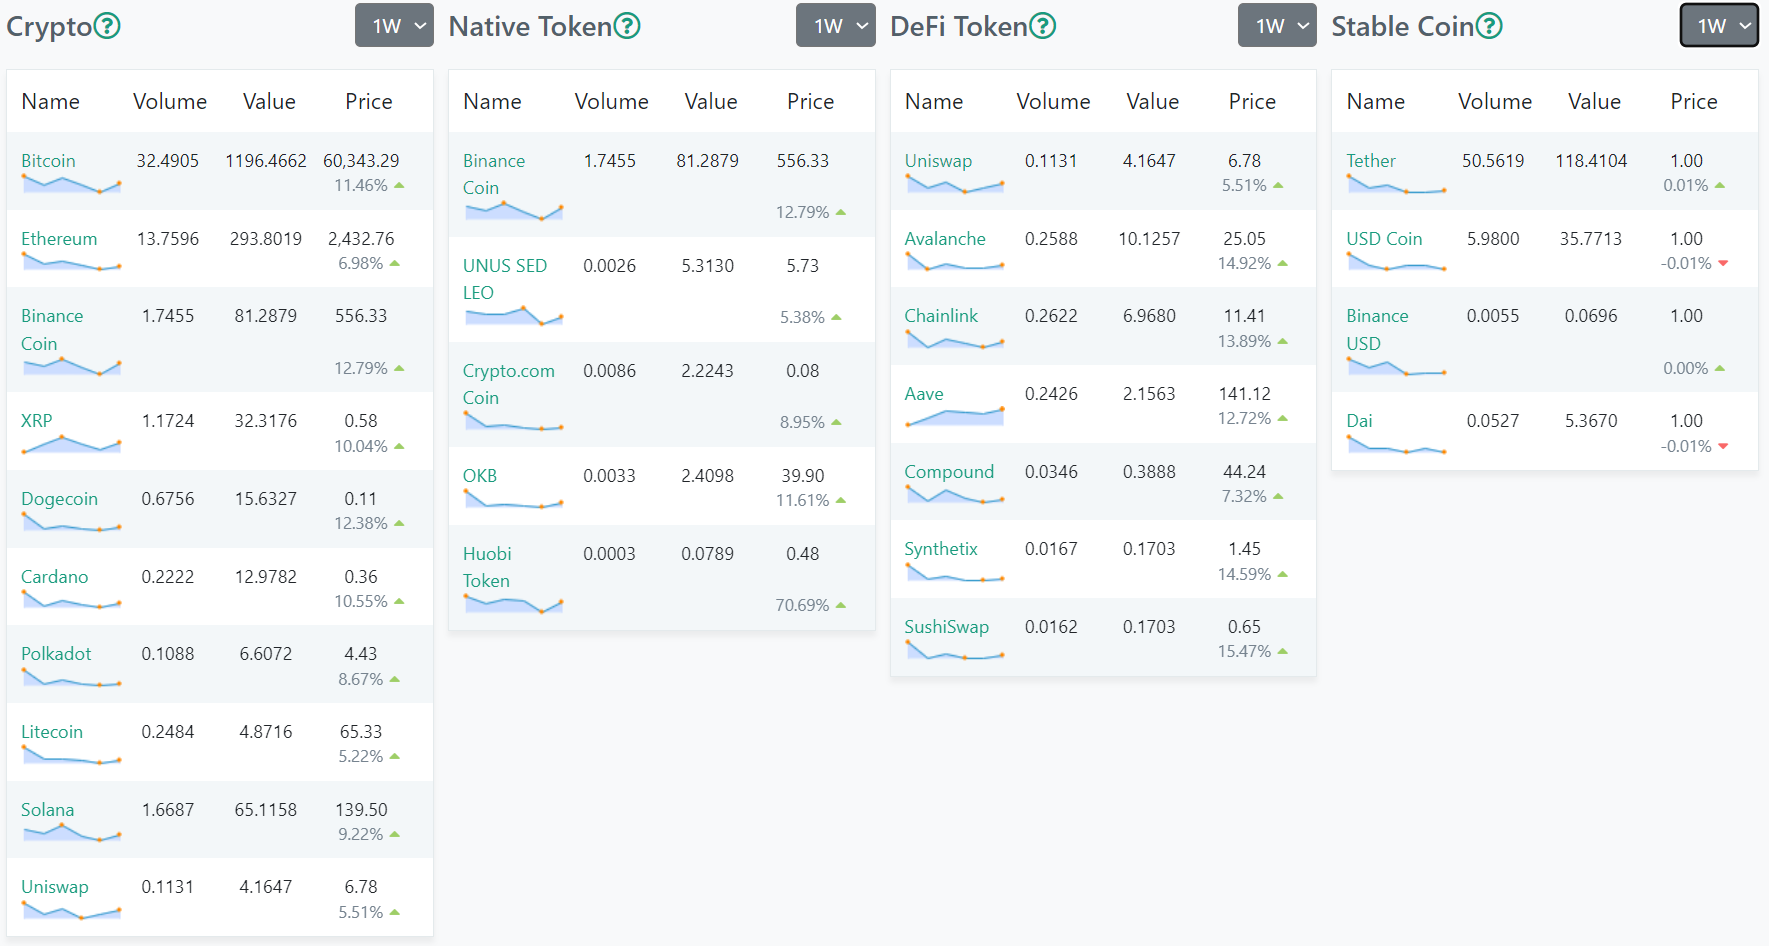
Crypto
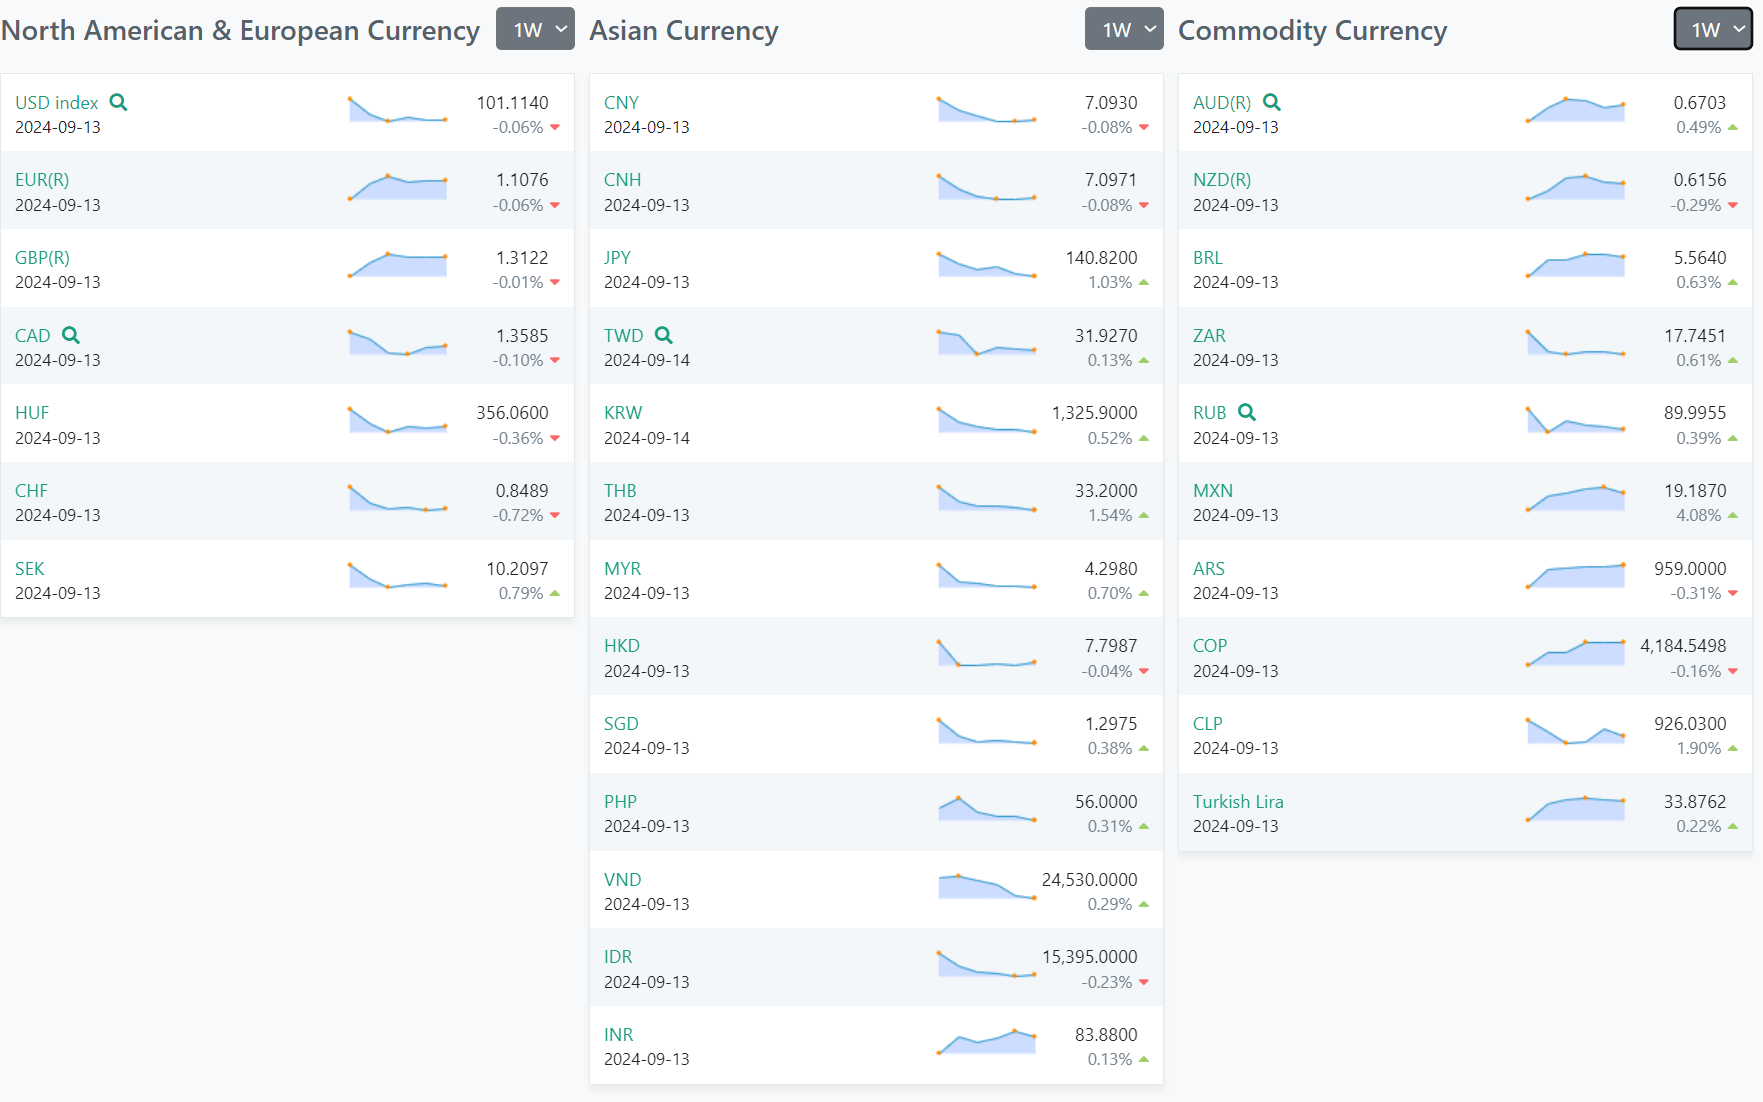
Forex
US Investor Sentiment
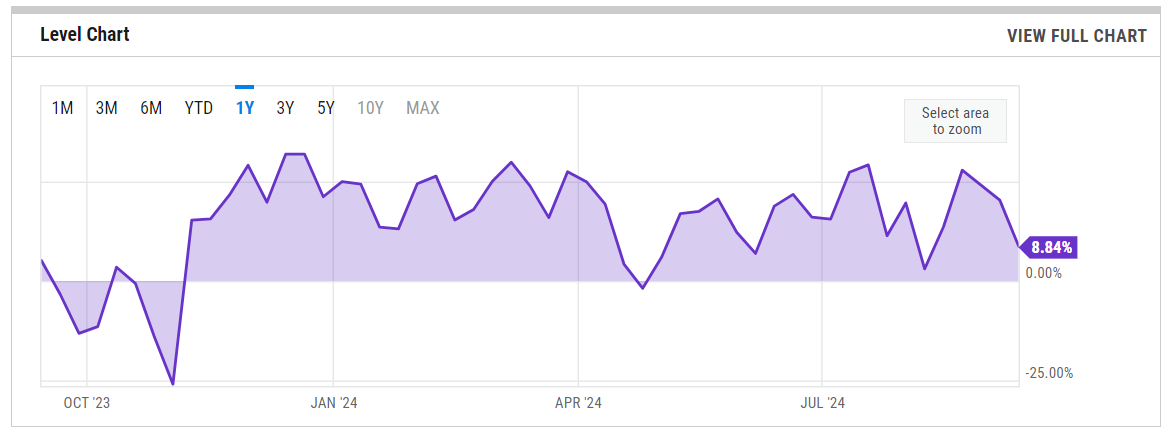
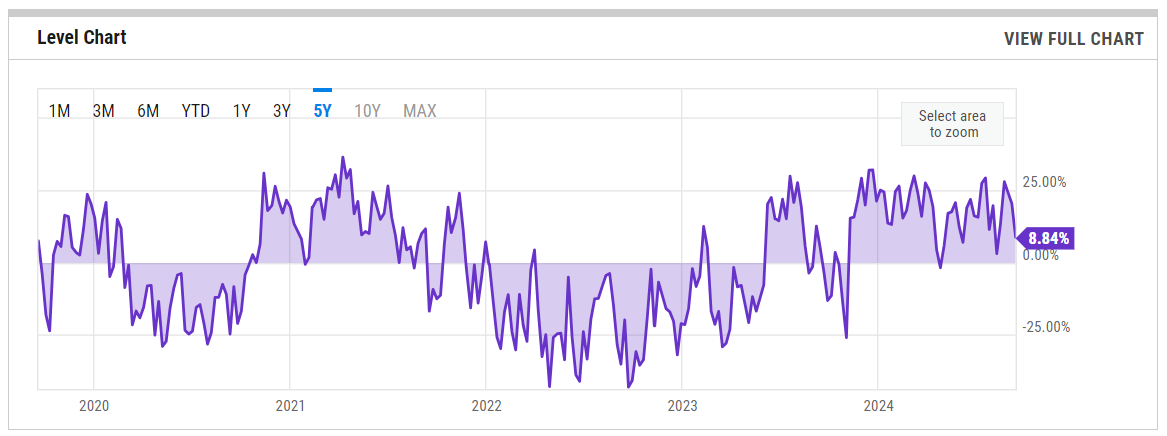
%Bull-Bear Spread
US Investor Sentiment, % Bull-Bear Spread is at 8.84%, compared to 20.42% last week and 12.60% last year. This is higher than the long-term average of 6.69%.
1-Year View
5-Year View
NAAIM Exposure Index
The NAAIM Exposure Index (National Association of Active Investment Managers Exposure Index) measures the average exposure to U.S. equity markets as reported by its member firms. These are typically active money managers who provide their equity exposure levels weekly. The index offers insight into how much these managers are investing in equities at any given time, ranging from being fully short (-100%) to leveraged long (up to +200%). The NAAIM number increased from the previous week's reading of 71.93.
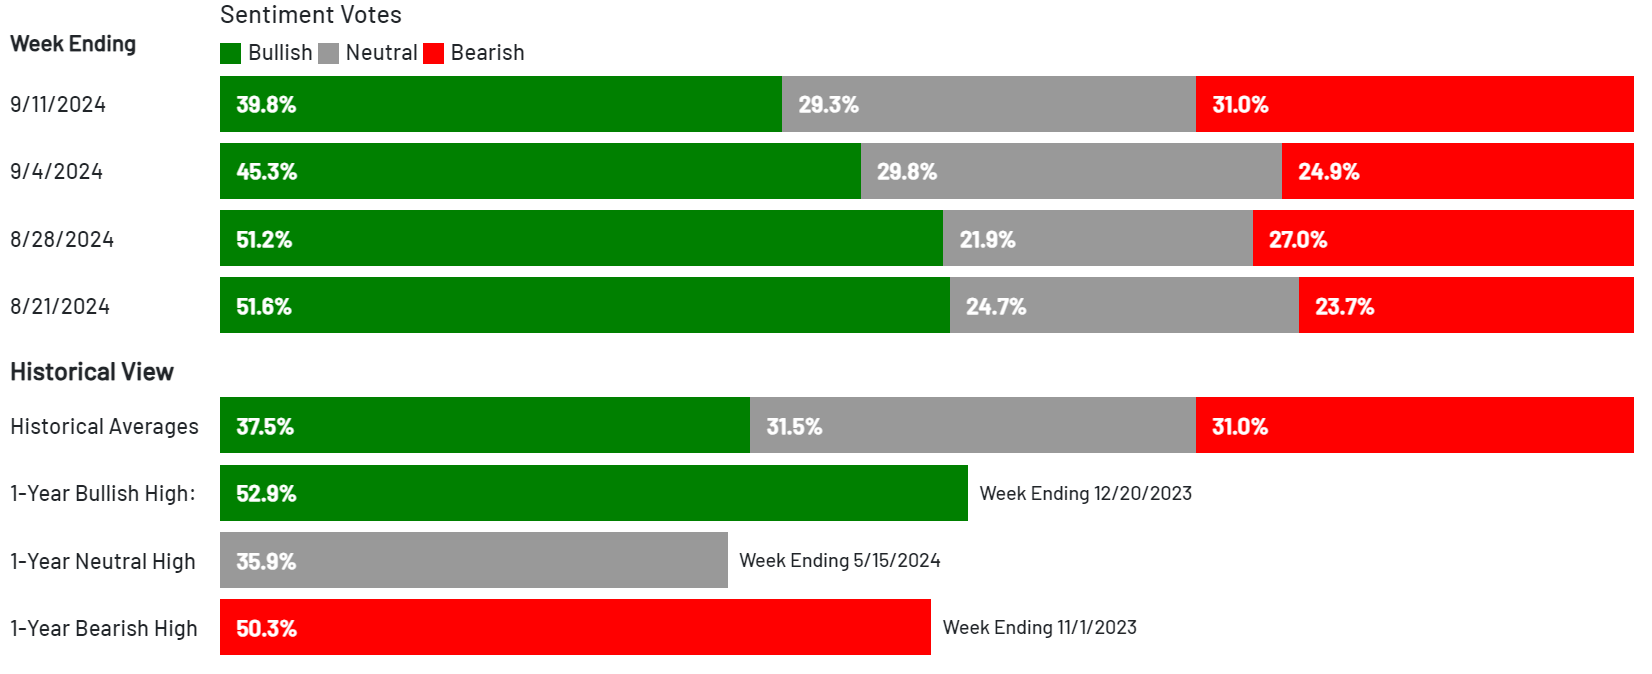
AAII Investor Sentiment Survey
The AAII Investor Sentiment Survey is a weekly survey conducted by the American Association of Individual Investors (AAII) to gauge the mood of individual investors regarding the direction of the stock market over the next six months. It provides insights into whether investors are feeling bullish (expecting the market to rise), bearish (expecting the market to fall), or neutral (expecting the market to stay about the same).
Key Points:
Bullish Sentiment: Reflects the percentage of investors who believe the stock market will rise in the next six months.
Bearish Sentiment: Represents those who expect a decline.
Neutral Sentiment: Reflects investors who anticipate little to no market movement.
The survey is widely followed as a contrarian indicator, meaning that extreme levels of bullishness or bearishness can sometimes signal market turning points. For example, when a large number of investors are overly optimistic (high bullish sentiment), it could suggest a market top, while excessive pessimism (high bearish sentiment) may indicate a market bottom is near.
SPX Put/Call Ratio
1-Year View
5-Year View
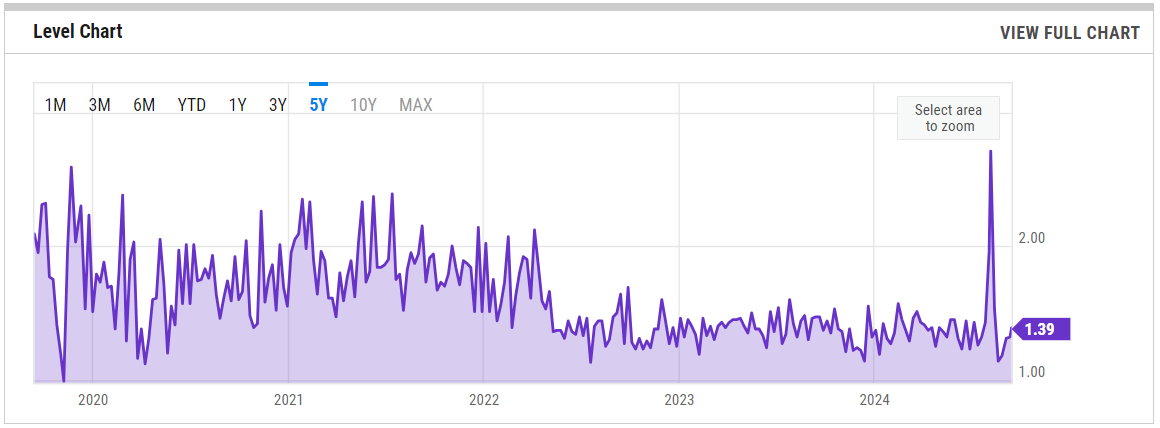
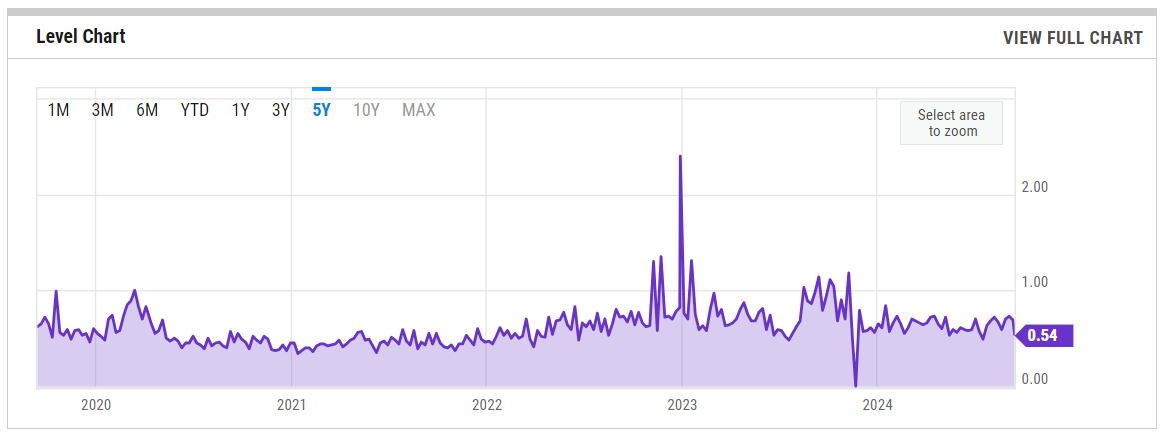
CBOE Equity Put/Call Ratio
1-Year View
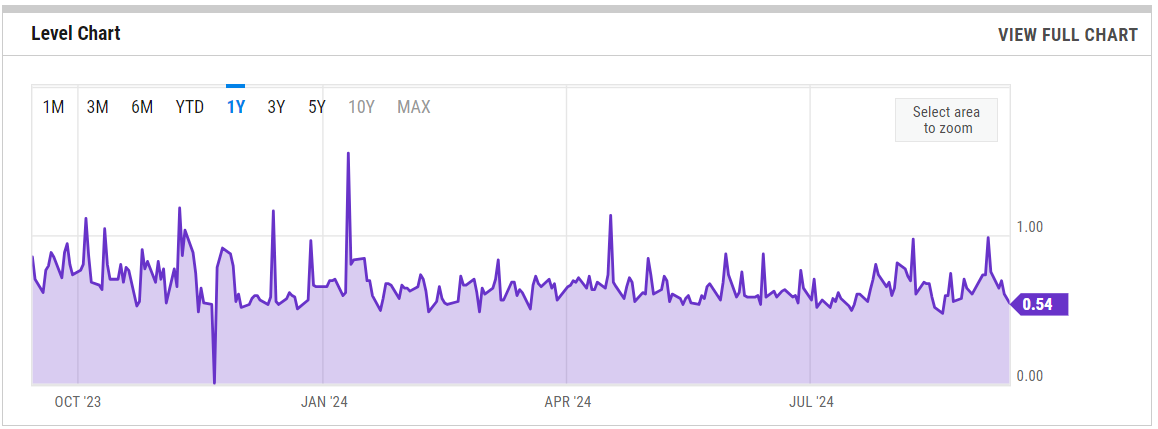
5-Year View
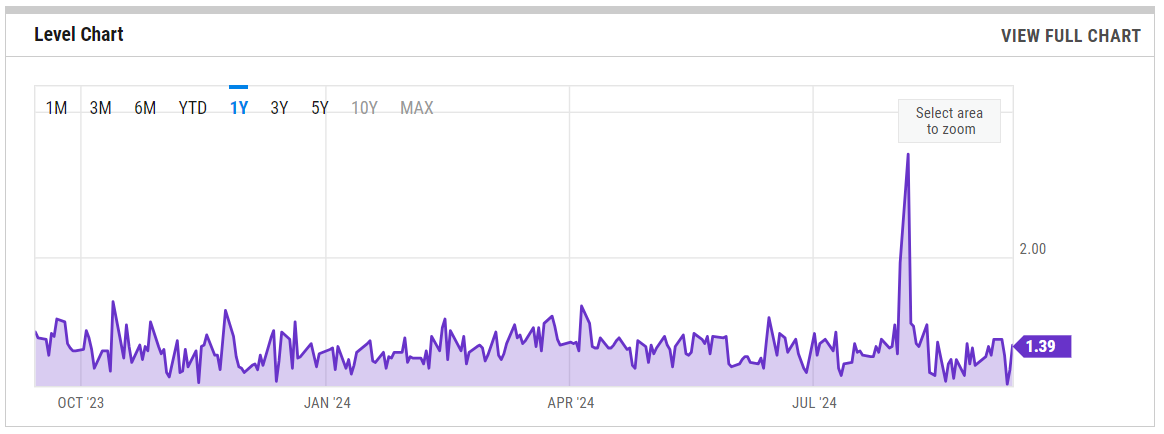
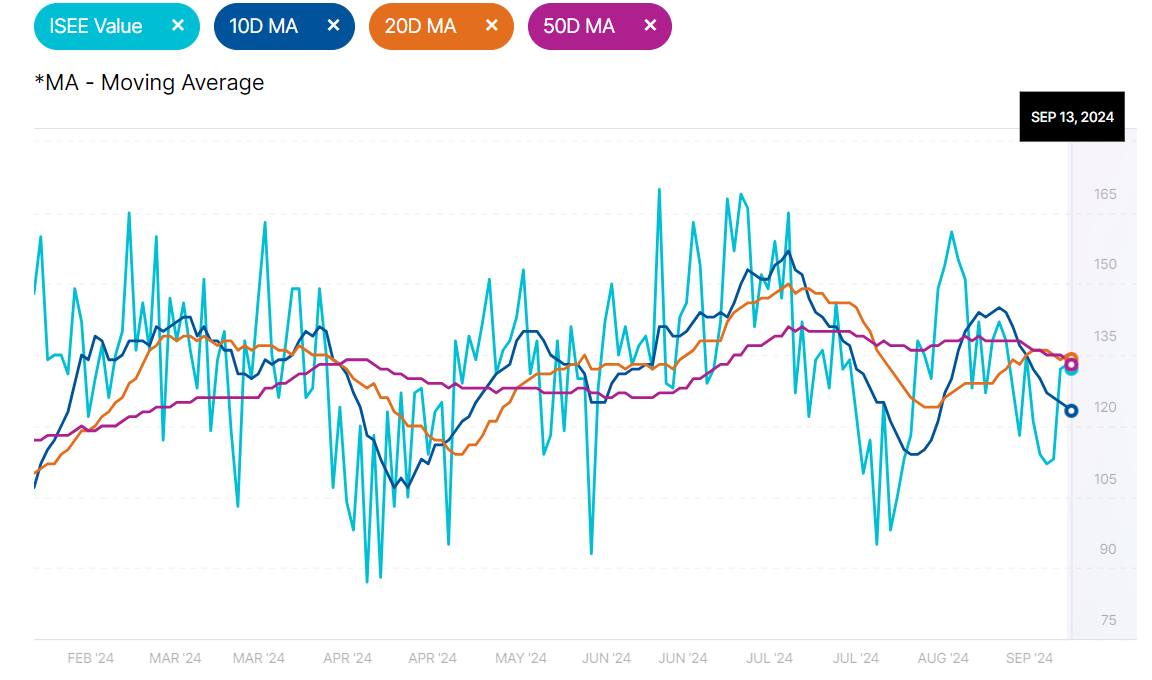
ISEE Sentiment Index
The ISEE (International Securities Exchange Sentiment) Index is a measure of investor sentiment derived from options trading. Unlike traditional put/call ratios, the ISEE Index focuses only on opening long customer transactions and is adjusted to remove market-maker and firm trades, providing a purer sentiment reading.
The ISEE Index typically ranges from 0 to 200, with readings above 100 indicating more call options being bought relative to put options, suggesting bullish sentiment. Conversely, readings below 100 suggest bearish sentiment, with more puts being purchased relative to calls.
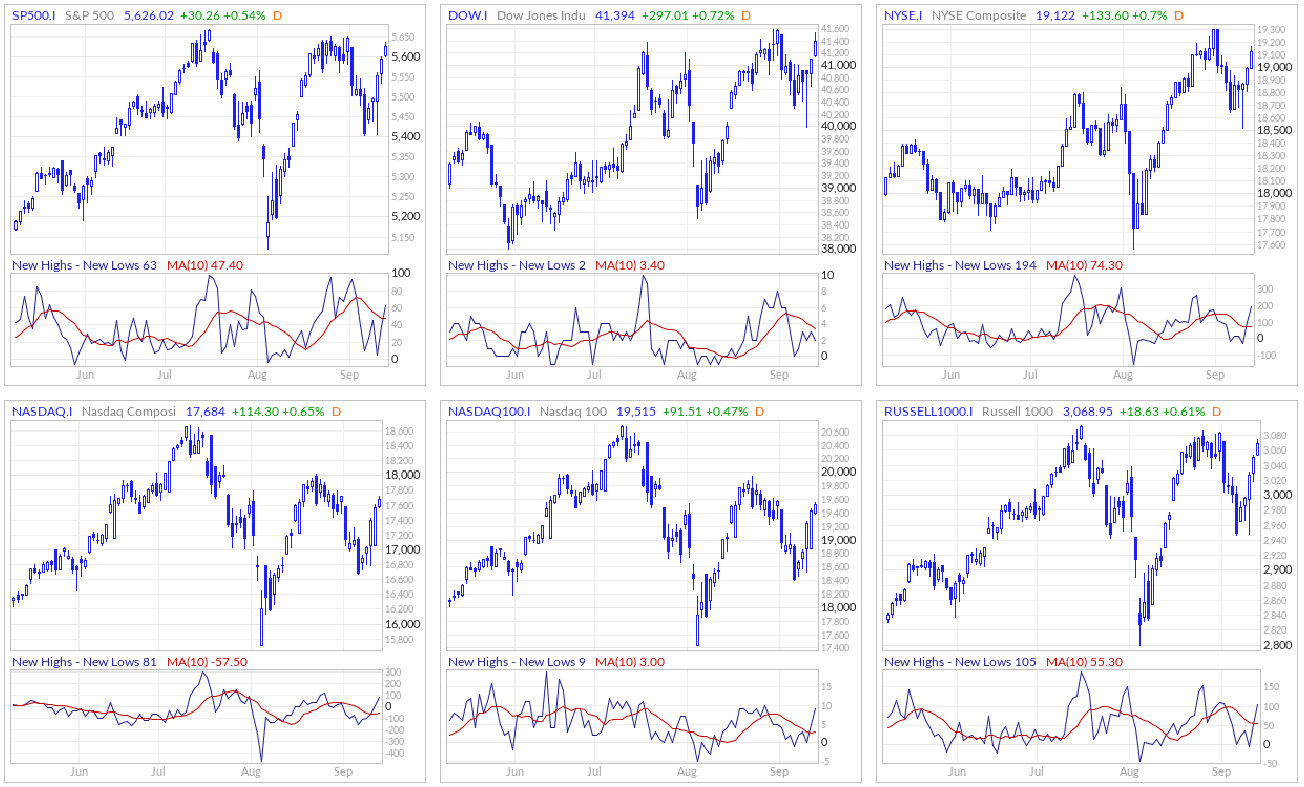
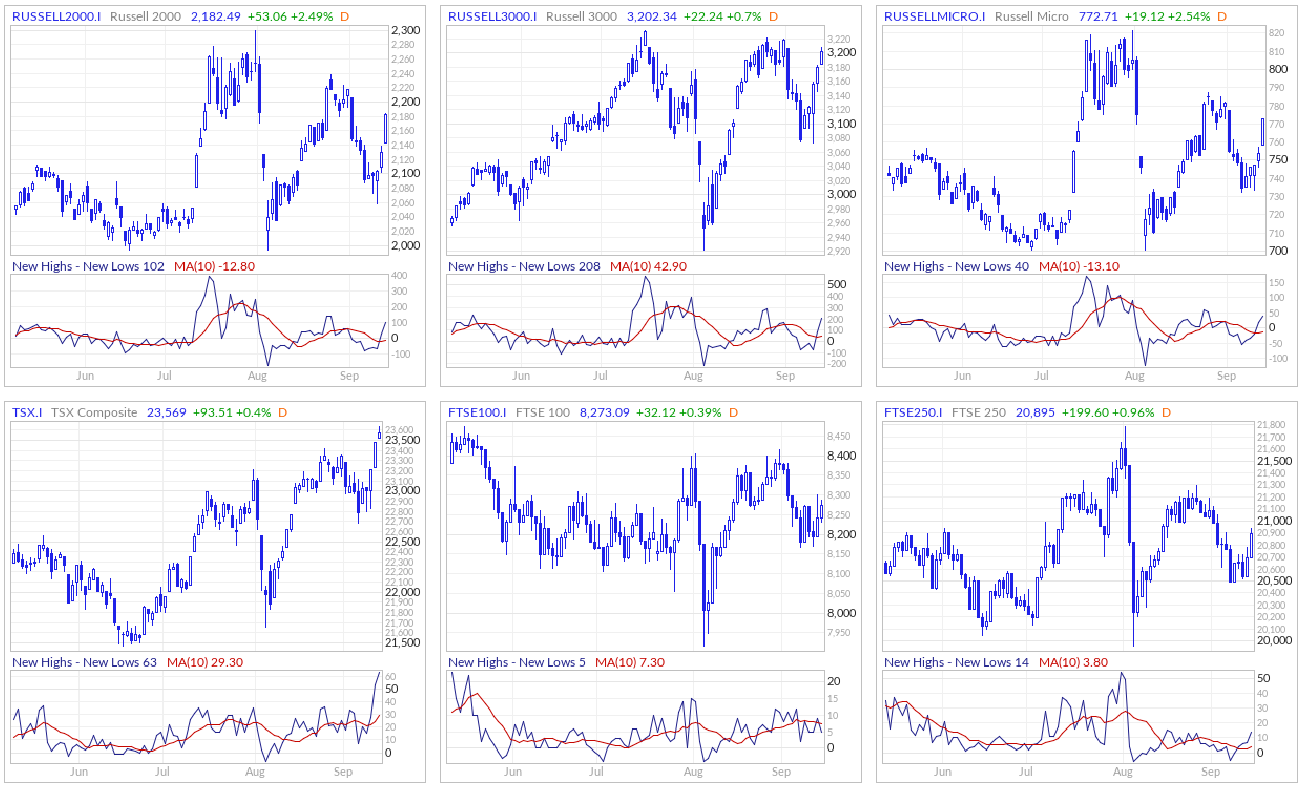
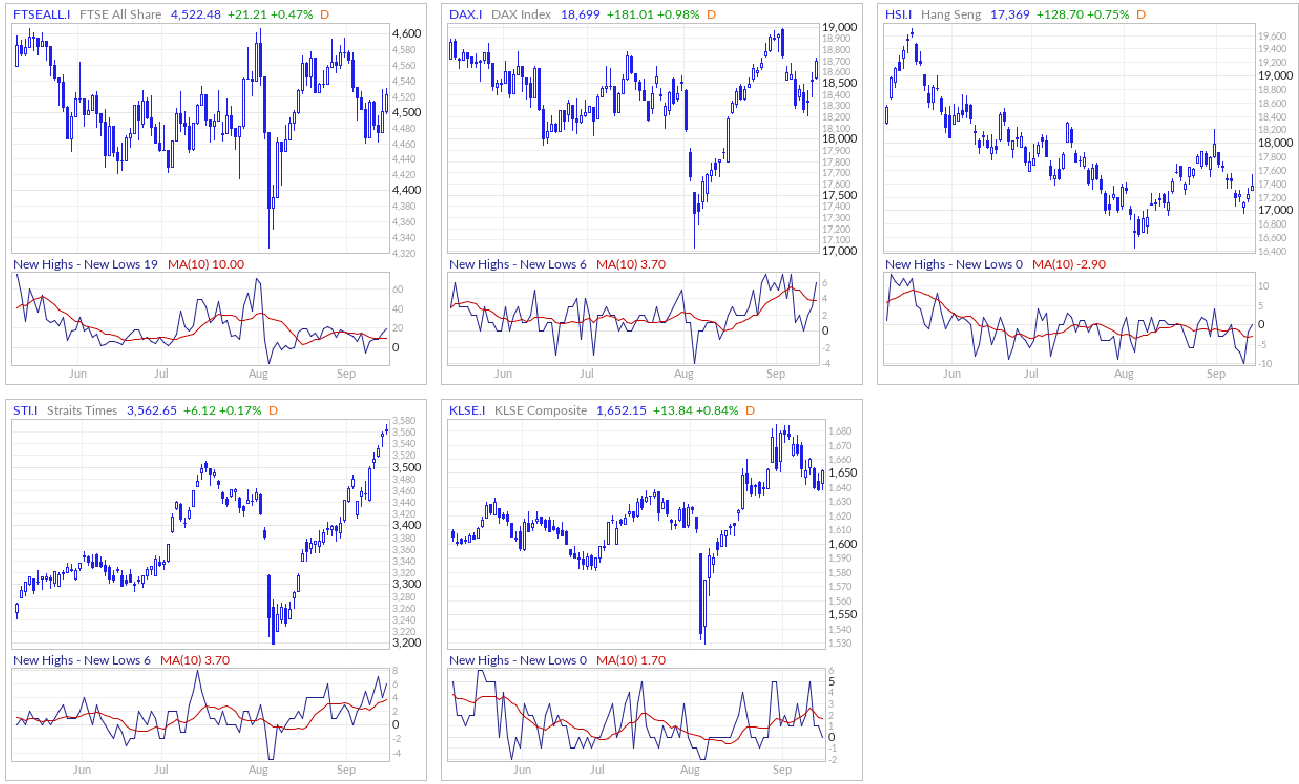
New Highs - New Lows
The New Highs - New Lows indicator (NH-NL) displays the daily difference between the number of stocks reaching new 52-week highs and the number of stocks reaching new 52-week lows. The NH-NL indicator generally reaches its extreme lows slightly before a major market bottom. As the market then turns up from the major bottom, the indicator jumps up rapidly. During this period, many new stocks are making new highs because it's easy to make a new high when prices have been depressed for a long time. The NH-NL indicator oscillates around zero. If the indicator is positive, the bulls are in control. If it is negative, the bears are in control. As the cycle matures, a divergence often occurs as fewer and fewer stocks are making new highs (the indicator falls), yet the market indices continue to reach new highs. This is a classic bearish divergence that indicates that the current upward trend is weak and may reverse.
CME Fedwatch
What is the likelihood that the Fed will change the Federal target rate at upcoming FOMC meetings, according to interest rate traders? Use CME FedWatch to track the probabilities of changes to the Fed rate, as implied by 30-Day Fed Funds futures prices.
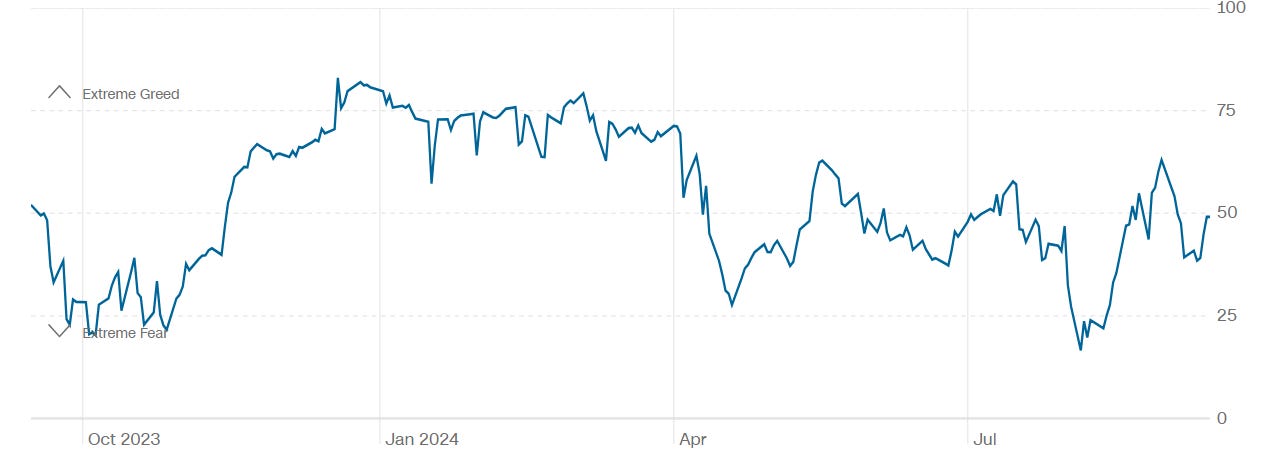
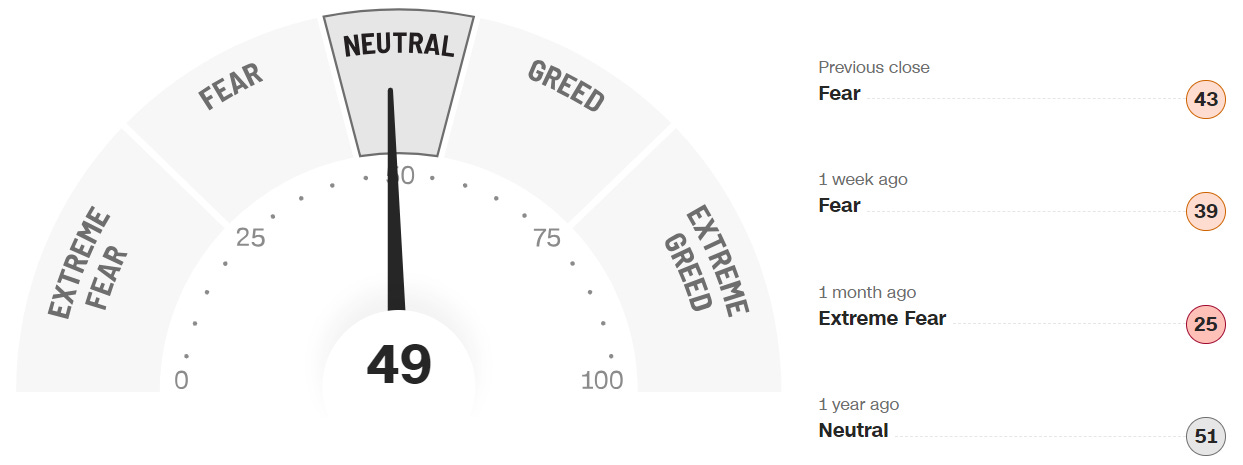
CNN 7 Fear & Greed Constituent Data Points + Composite Index
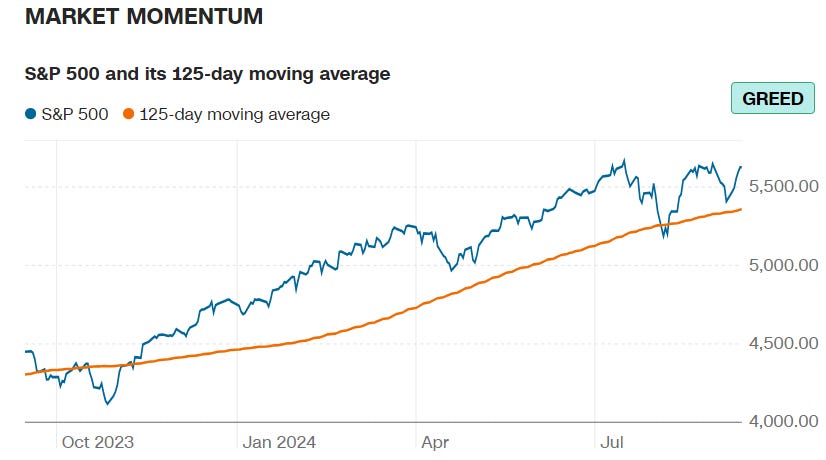
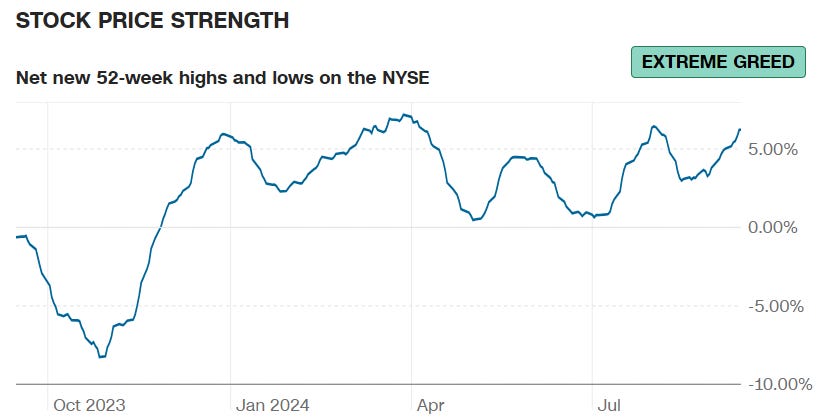
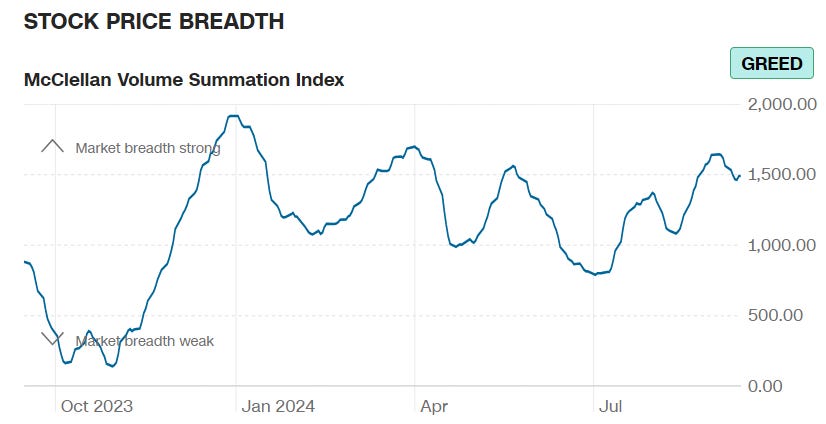
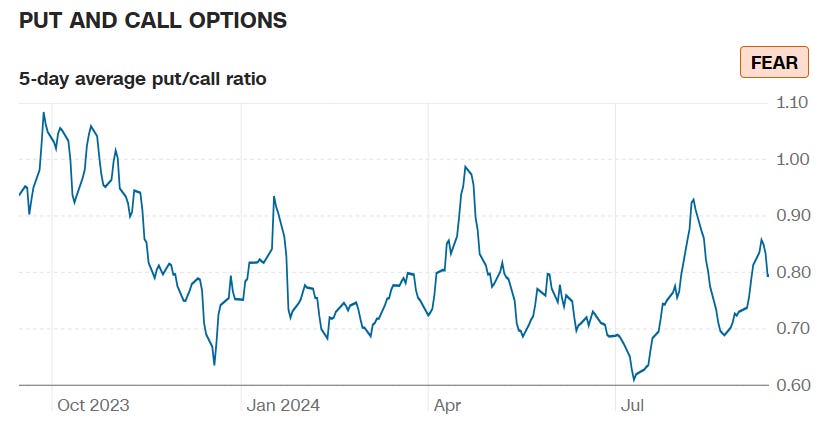
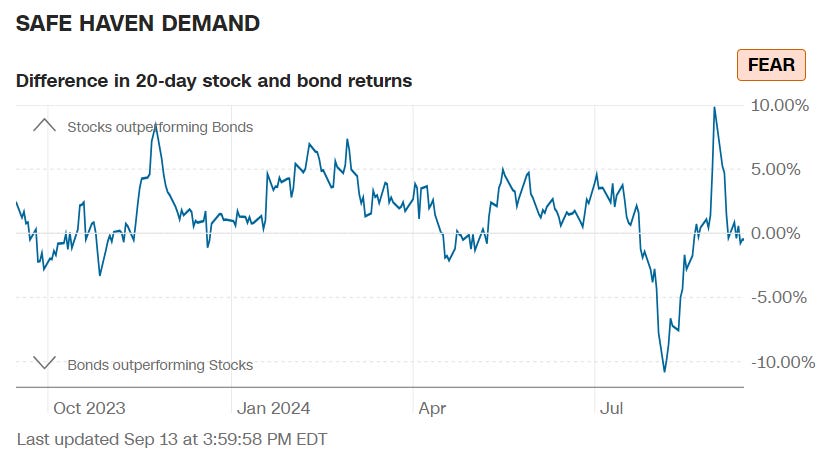
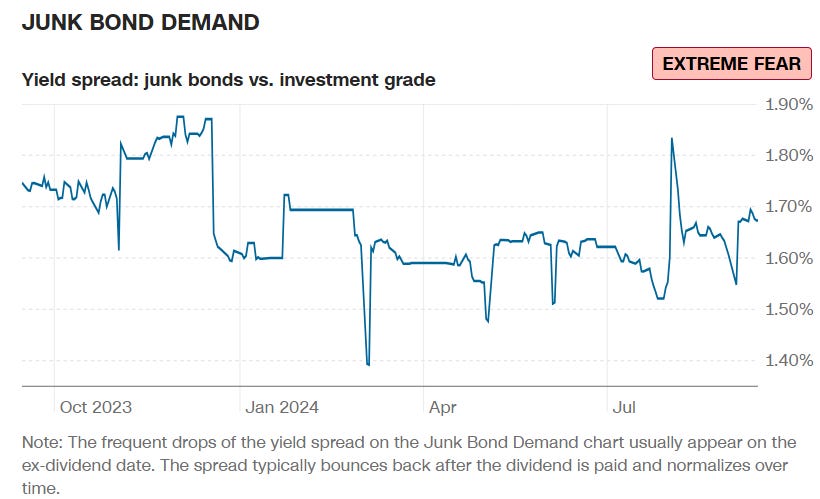
Final Composite Fear & Greed Index Reading
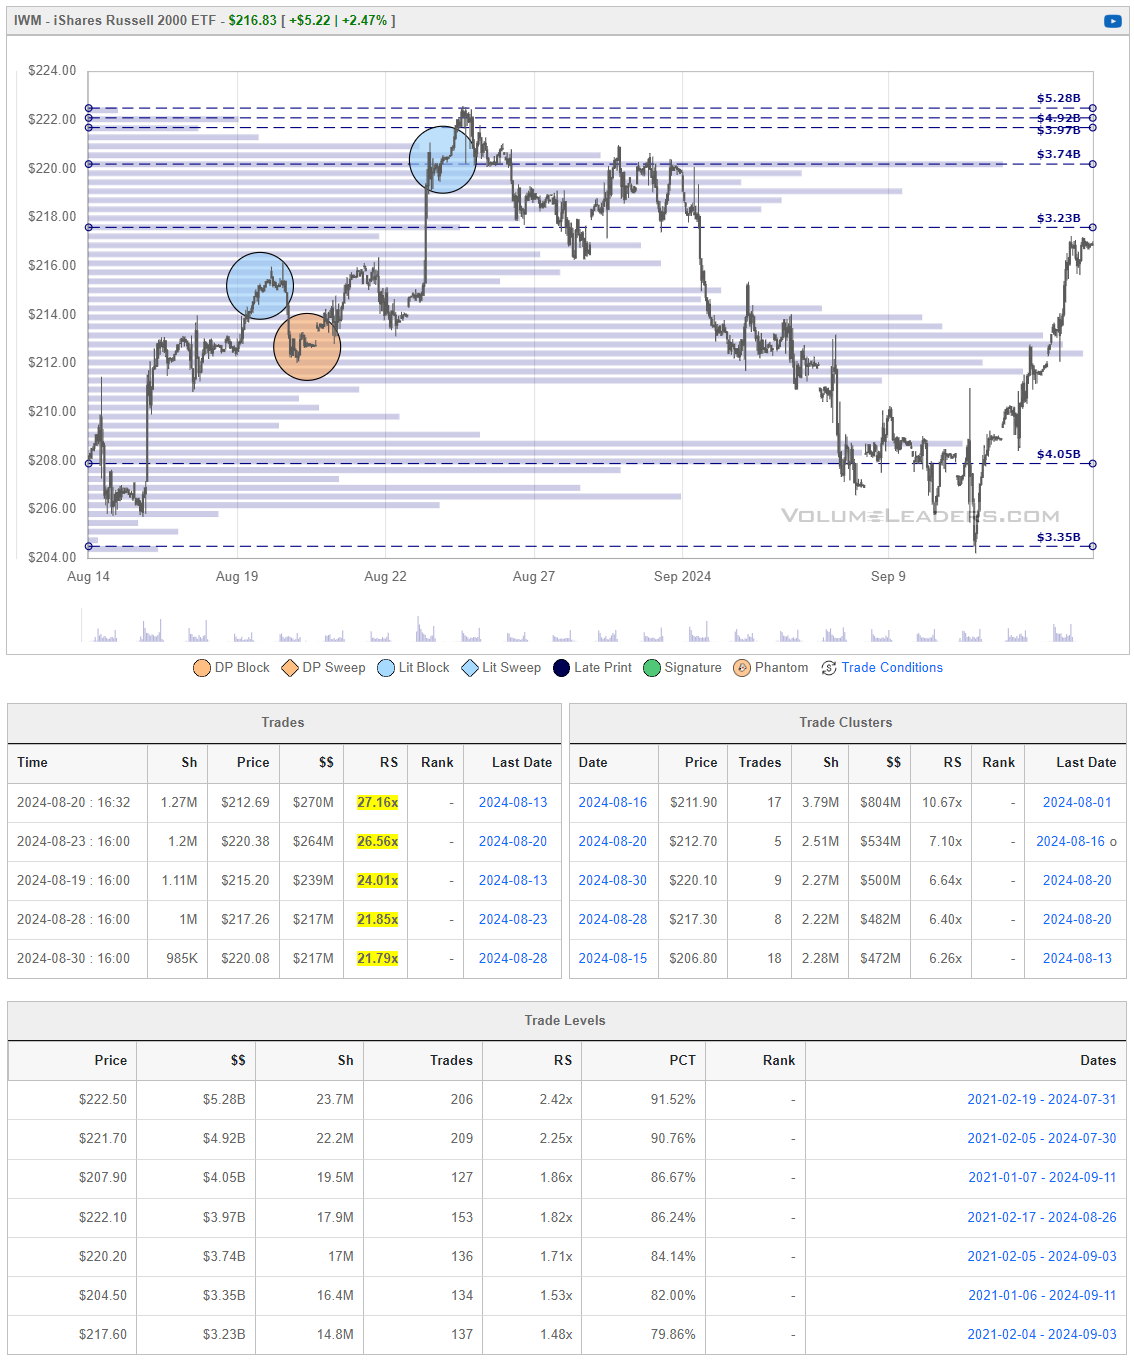
Institutional S/R Levels for Major Indices
When you’re a large institutional player, your primary goal is to find liquidity - places to do a ton of business with the least amount of slippage possible. VolumeLeaders.com automatically identifies and visually plots the exact spots where institutions are doing business and where they are likely to return for more. It’s one of the primary reasons “support” and “resistance” concepts work and truly one of the reasons “price has memory”.
Levels from the VolumeLeaders.com platform can help you formulate trades theses about:
Where to add or take profit
Where to de-risk or hedge
What strikes to target for options
Where to expect support or resistance
This is just a small sample; there are countless ways to leverage this information into trades that express your views on the market. The platform covers thousands of tickers on multiple timeframes to accommodate all types of traders. Observe for yourself how accurate the levels are by marking-up your charts with the information in the “Trade Levels” boxes I’m giving for free below and play-along in real-time this week. These charts cover the past 7 or so sessions but subs will get new levels as they develop in real-time and have access to levels from other time frames. I’m confident you’ll see how clear-cut, intuitive and actionable this information is for yourself.

The significant clustering of institutional activity at the lows, shown as blue dashed horizontal lines, was provided in last week’s stack. Readers were advised to look for support in that area. In case you’ve been under a rock all week, support was found. Price has now traversed the 30-day range and is in an are where price could find resistance; between $563.68 and $564.41 appears to be a critical resistance zone based on recent institutional trading. $554.70 is the first area of support should price retrace.
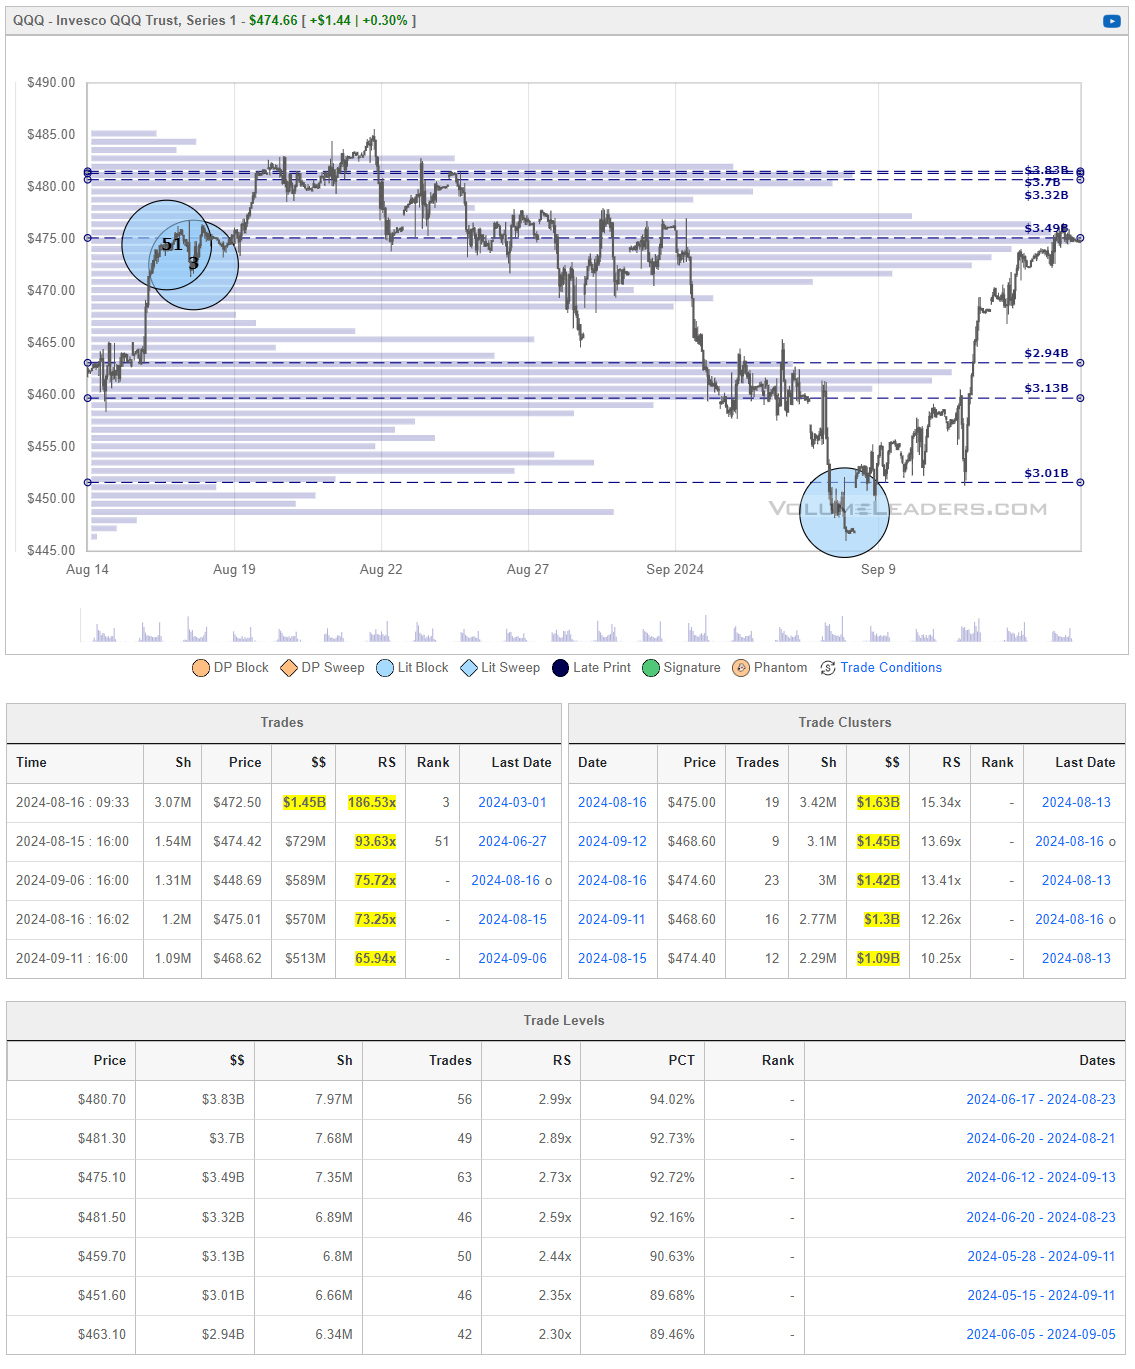
Like SPY, price was very responsive to given levels. However, price is pulling into a well-defined level of resistance here in the Q’s at $475.10. $463.10 is the first area of support underneath. If bulls can sustain their momentum, price should be checking-in with those three giant levels above clustered tightly together ($480.70, $481.30 and $481.50).
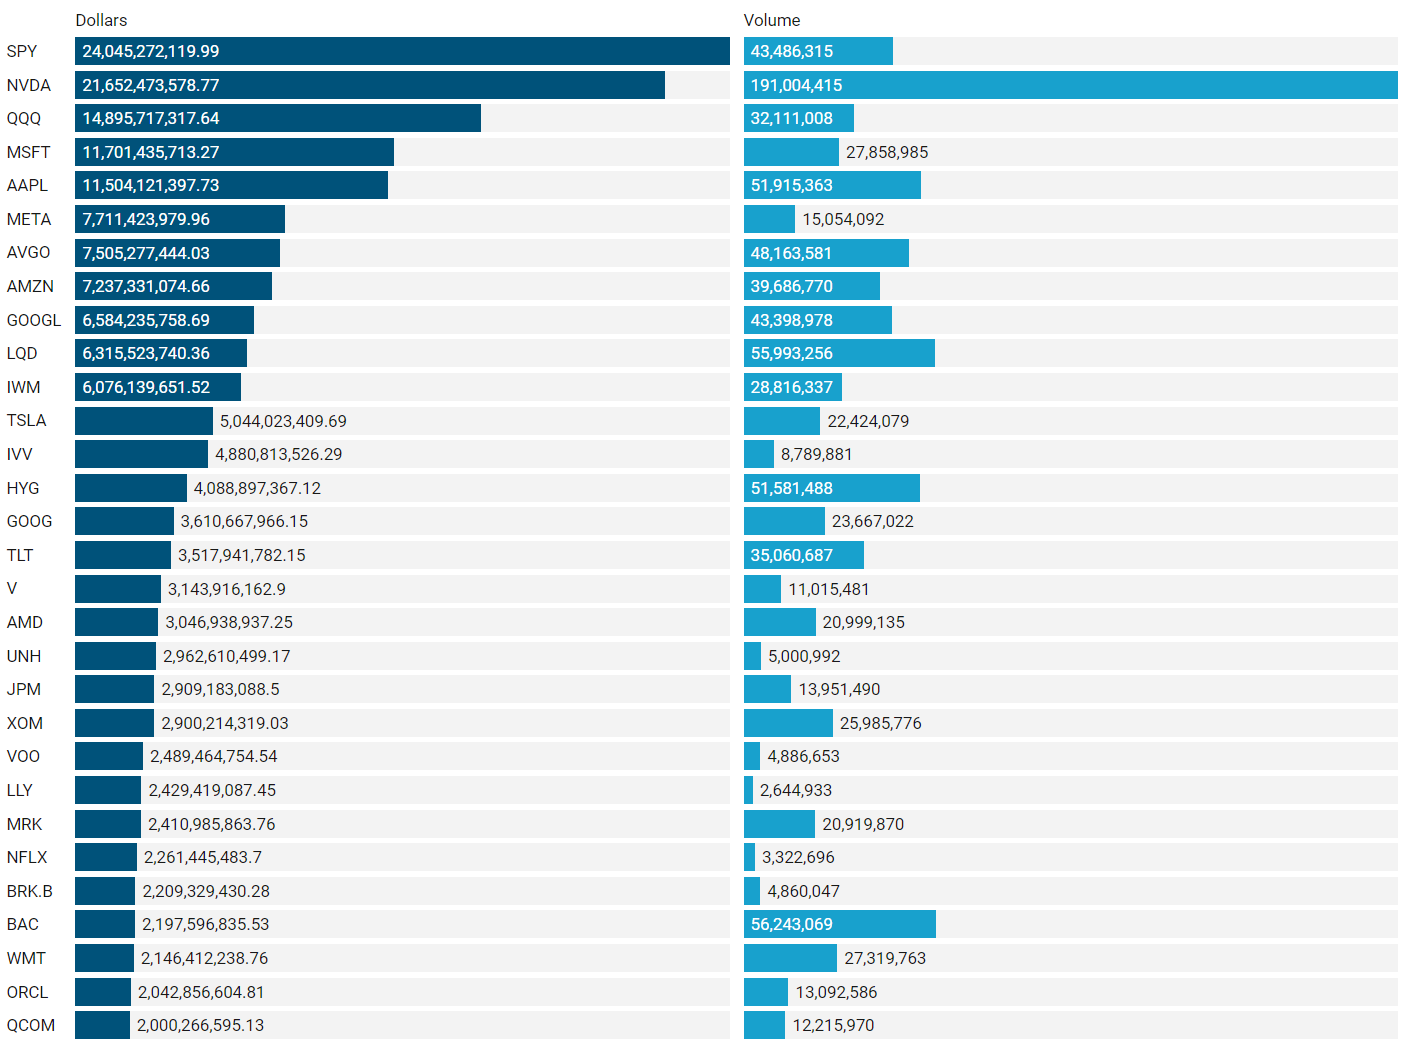
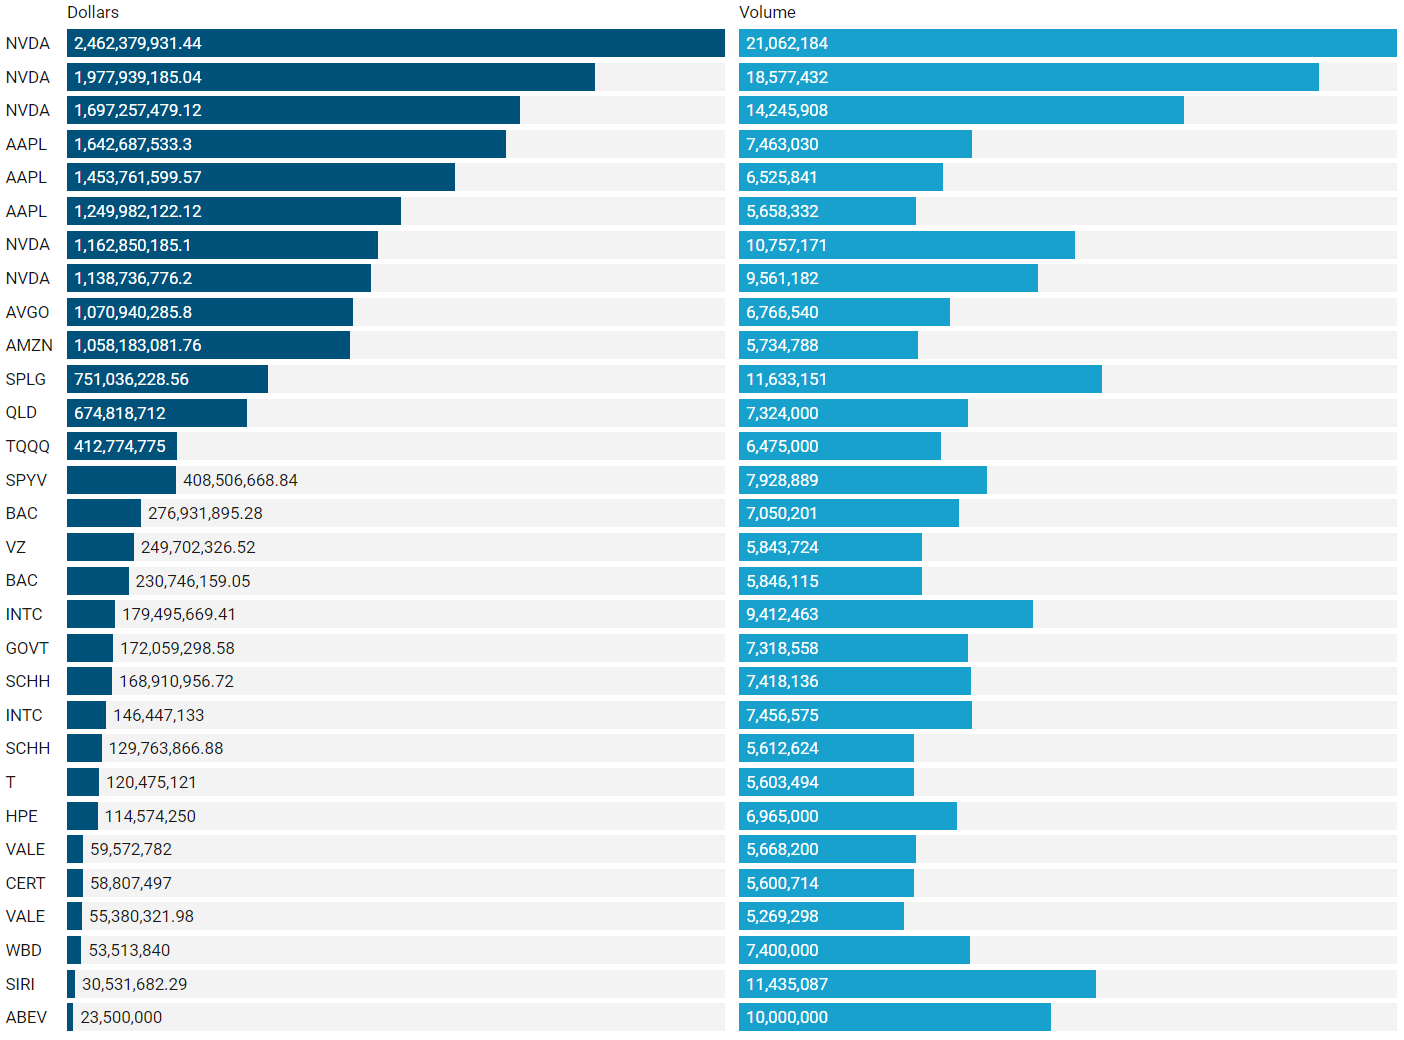
Top Institutional Order Flow
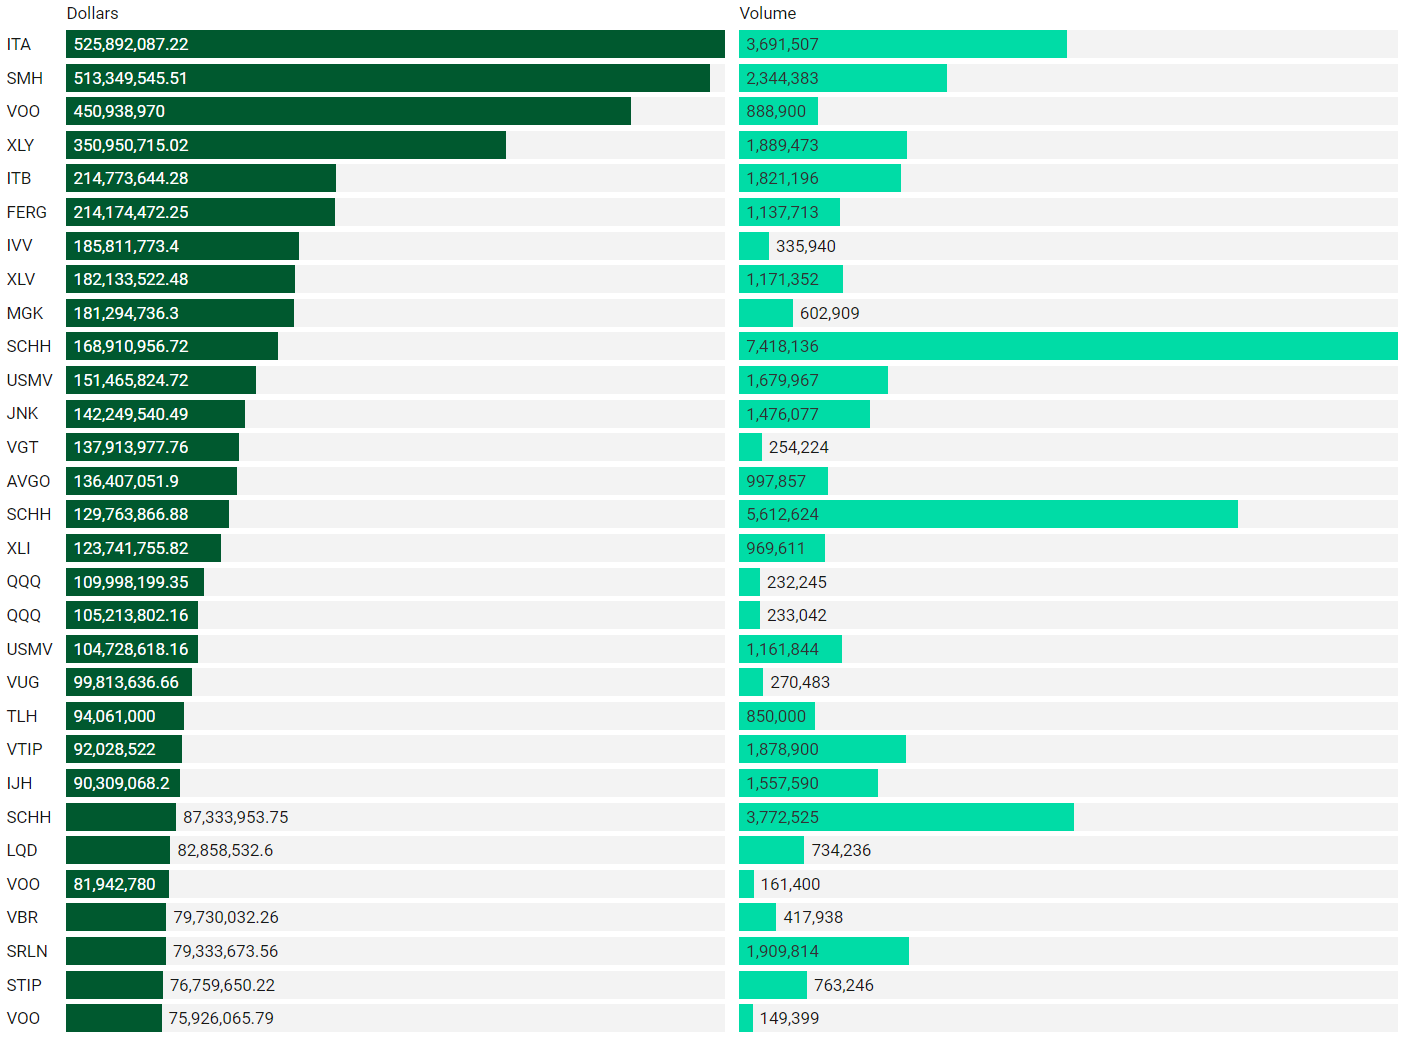
There are often great trades ideas or sources for inspiration in these prints. Only the top 30 of each group are shown but the full results are available in VL for you to browse at your leisure. Don’t forget to set up trade alerts inside the platform so you never miss institutional order flow that piques your interest or is otherwise important to you. Blue charts include all trade types including blocks on lit exchanges; red/orange charts are dark pool only trades; green charts are sweeps only.
Top Aggregate Dollars Transacted by Ticker
Largest Individual Trades by Dollars Transacted
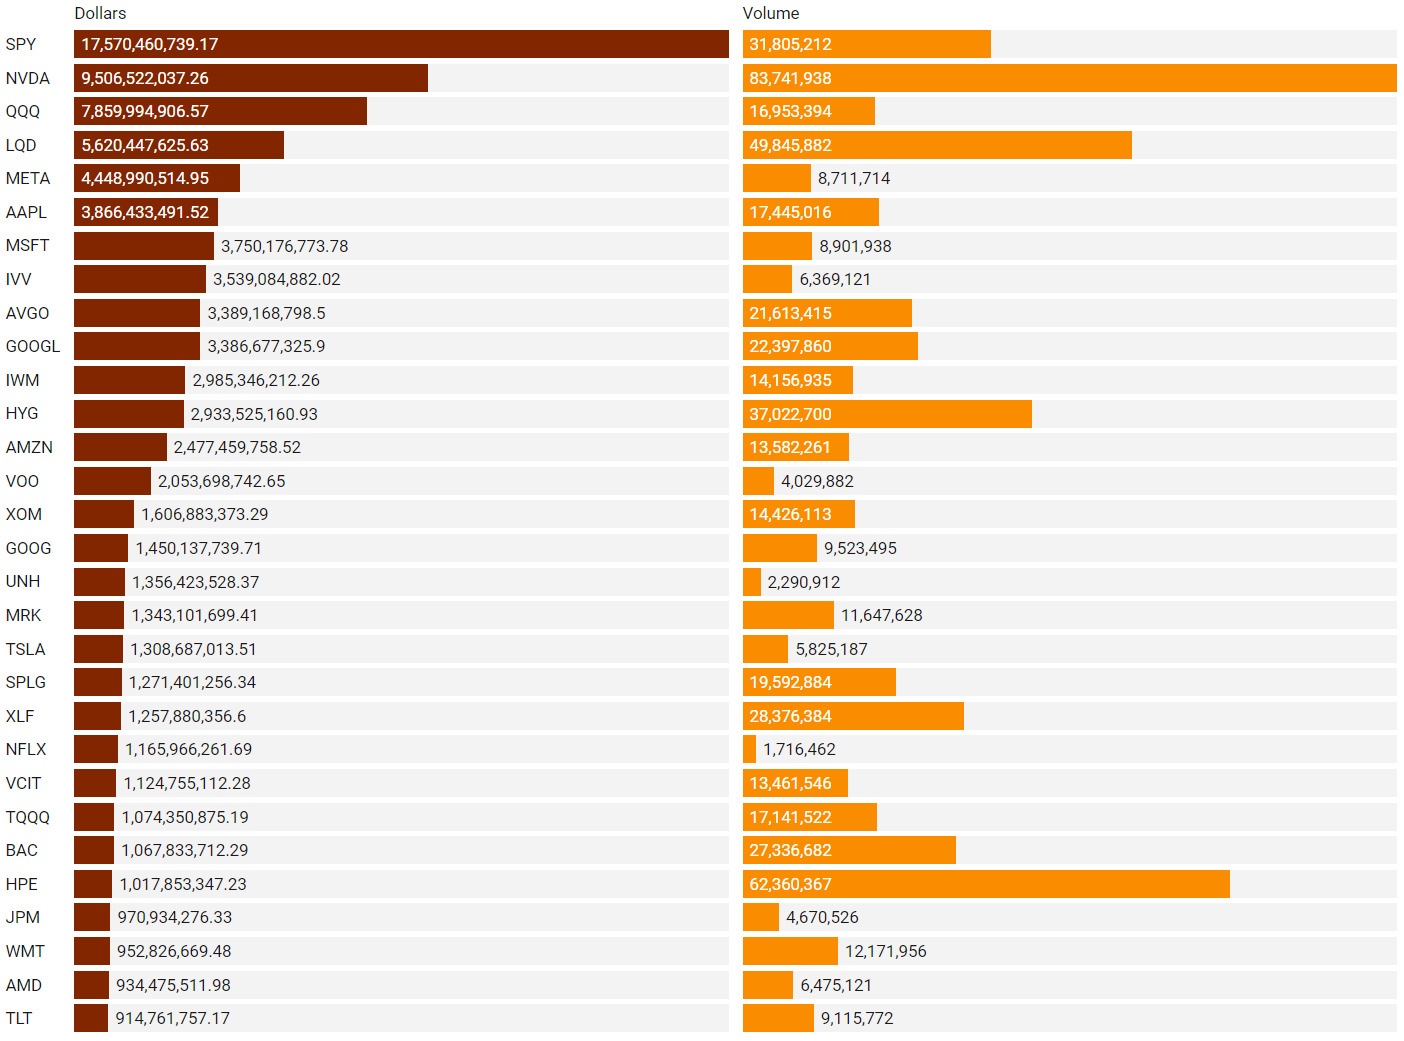
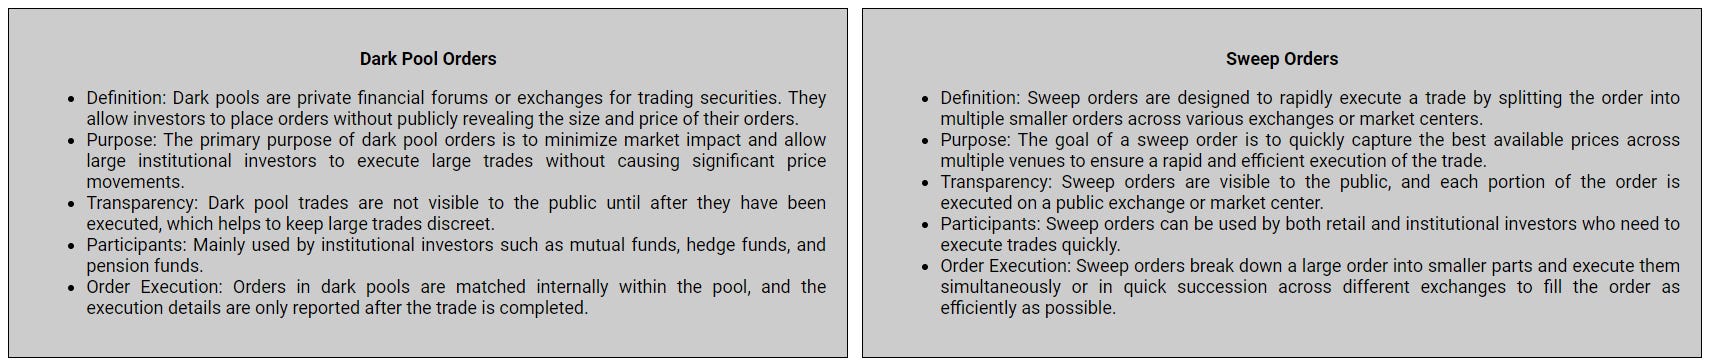
Top Aggregate Dark Pool Activity by Ticker
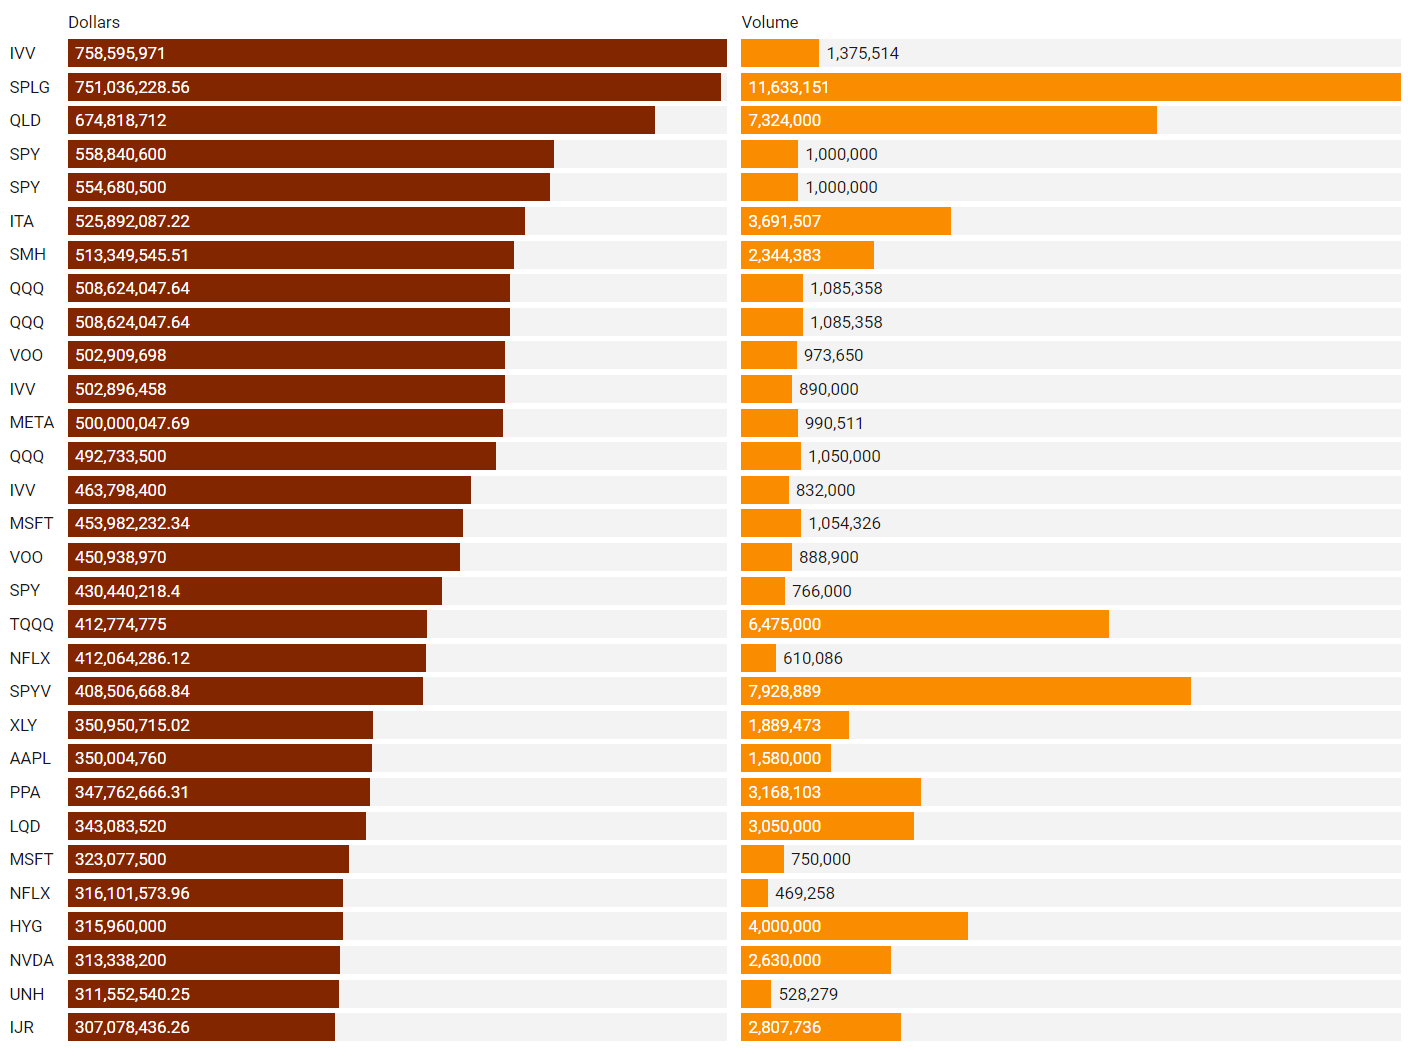
Largest Individual Dark Pool Blocks by Dollars
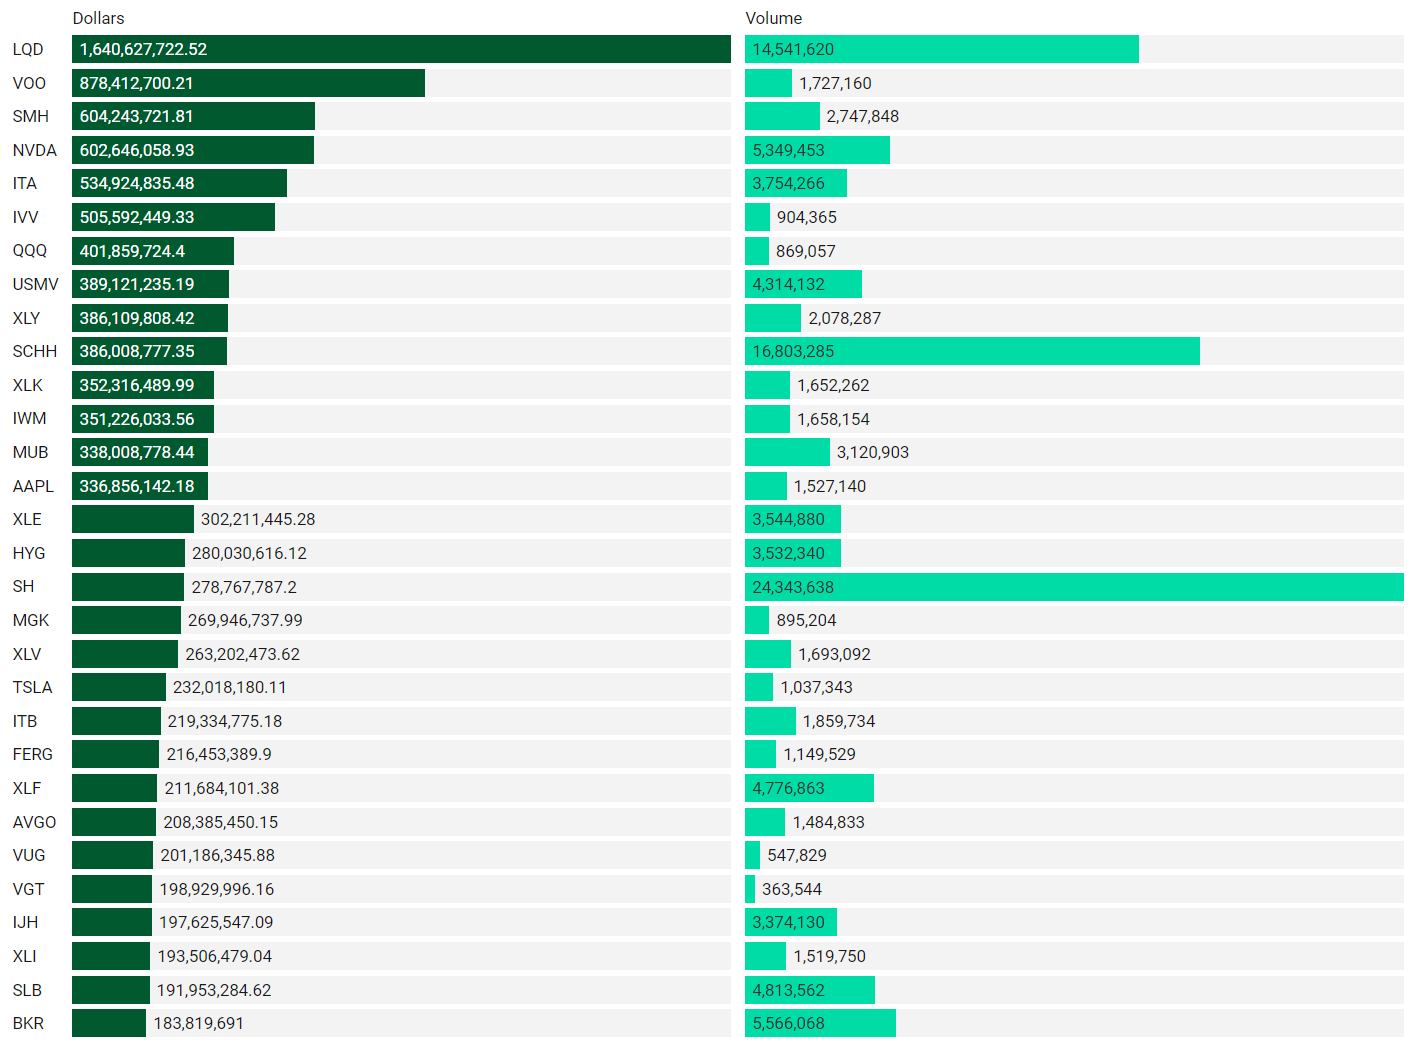
Top Aggregate Sweeps by Ticker
Top Individual Sweeps by Dollars Transacted
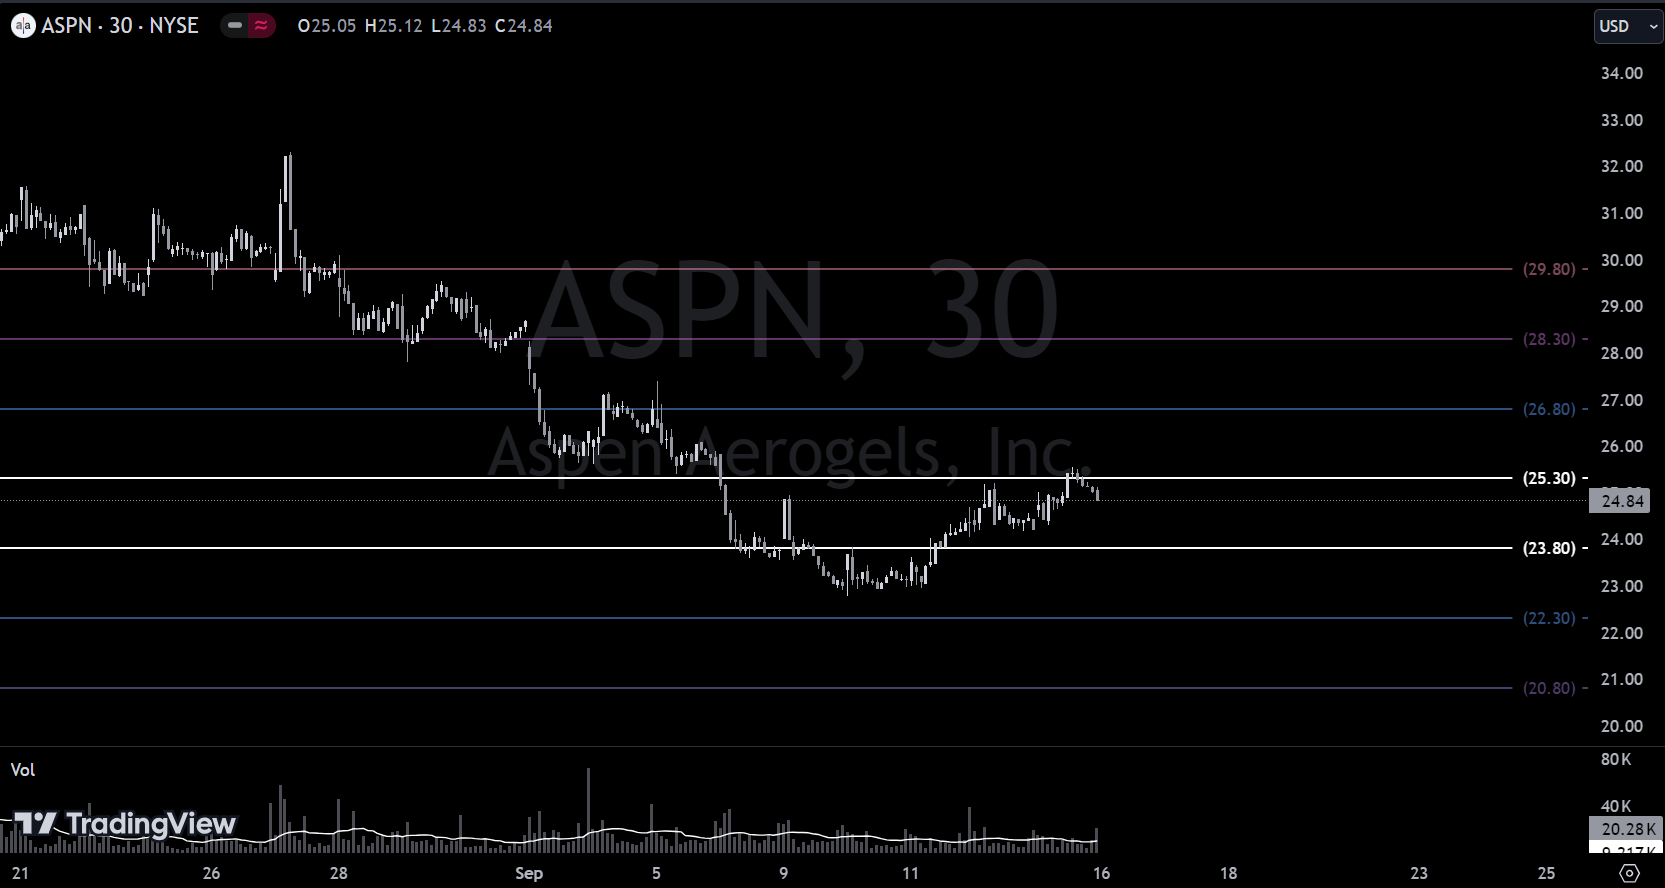
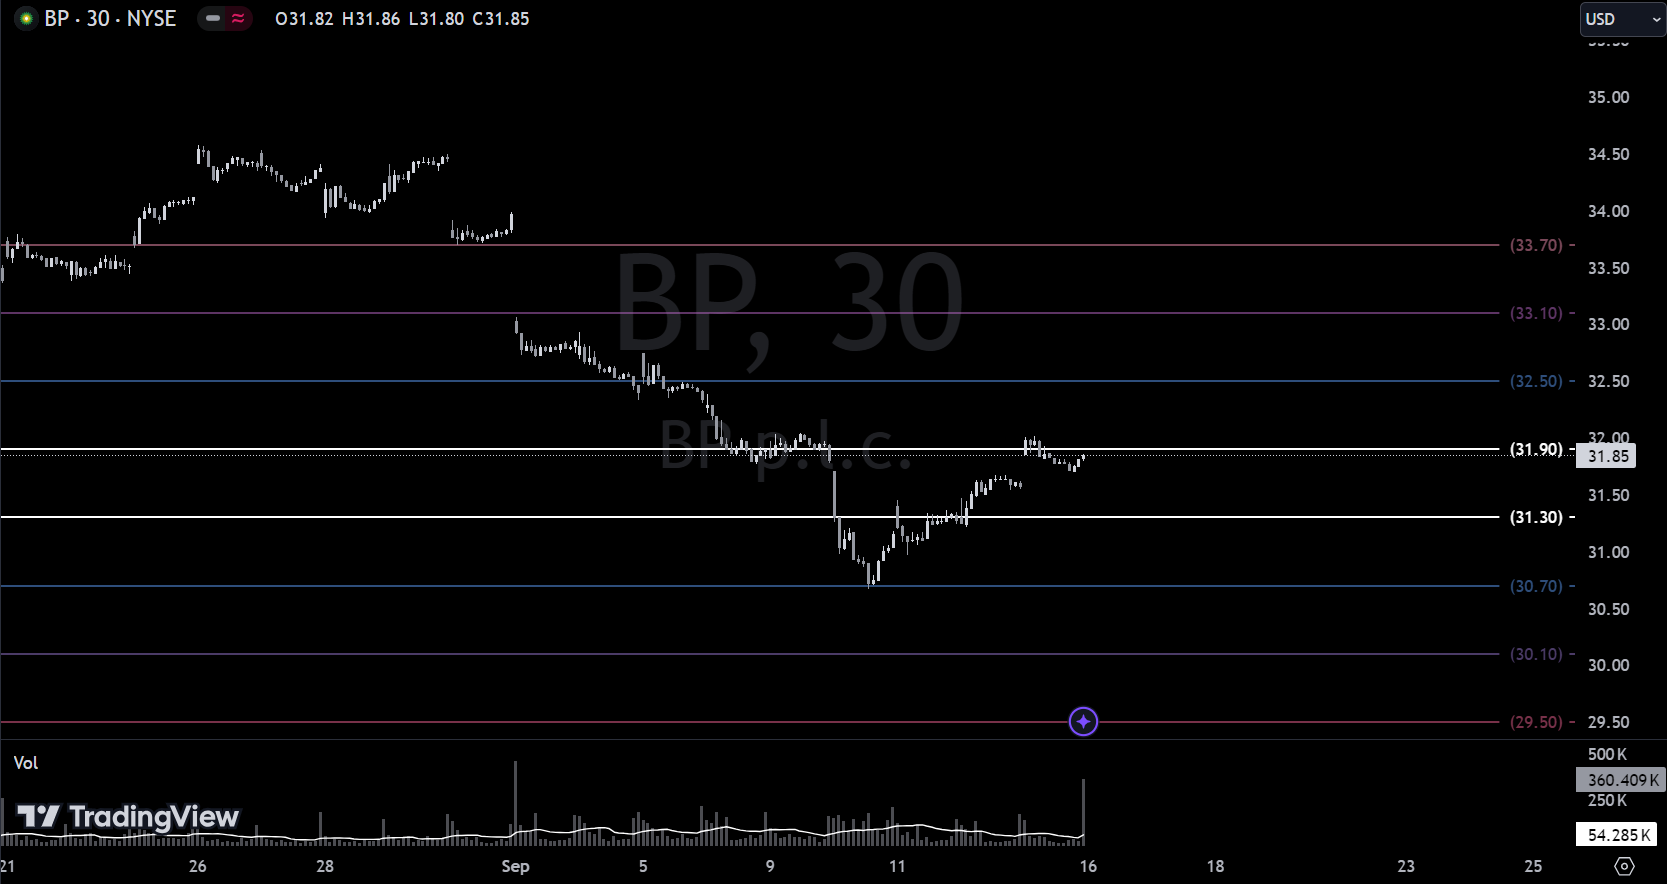
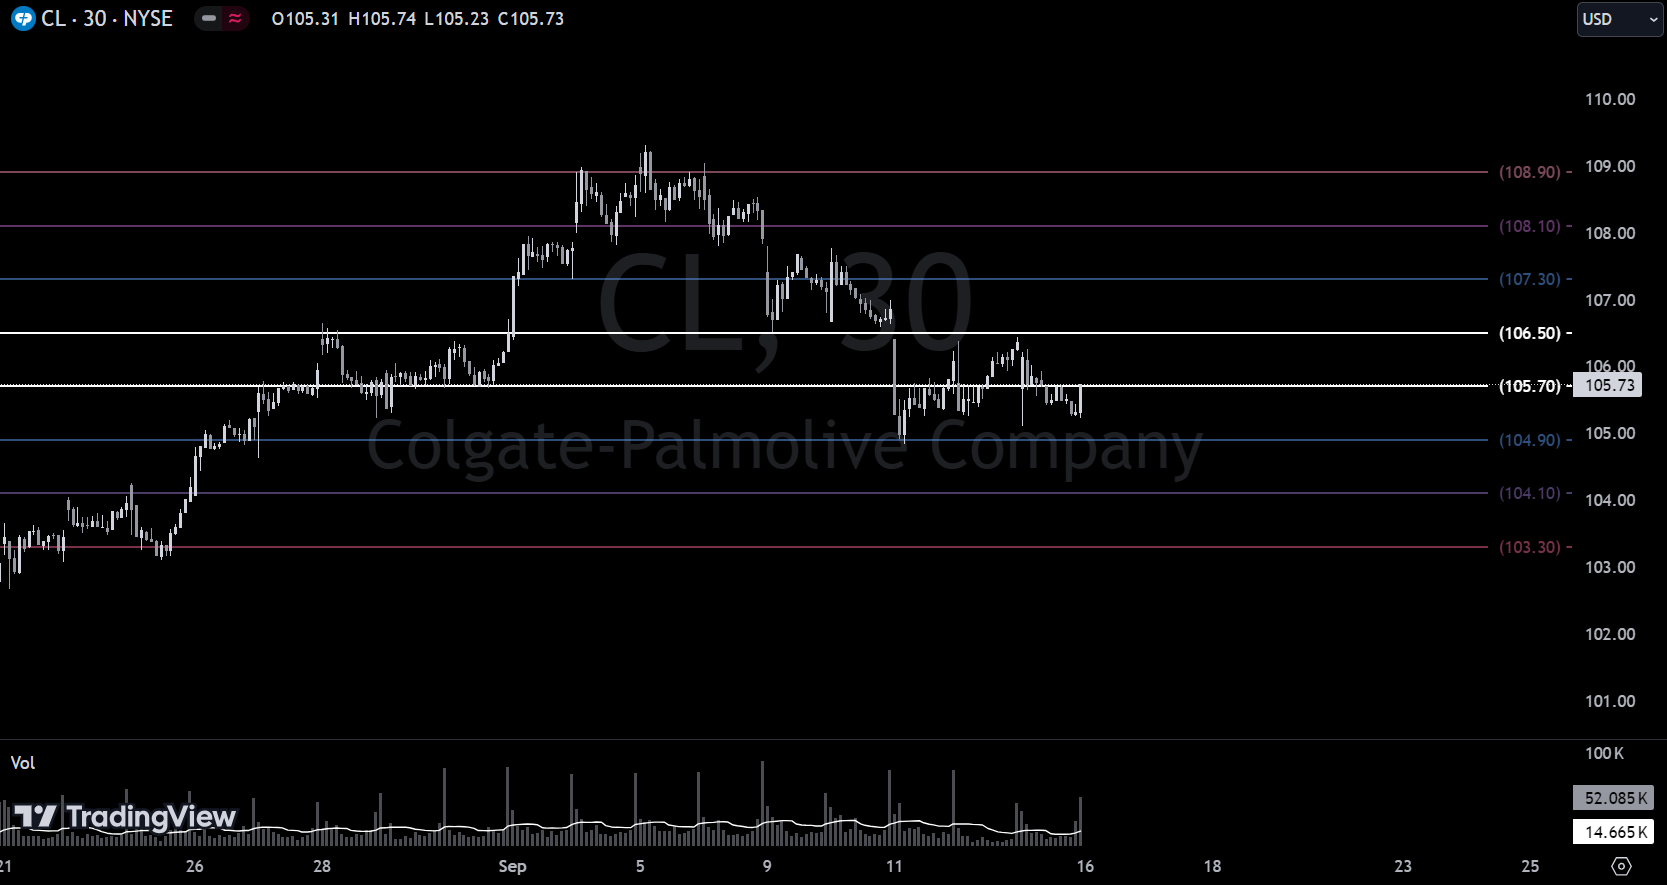
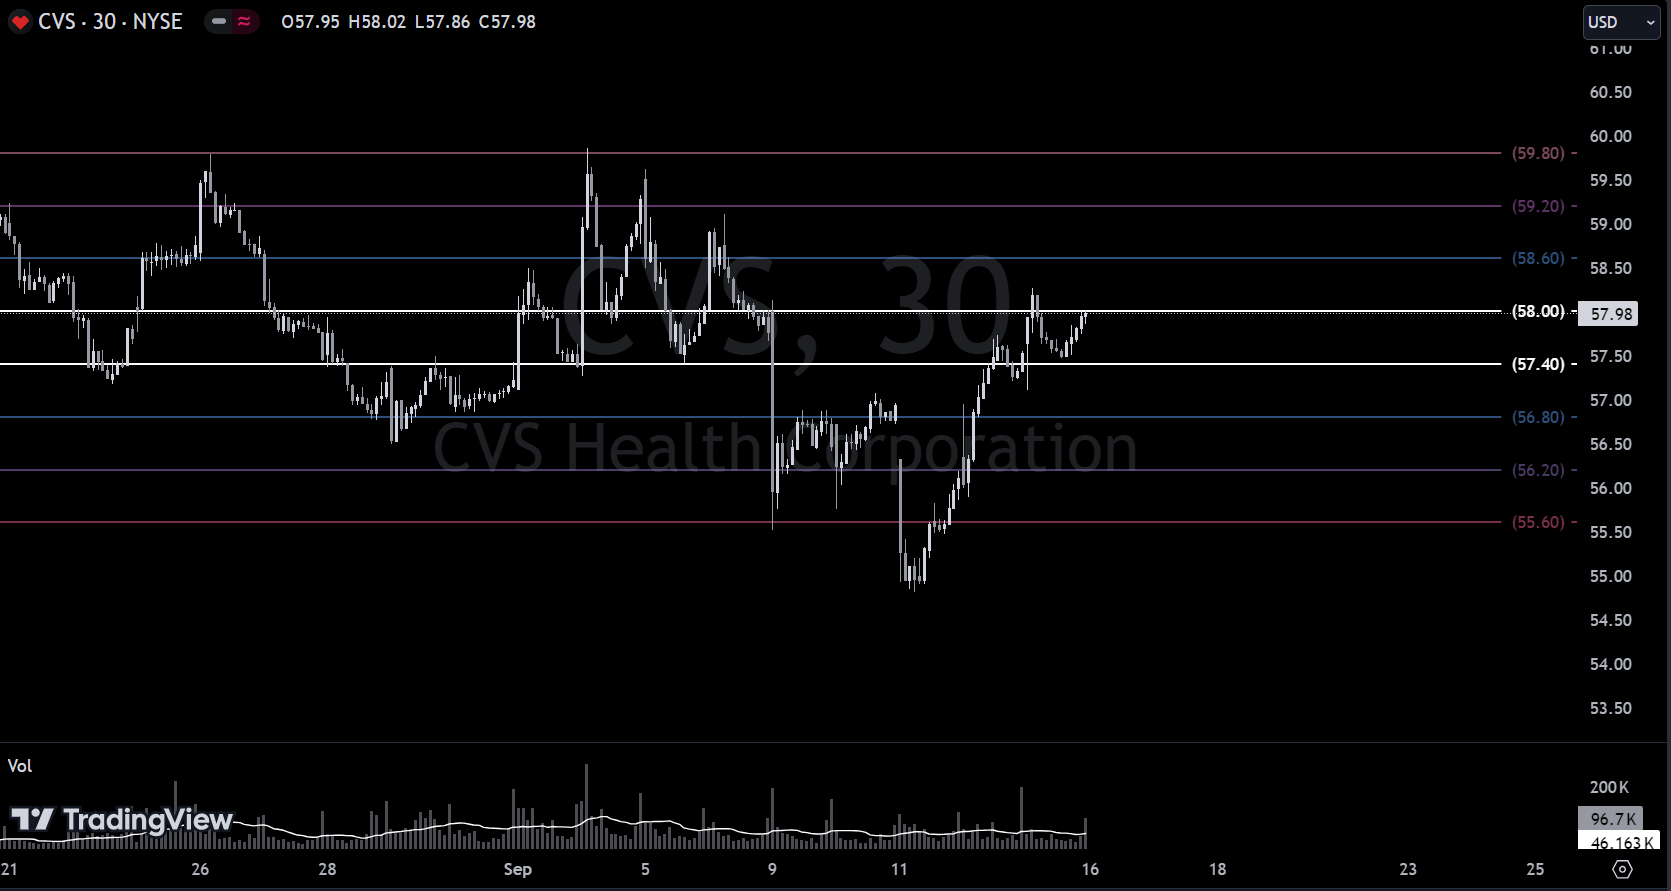
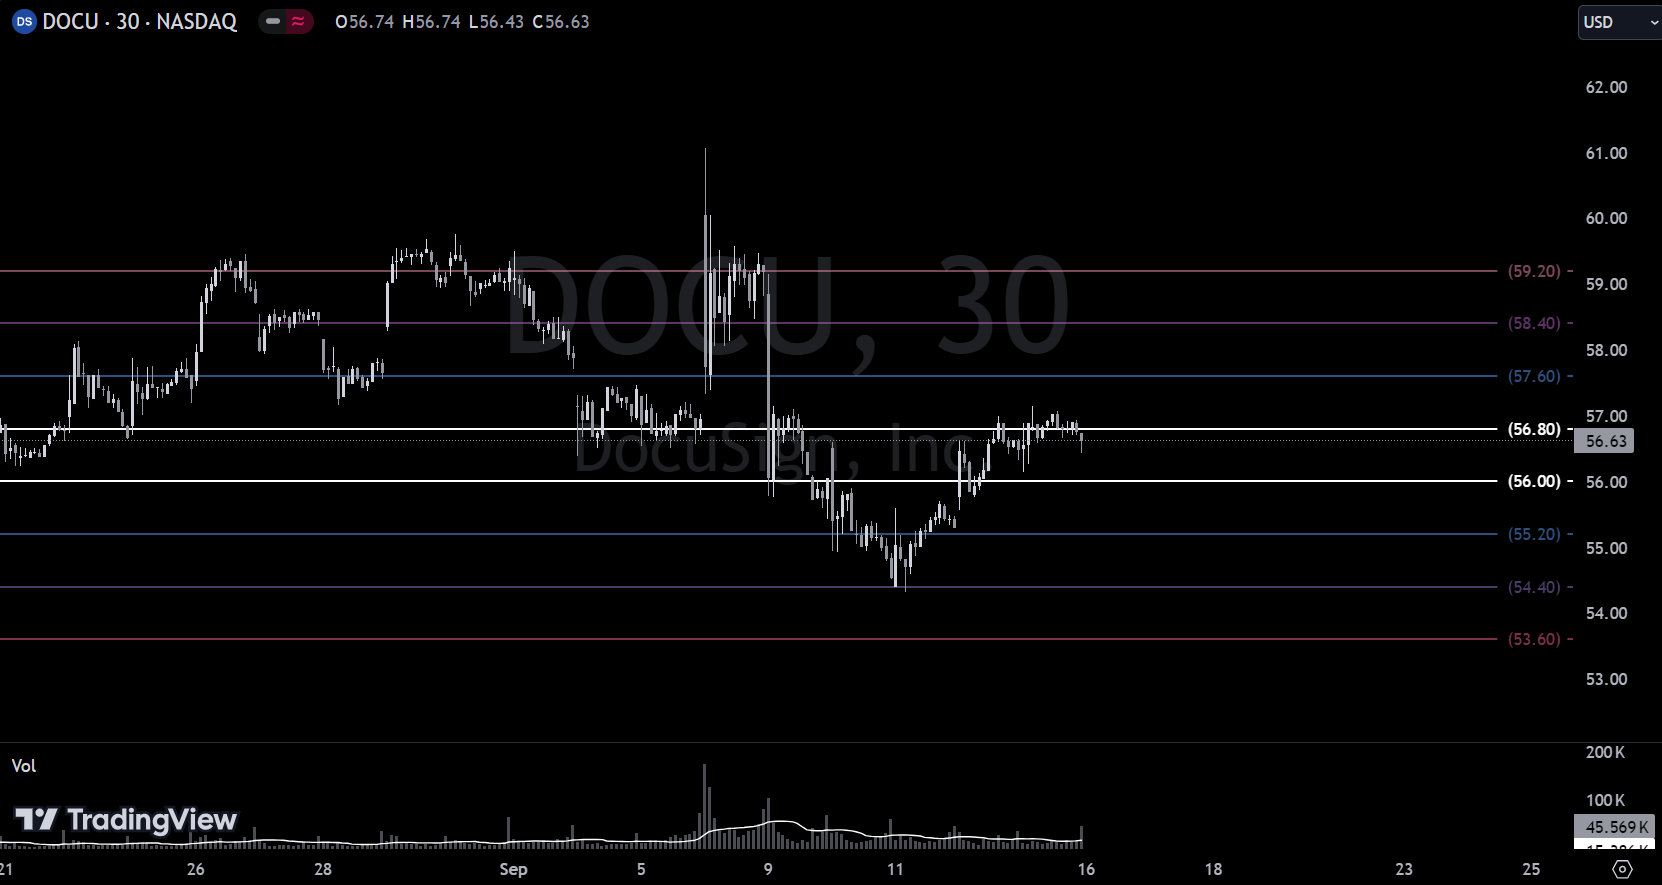
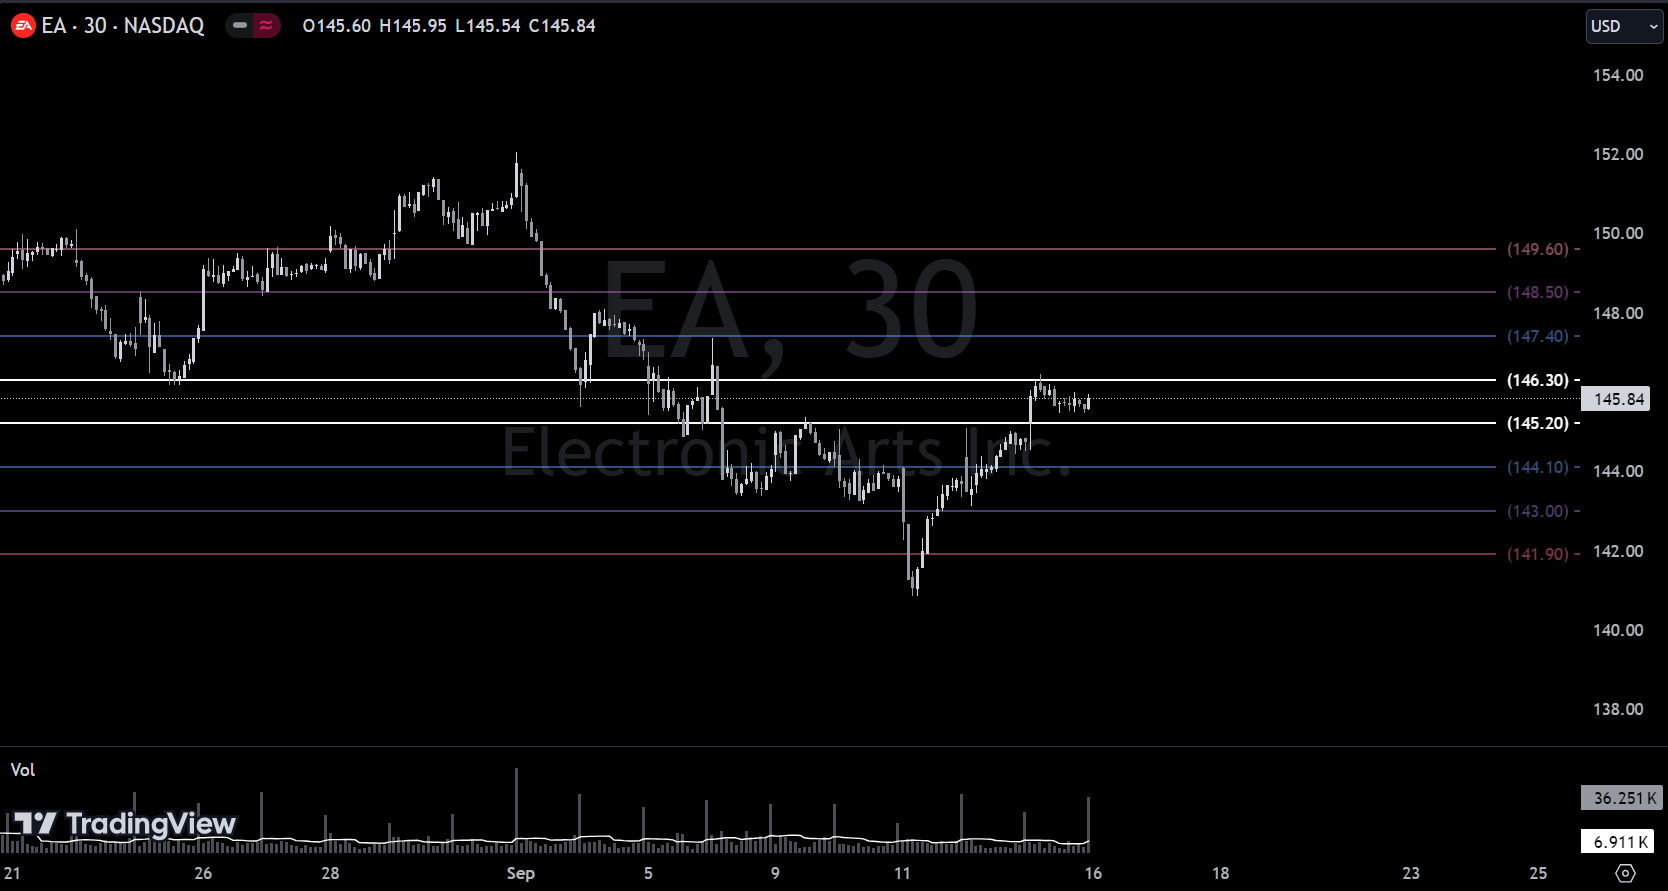
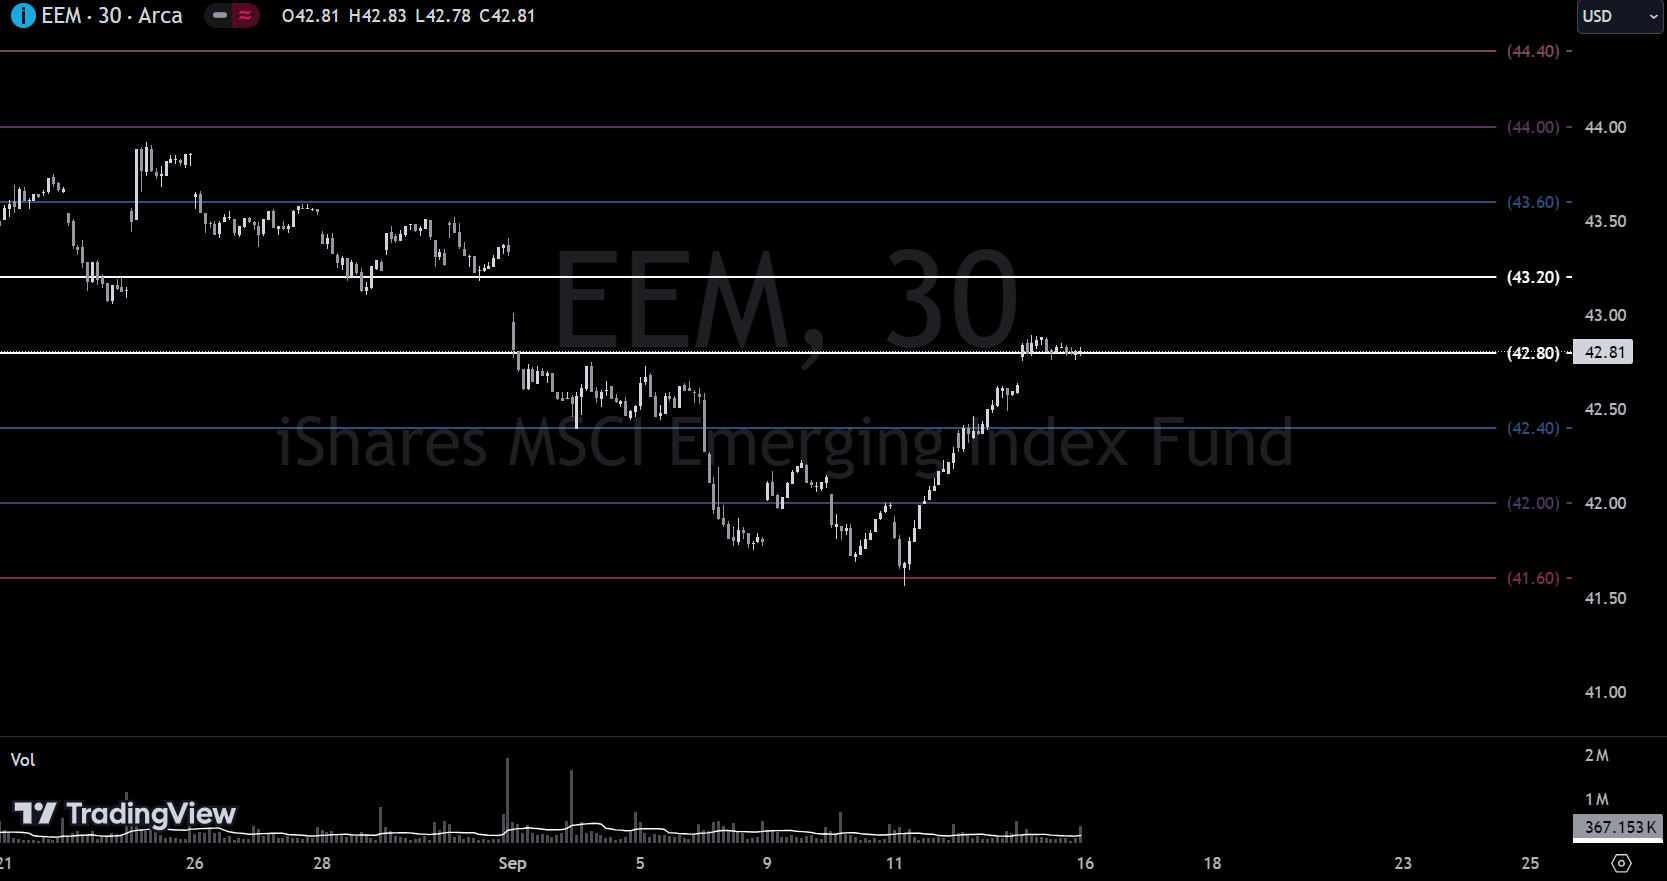
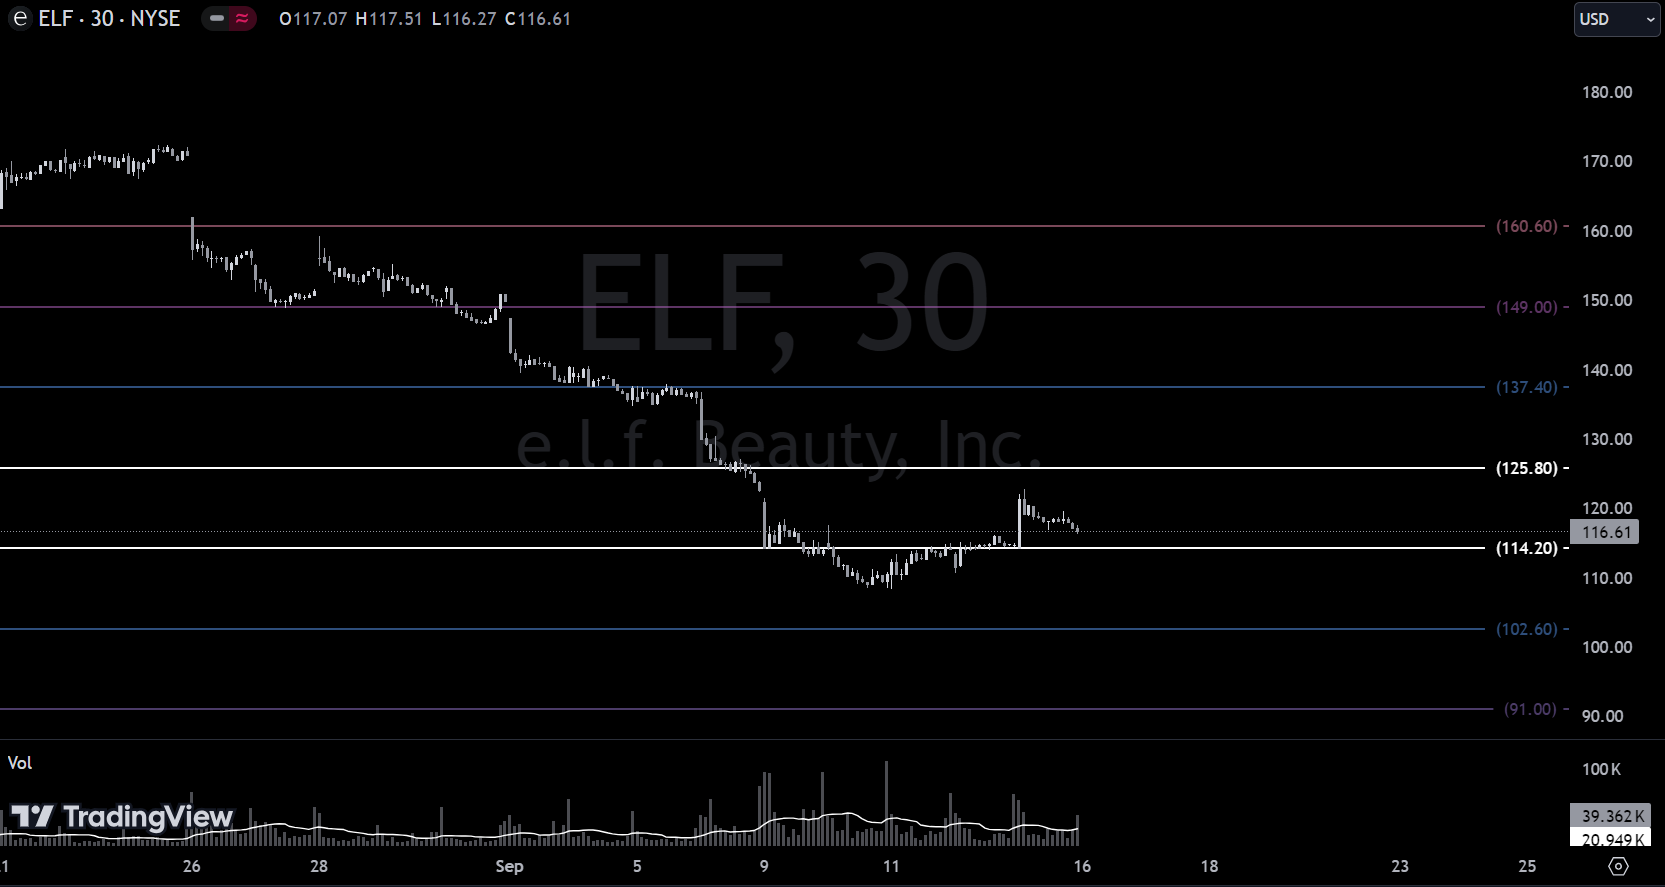
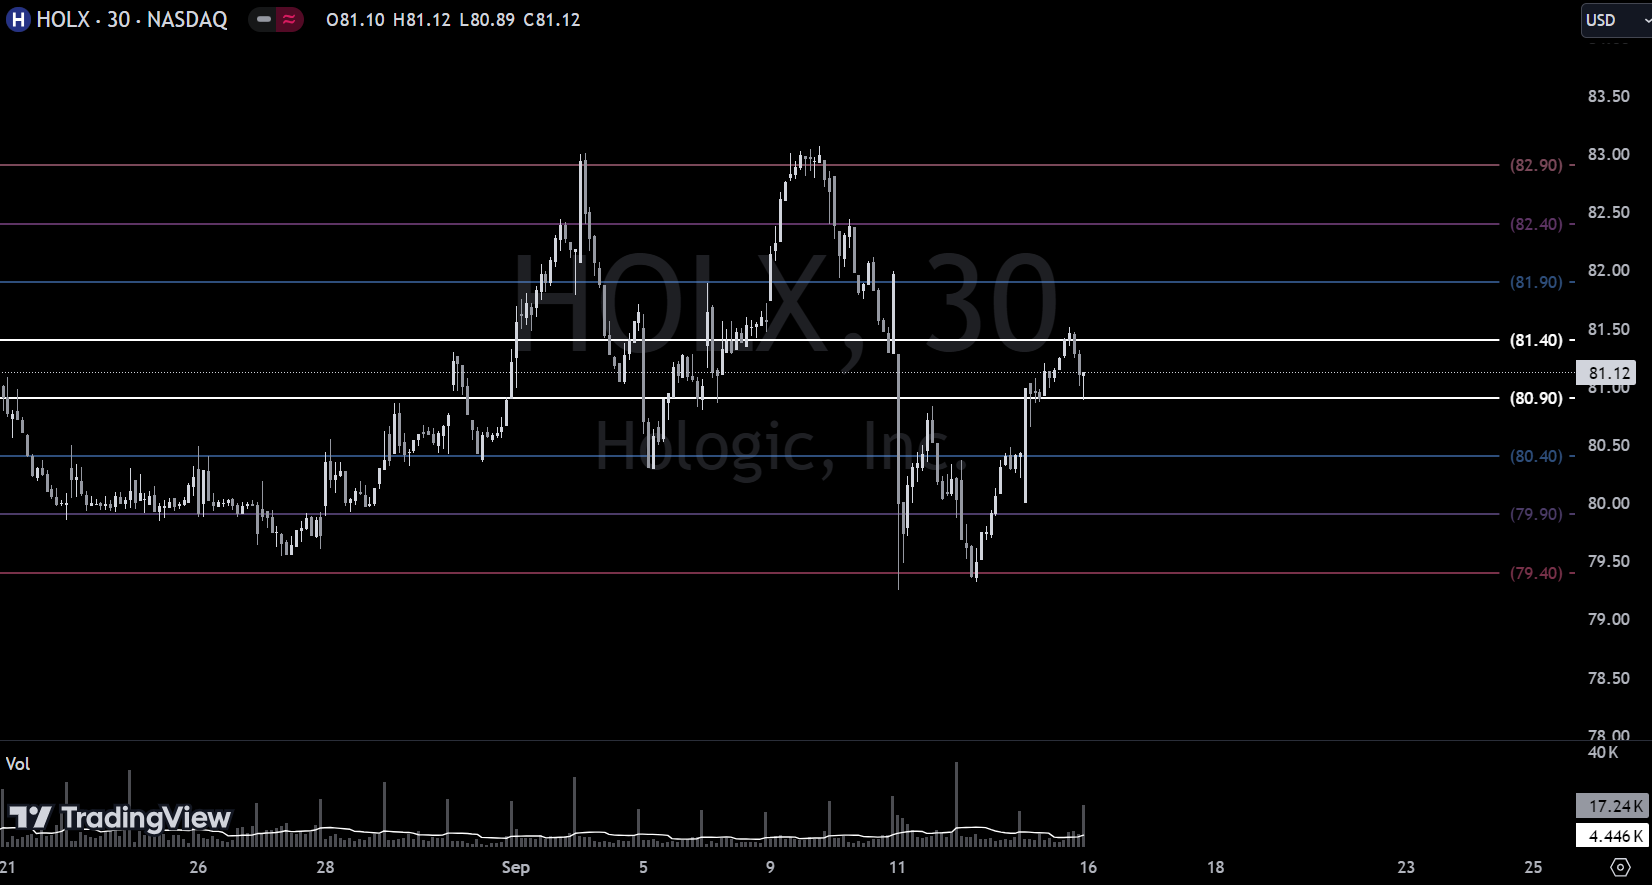
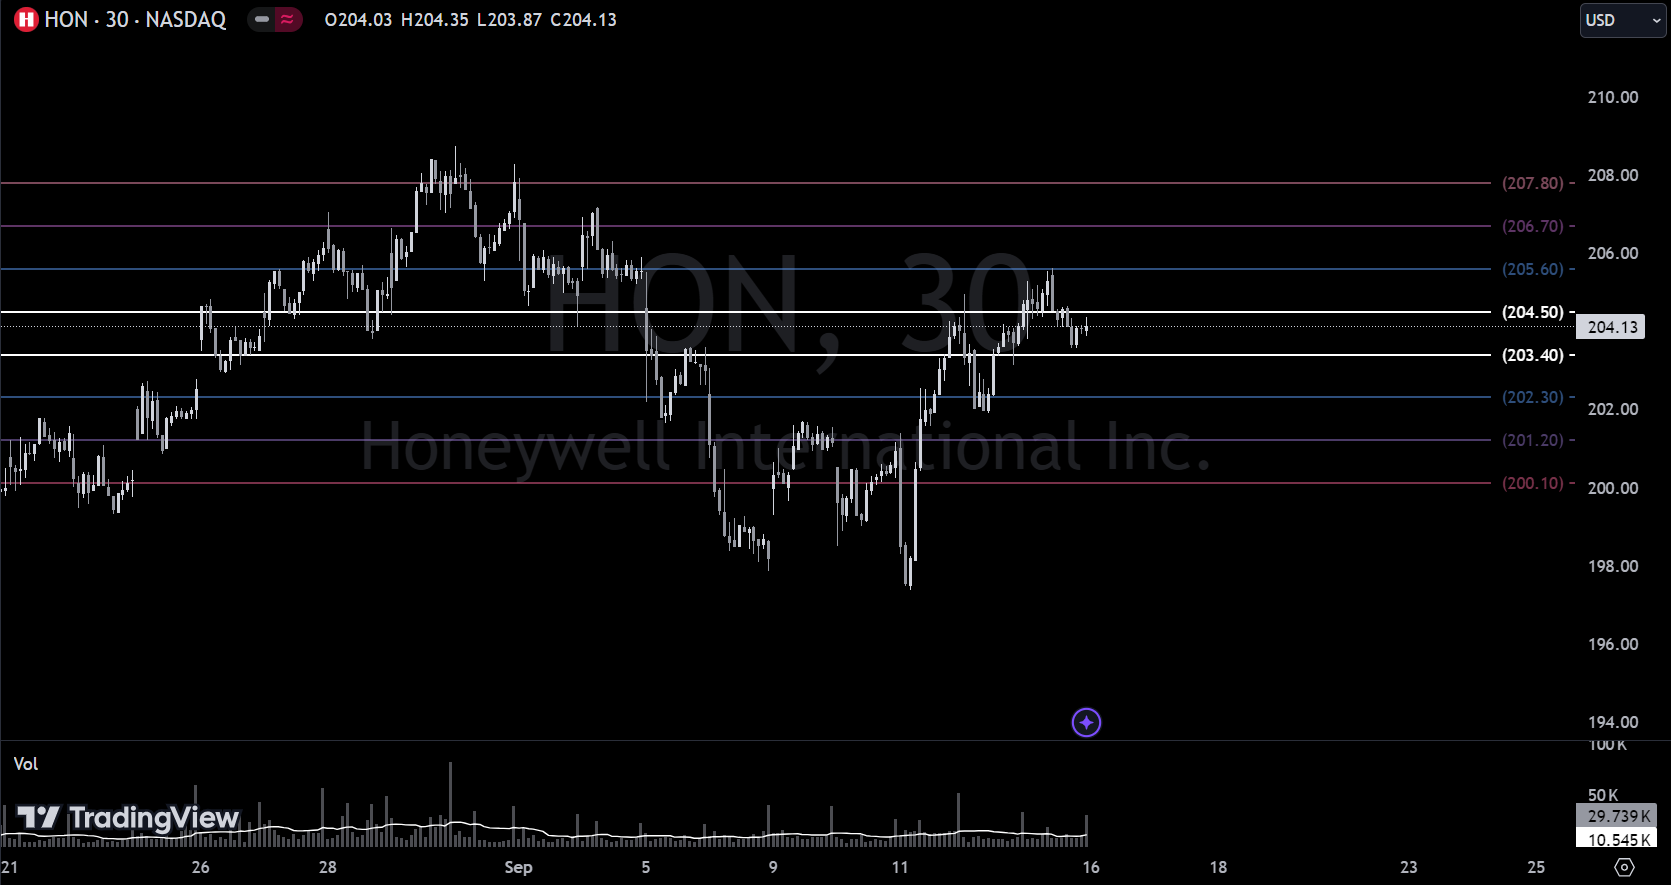
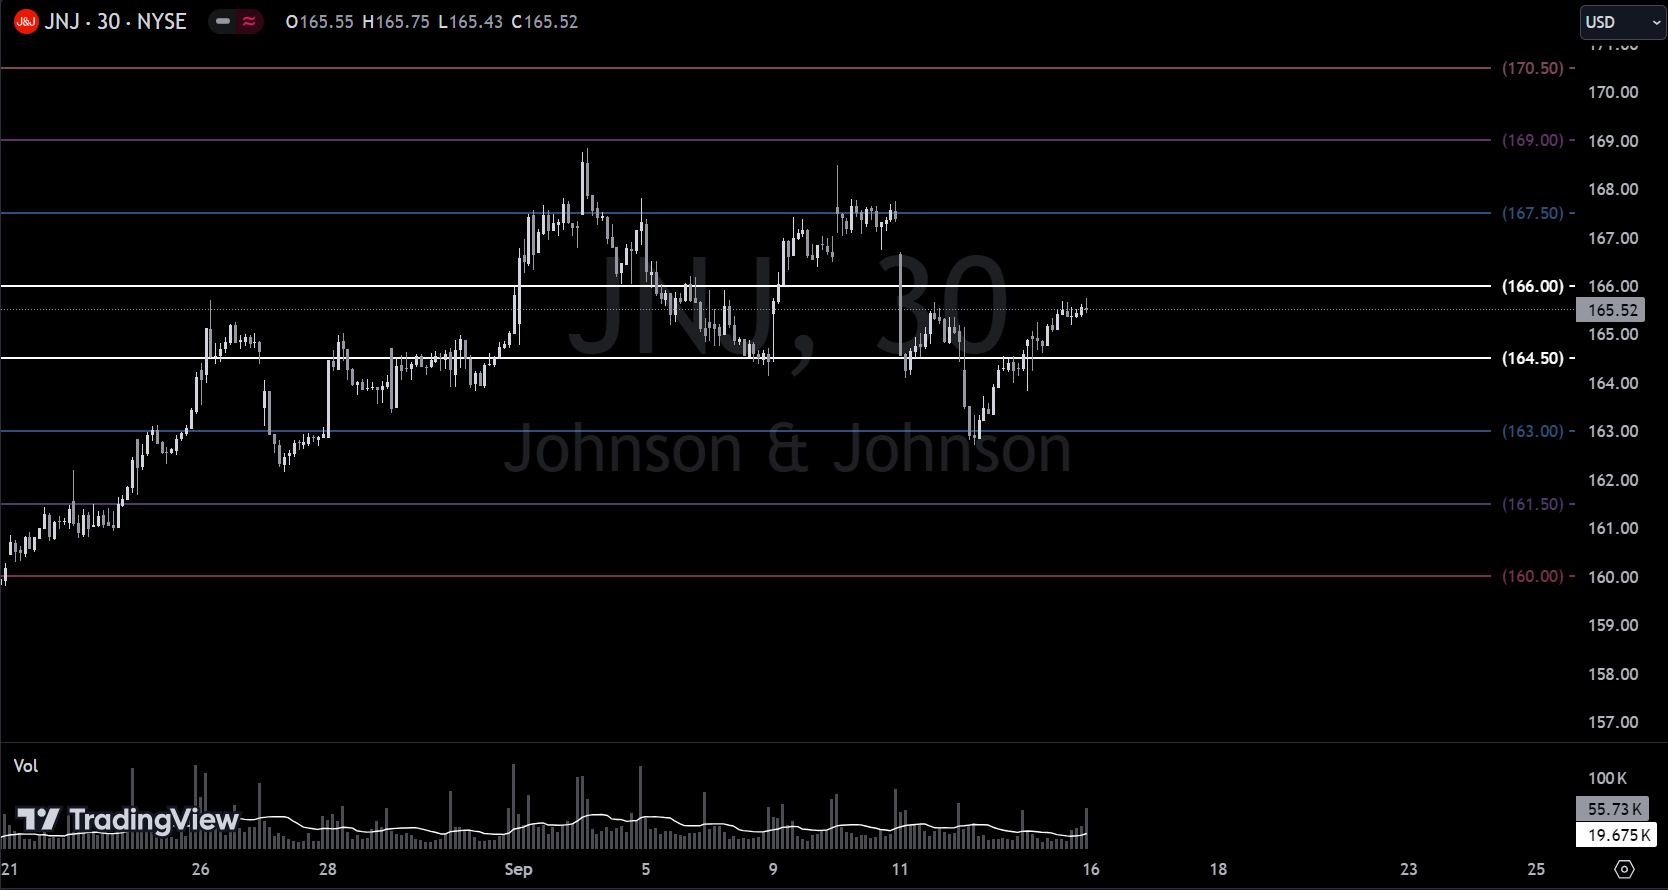
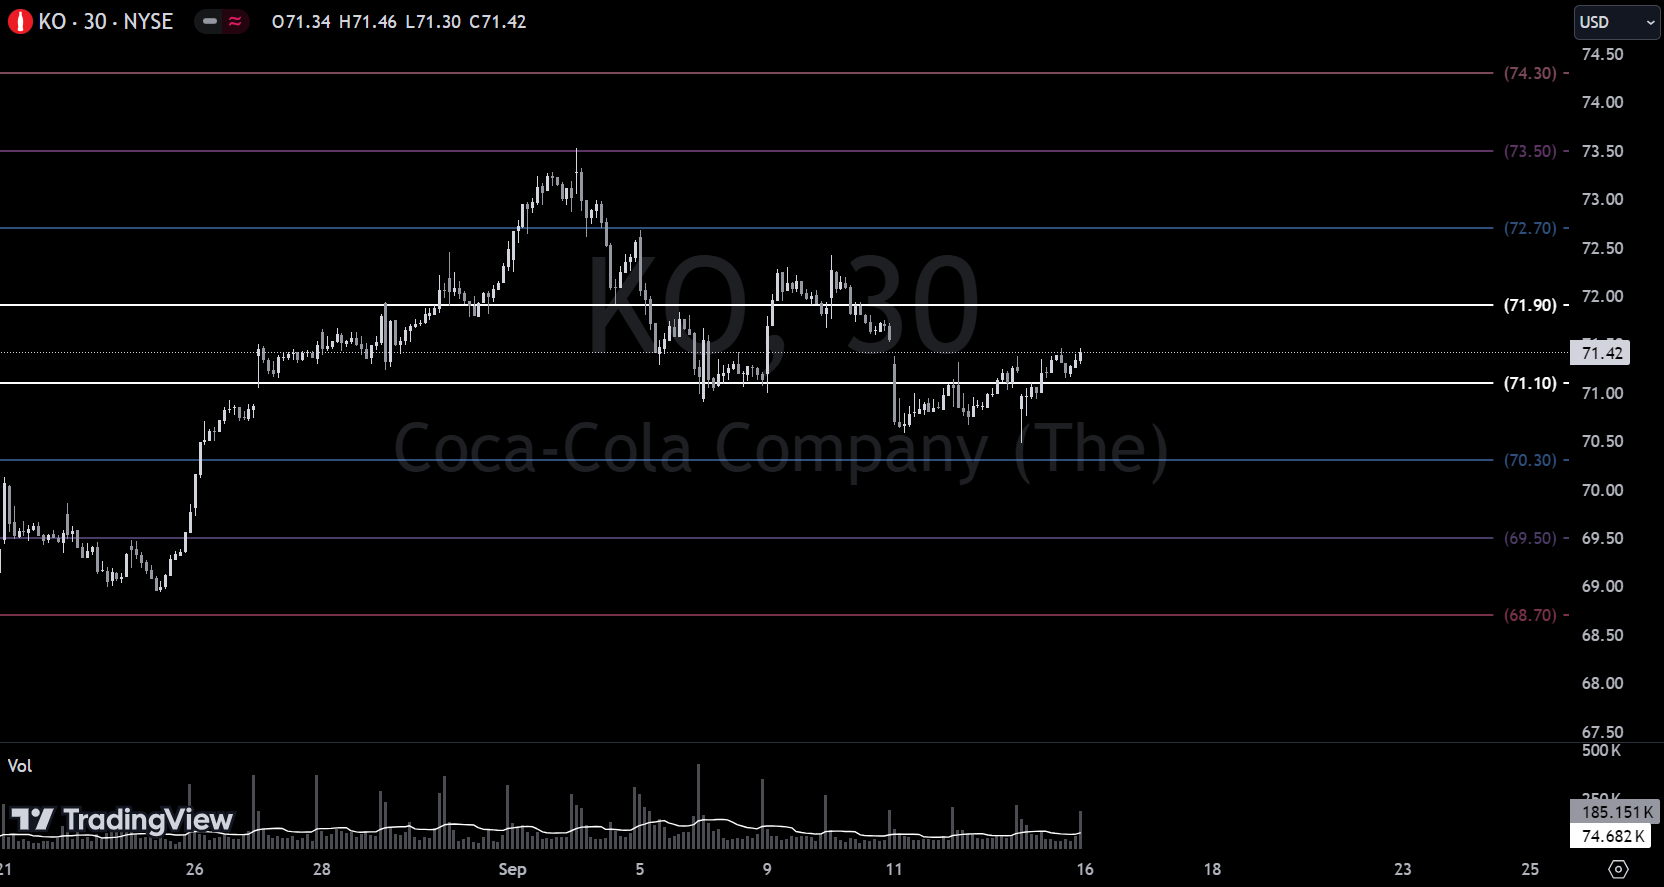
Institutional S/R Levels for Individual Tickers
Please read “Institutional S/R Levels For Major Indices” at the top of this stack to understand the nature and importance of what we’re looking at here visually. Institutions leave footprints that VL can illustrate for you while providing context to assess things like institutional conviction and urgency.
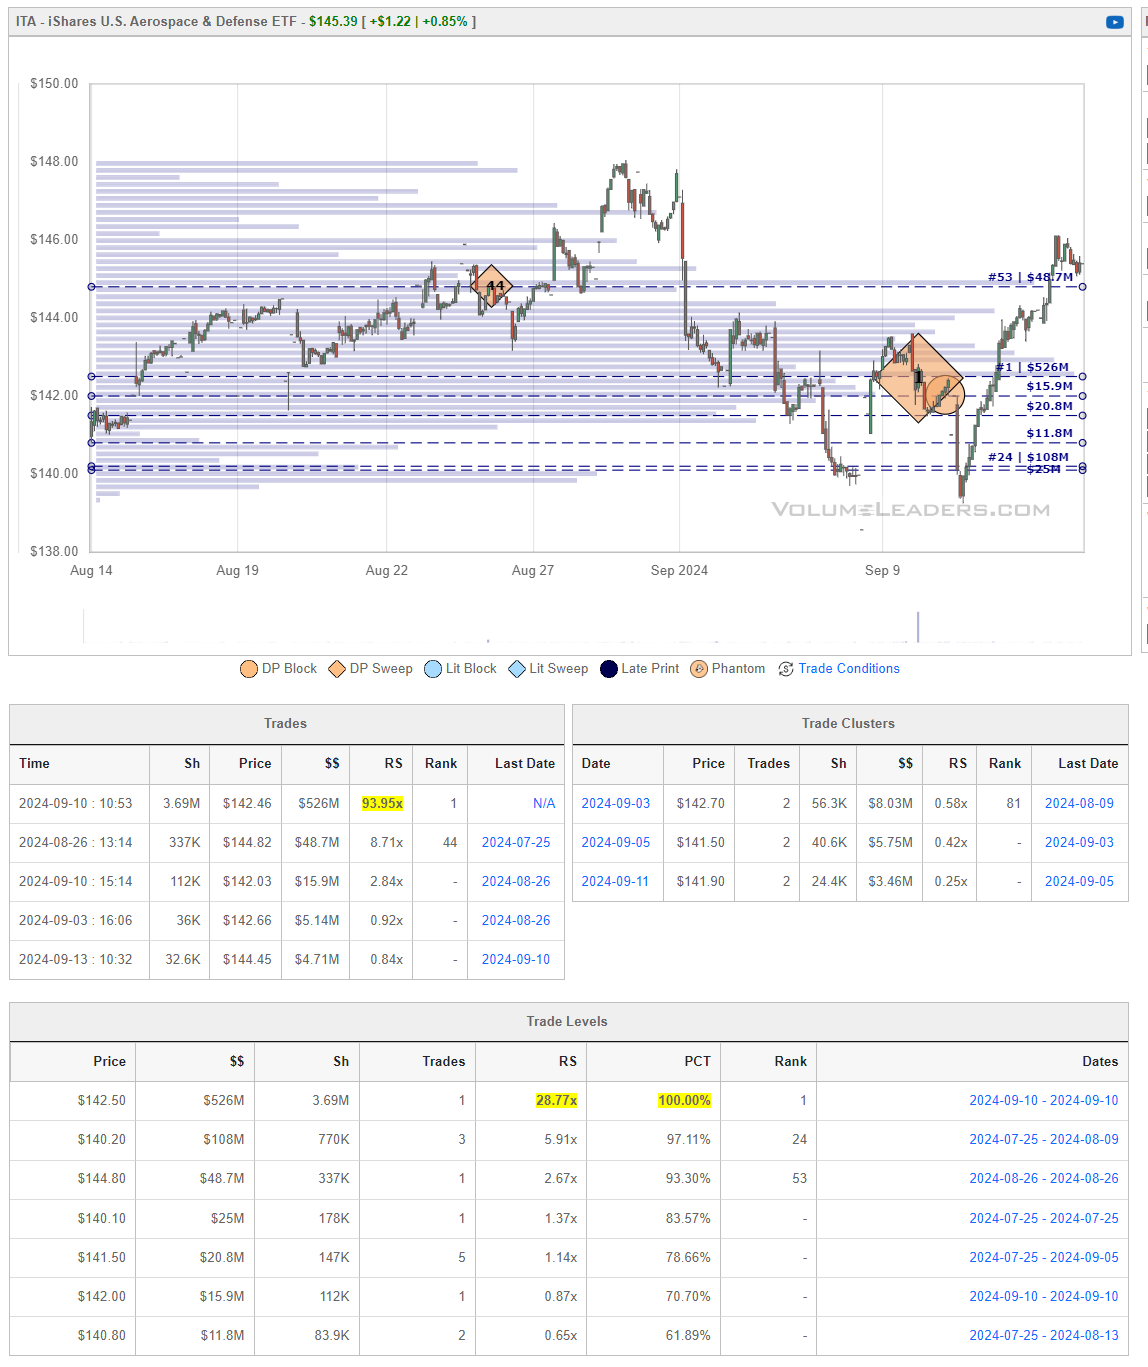
ITA represents the iShares U.S. Aerospace & Defense ETF, which tracks the performance of the Dow Jones U.S. Select Aerospace & Defense Index. This ETF focuses on U.S. equities in the aerospace and defense sector, including companies involved in manufacturing aircraft, defense equipment, and related services.
Number of Holdings: 35 companies as of September 2024.
Top Holdings: Some of its largest components include major defense contractors like Boeing, Lockheed Martin, Raytheon, and Northrop Grumman.
P/E Ratio: 33.27 as of September 2024, which reflects higher valuation levels in the sector
Sector Focus: The ETF is designed for investors looking to gain exposure to the aerospace and defense industry, which benefits from both government defense spending and commercial aerospace growth.
Performance: ITA has seen significant growth, often benefiting from increased defense budgets and global aerospace demand, although it can be impacted by specific industry news, such as Boeing's production issues
ITA caught a new #1-ranked trade on Tuesday. The relative positioning of institutions does not look unlike major indices.
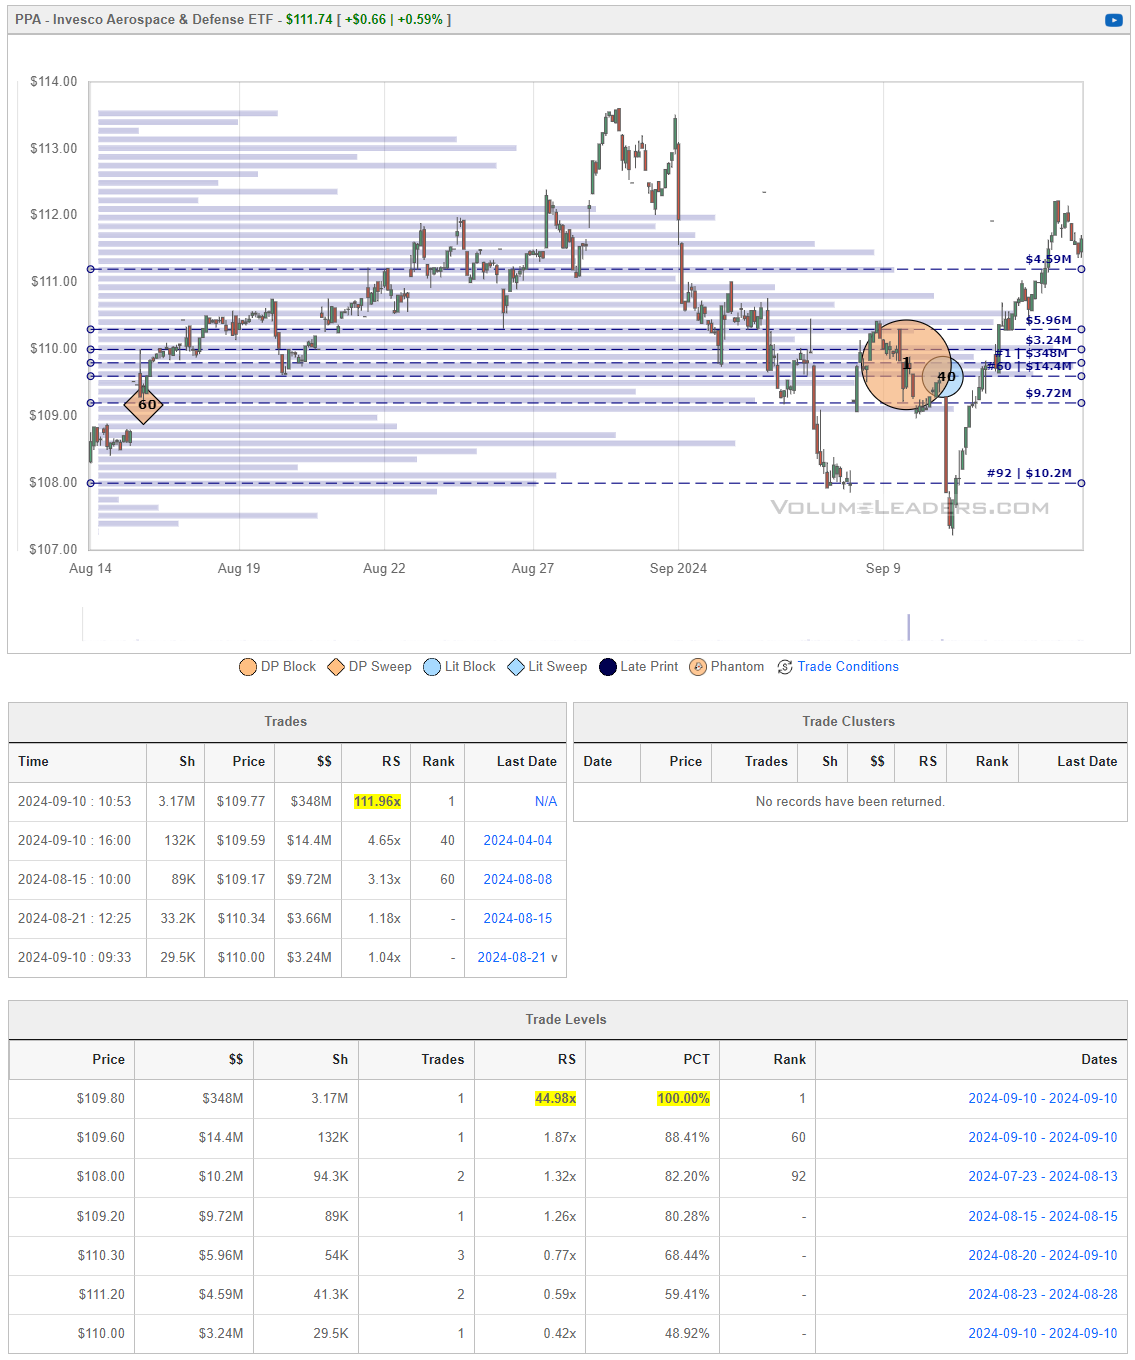
The Invesco Aerospace & Defense ETF (PPA) is an exchange-traded fund that provides exposure to the aerospace and defense sector. The fund is designed to track the performance of the SPADE Defense Index, which focuses on companies involved in the development, manufacturing, and support of defense, military, homeland security, and aerospace operations. Here are some key details:
Assets Under Management: Approximately $3.6 billion
Expense Ratio: 0.58%
Top Holdings: The largest components include companies like Lockheed Martin (LMT), RTX Corp (RTX), GE Aerospace (GE), Boeing (BA), and Northrop Grumman (NOC).
Performance: The ETF has demonstrated strong long-term performance, often benefiting from increased defense spending and global demand for aerospace technology.
PPA is particularly attractive for investors looking to capitalize on defense spending, which has shown resilience due to ongoing geopolitical tensions and defense contracts. Like ITA, this ticker also saw a new #1-ranked trade on Tuesday…
The iShares U.S. Home Construction ETF (ITB) is an exchange-traded fund (ETF) that seeks to track the performance of the Dow Jones U.S. Select Home Construction Index, which is composed of U.S. equities in the home construction sector. This includes companies involved in home construction, home improvement, and furnishing.
Assets Under Management: Approximately $3.6 billion as of September 2024
Holdings: 44 companies
Top Holdings: Some of its major holdings include companies like D.R. Horton (DHI), Lennar Corp (LEN), NVR Inc (NVR), and PulteGroup Inc (PHM).
Expense Ratio: 0.41%
Performance: ITB has shown robust performance over the years, with significant returns in periods of housing market strength. For example, it had a total return of 68.83% in 2023 after a decline in 2022 due to market conditions.
ITB provides exposure to the housing market and is influenced by factors such as interest rates, home sales data, and overall economic growth. It's suitable for investors looking to capitalize on the housing and construction industry's growth.
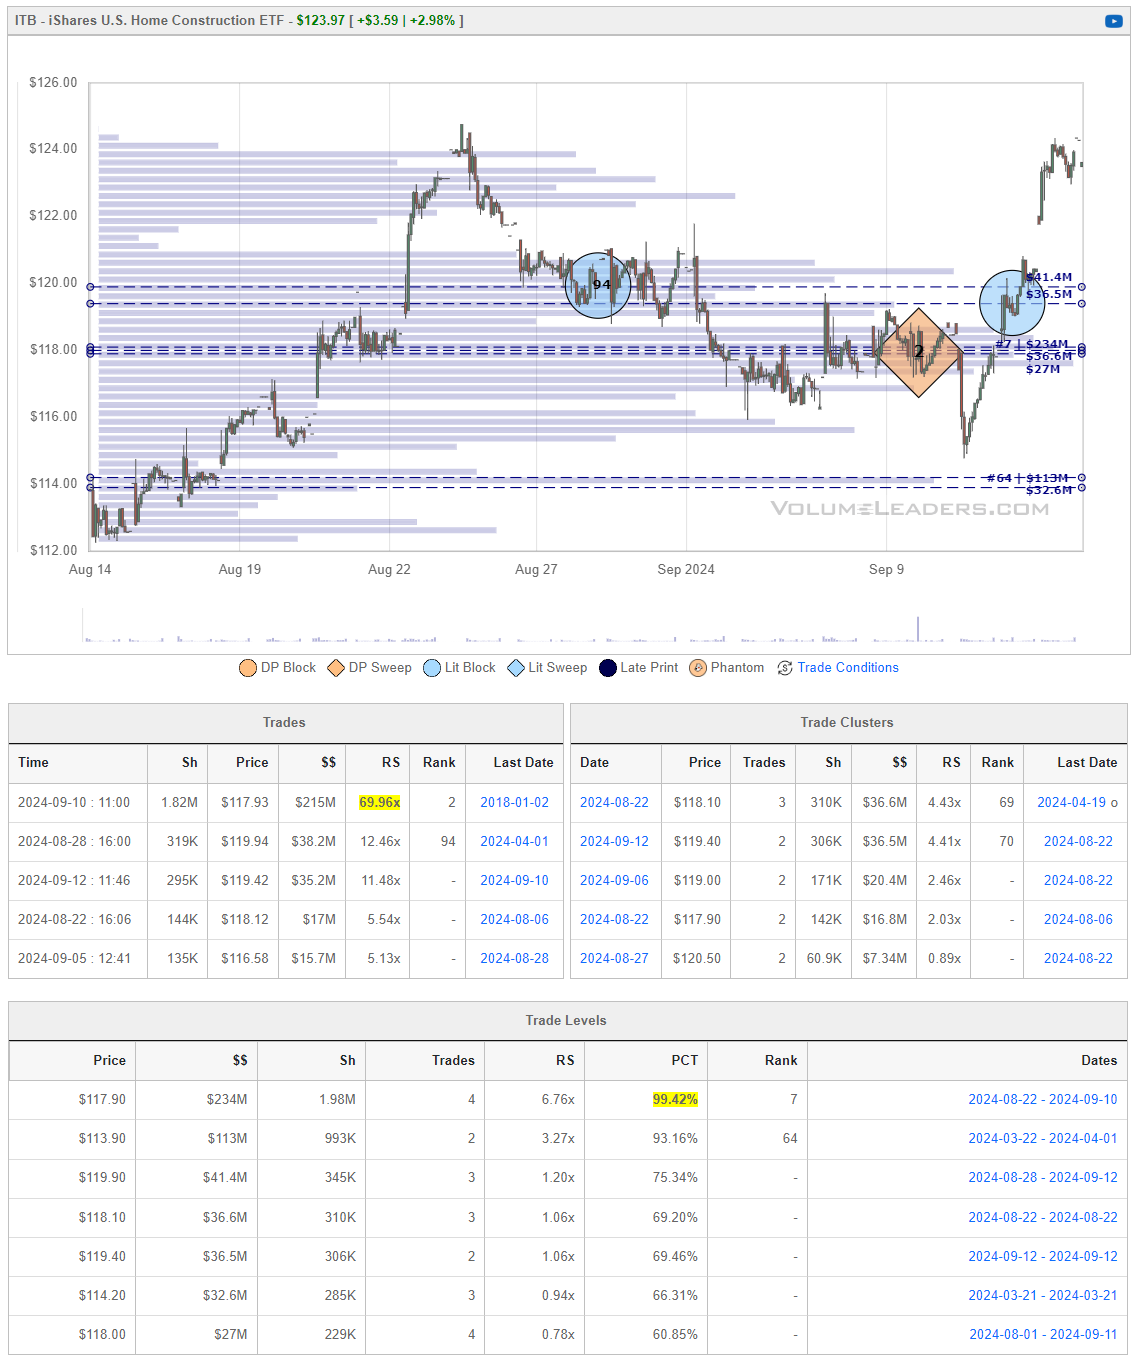
There is a compelling thesis for investing in the ITB if the Federal Reserve is about to cut interest rates. Here are key factors that support this thesis:
1. Lower Interest Rates Boost Housing Demand
Housing Affordability: When the Fed cuts rates, mortgage rates typically decrease as well. Lower mortgage rates reduce borrowing costs, making homes more affordable for consumers. This boosts demand for new homes, which directly benefits homebuilders like D.R. Horton, Lennar, and other companies within ITB.
Increased Home Sales: As mortgages become cheaper, potential homeowners are more likely to buy, and existing homeowners may refinance, leading to increased home sales. Historically, homebuilder stocks perform well in such environments due to heightened sales activity.
2. Homebuilder Margins Improve
Reduced Costs of Borrowing: Many homebuilders rely on financing to operate their projects. Lower borrowing costs for companies mean they can take on more projects at a reduced cost, improving profitability. This can positively impact their margins and earnings, which is favorable for the companies in ITB.
Increased Consumer Confidence: A rate cut by the Fed often signals an attempt to stimulate economic growth, boosting consumer confidence. Homebuilding companies, as part of the broader economy, typically see higher demand as consumer sentiment improves.
3. Cyclicality of the Housing Market
Housing as a Cyclical Sector: The housing market is highly cyclical, meaning that it tends to benefit significantly when the economy is in recovery or expansion mode—typically after a rate cut. Lower rates often coincide with the Fed’s attempt to spur economic activity, making sectors like home construction attractive investments.
4. ITB’s Sensitivity to Interest Rates
Rate Sensitivity of Homebuilder Stocks: Companies in the home construction sector are highly sensitive to interest rate movements. Historically, ETFs like ITB tend to outperform during periods of falling rates due to the direct correlation between interest rates and home demand.
Diversified Exposure to Housing: By investing in ITB, you gain diversified exposure to leading U.S. homebuilders, home improvement companies, and materials suppliers. This diversification helps mitigate risk while positioning for growth during a period of falling rates.
5. Historical Performance During Rate Cuts
Strong Historical Returns in Low-Rate Environments: During previous periods when the Fed cut rates, home construction ETFs and stocks have performed well. For instance, ITB delivered substantial returns in 2019 when the Fed cut rates amid slowing global growth.
Potential Risks:
Economic Weakness: If the Fed is cutting rates due to economic weakness, this could temper demand for housing despite lower rates.
Inflation: If inflation remains high, it could limit how much the Fed can cut rates, affecting the housing sector's ability to benefit fully from rate reductions.
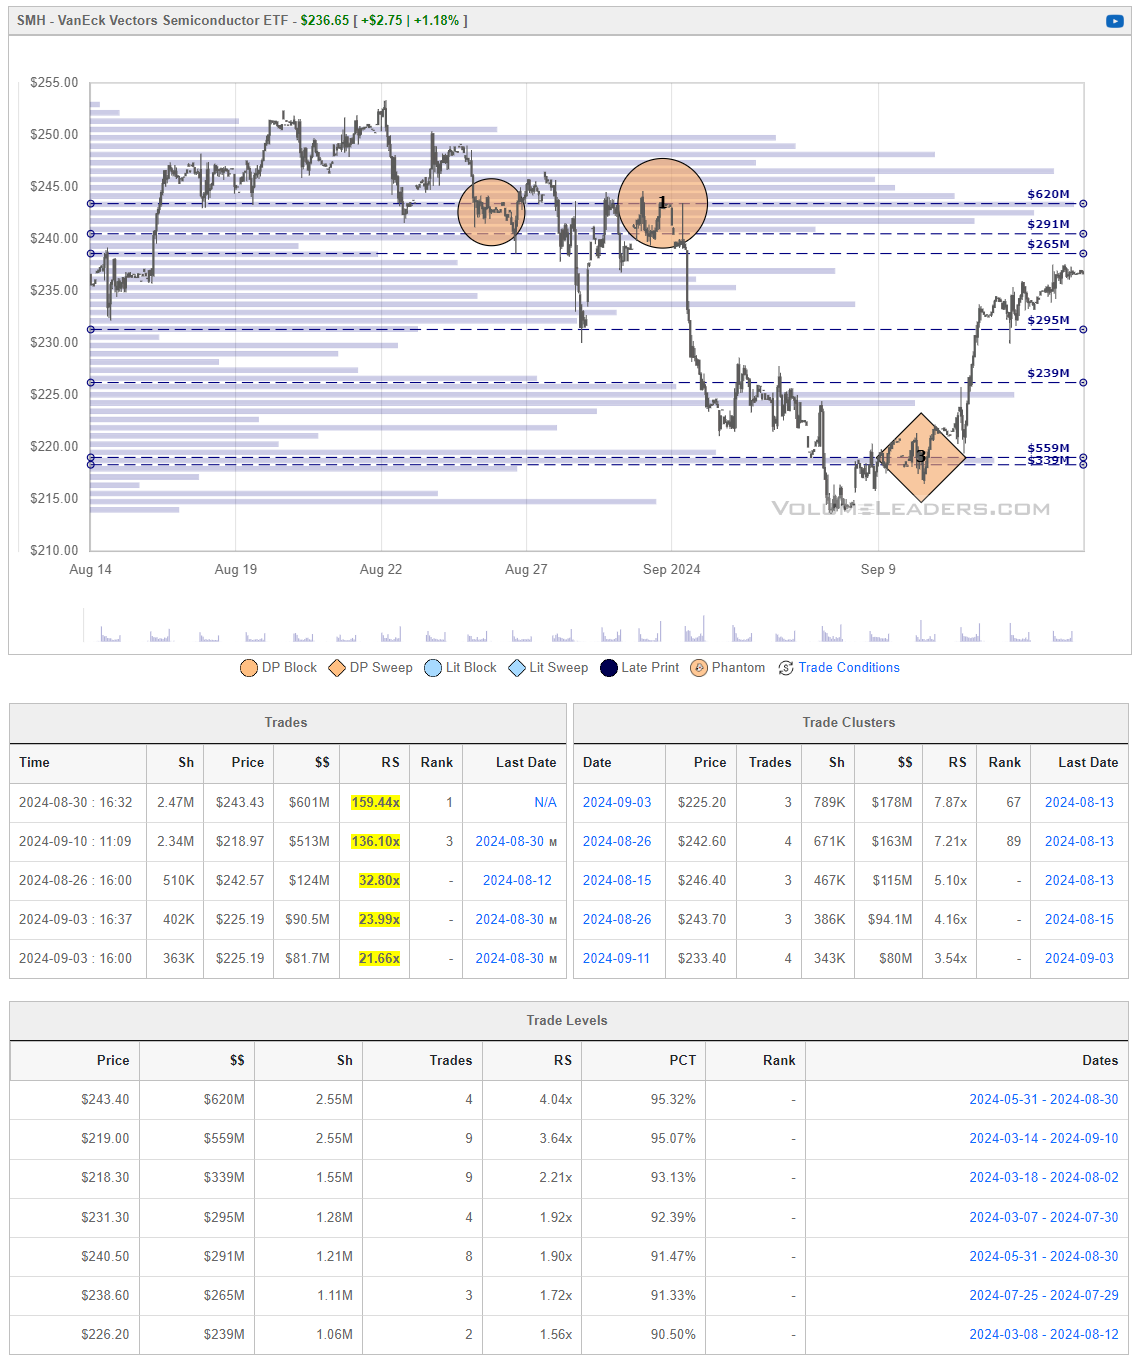
The VanEck Semiconductor ETF (SMH) is an exchange-traded fund that tracks the performance of the MVIS US Listed Semiconductor 25 Index, which includes companies involved in the production of semiconductors and semiconductor equipment. This ETF provides exposure to a broad range of semiconductor companies that are critical to the tech industry, making it a popular choice for investors looking to gain from the growth in the semiconductor sector.
Top Holdings: Some of the largest holdings in SMH include Nvidia (NVDA), Taiwan Semiconductor (TSM), Broadcom (AVGO), Texas Instruments (TXN), and AMD (AMD), which together account for a significant portion of the fund's assets.
Expense Ratio: The ETF has an expense ratio of 0.35%, which is in line with other technology and industry-specific ETFs.
Assets Under Management: As of September 2024, SMH manages around $22.37 billion.
Performance: The fund has delivered strong returns, with a YTD return of 35.49% as of September 2024. Historically, SMH has shown significant growth driven by the increasing demand for semiconductors in everything from consumer electronics to AI and cloud computing.
Investors consider SMH a good option for exposure to both U.S. and global semiconductor giants, with companies in the fund coming from major tech hubs like the U.S., Taiwan, and the Netherlands.
VL subs saw institutions ring the bell at the top when August drew to a close and a new #1-ranked trade printed, putting this guy into a tailspin. This week we saw someone step-in and scoop up a sizeable chunk of inventory with a #3-ranked trade and the subsequent lift in price has paid this risk-taker well. Price is now trading into overhear inventory and closing-in on the #1 trade location. Tread carefully here.
VL Precision Swings
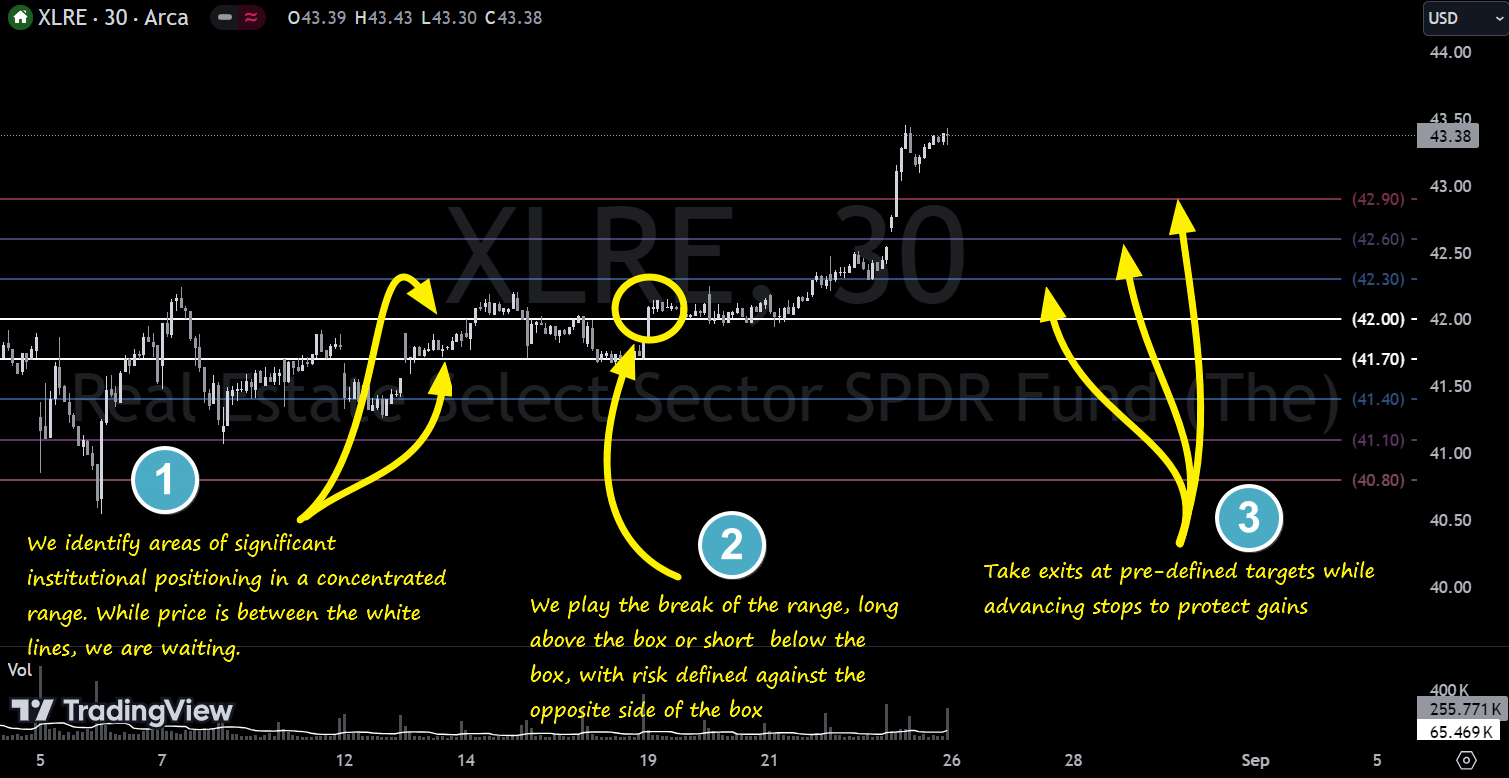
This week we’re featuring additional screened trade ideas from one of our backtested proprietary signals for tactical swings called IBB - Institutional Breakout Boxes. The IBB Setup identifies an area of significant institutional positioning within a tight, concentrated price range, forming what we call a breakout box. This setup captures the potential energy built up as large players accumulate or distribute positions, creating a high-probability opportunity for explosive moves once the price breaks out of this zone. The precision of this setup allows traders to capitalize on the momentum generated by institutional forces, with clearly defined risk and reward parameters.
Note, these are shared for educational and entertainment purposes only and do not constitute financial advice.Here’s an example from XLRE:
Let’s see how last week’s setups played out. If you took any of these yourself, let us know in the comments!
ACWI: ⭐⭐⭐ triggered long, +1.04%, all targets met; this continued to run for +3.35%
ALAB: ⭐⭐⭐triggered short into T2 and then triggered long, +7.51%, all targets met
APP: ⭐⭐⭐ triggered long, +10%, all targets met; this continued to run for +33%
AVUV: ⭐⭐ triggered long, met T1 and T2 for +2.56%; runners left risk-free for T3
COWZ: ⭐⭐ triggered short and met T1 before reversing and triggering long to meet T1 and T2 for +1.75%; runners left risk-free for T3
EWJ: ⭐ triggered long, T1 met for +1.53%; runners left risk-free for T2 and T3
IJR: ⭐⭐ triggered short and met T1 and T2 before reversing and stopping runners. It went on to trigger long to meet T1 and T2 to the long side for +2.08%, runners left risk-free for T3
JPM: ⭐⭐, triggered long into T1 before a major rug stopped all remaining portions and triggered short entries into T1 and T2, +3.59%, runners left risk free for T3
LITE: ⭐⭐, like many others, we got a look at short target 1 before price reversed and triggered long, tagging T1 and T2 for +5.17%, runners left for T3
MA: ⭐⭐⭐, triggered long, all targets met, +3.7%
MS: triggered short and met T1 before reversing to stop the position. It’s now triggered long with no targets on the long-side yet met
ROKU:⭐⭐⭐, triggered long, all targets met, +8.48%. This continued to run for for +15.73%
SPDW:⭐ triggered long, T1 met for +1.14, runners still on for T2 + T3
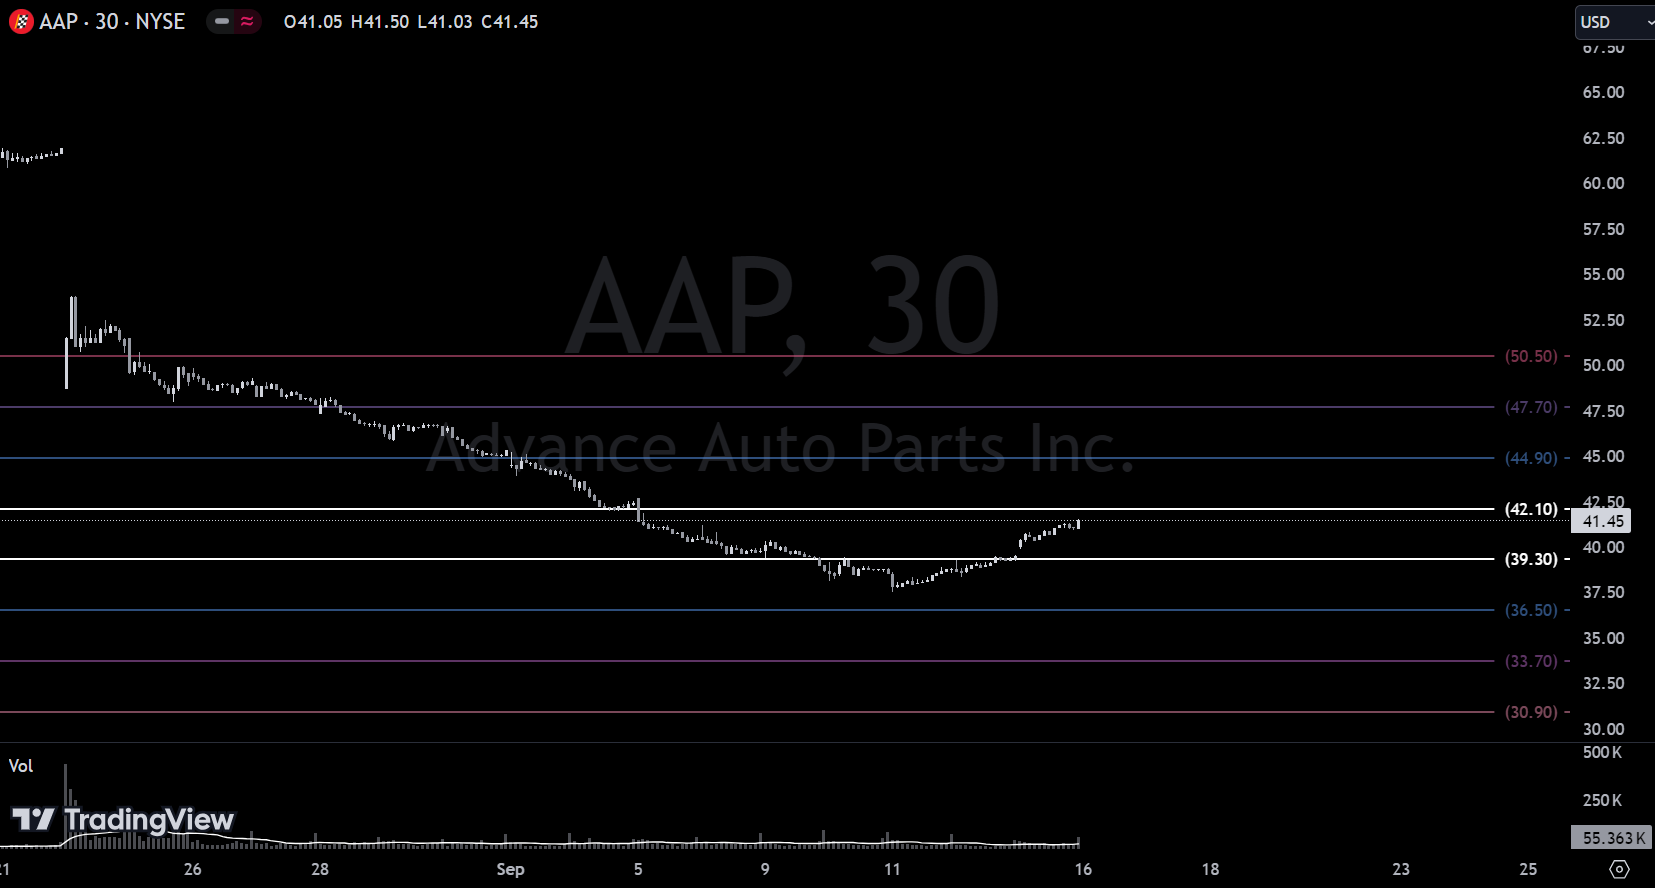
A tricky week where the most agile traders were rewarded playing both directions. No losers and a lot of risk-free positions still on! If the market continues to exhibit strength, these positions should clean-up nicely. Here are some of the Precision Swings we’re watching this week:
Institutionally-Backed Gainers & Losers
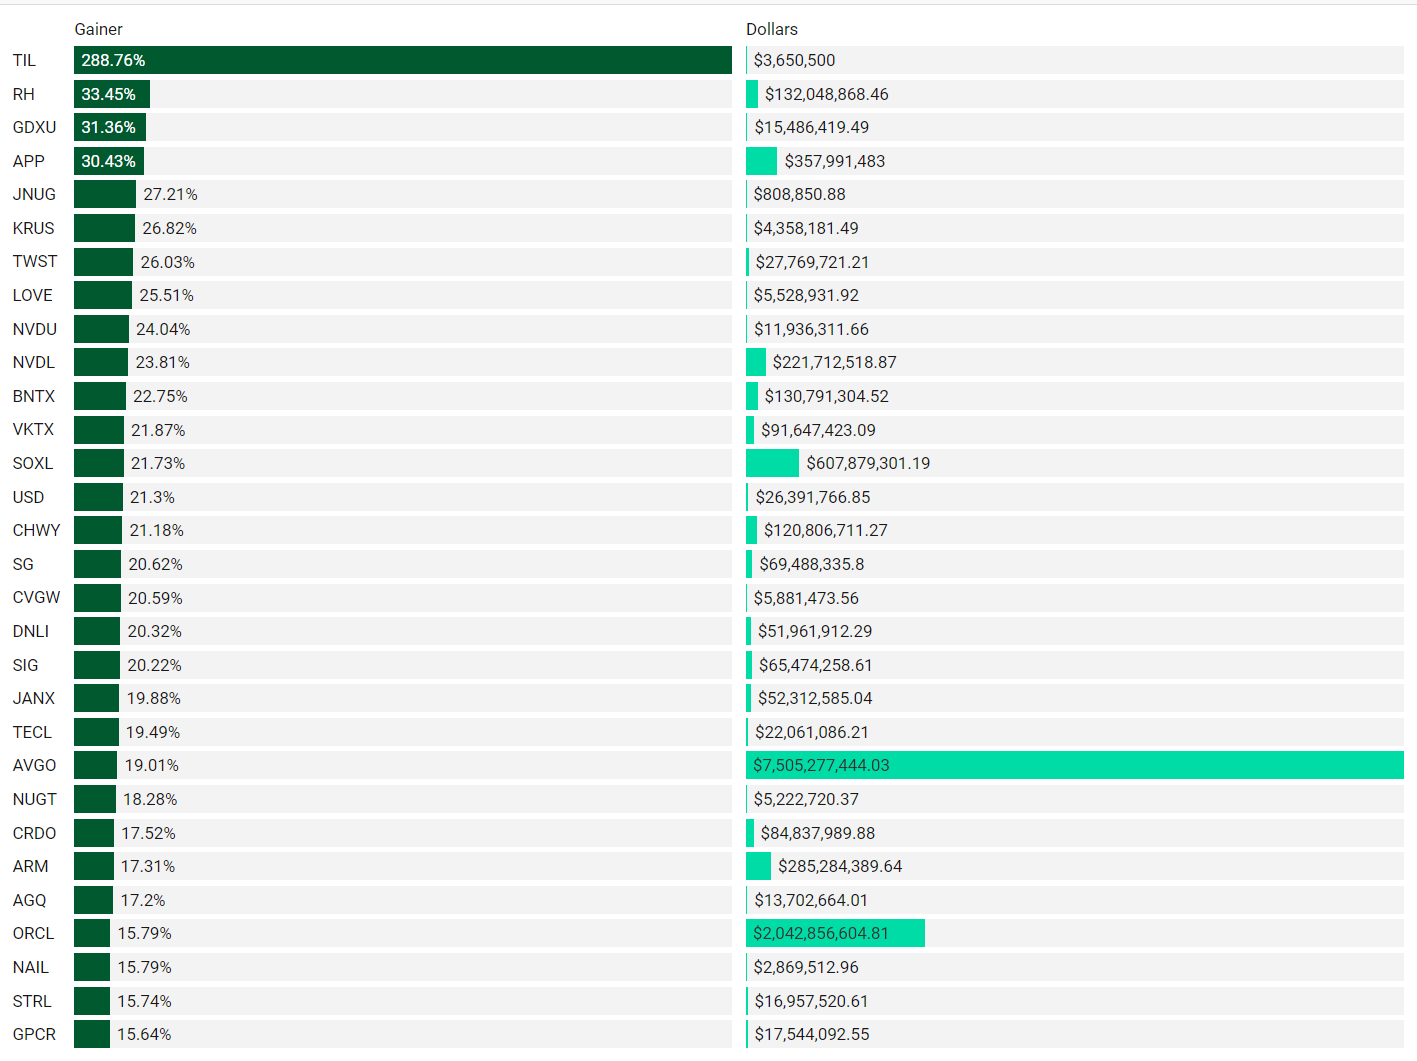
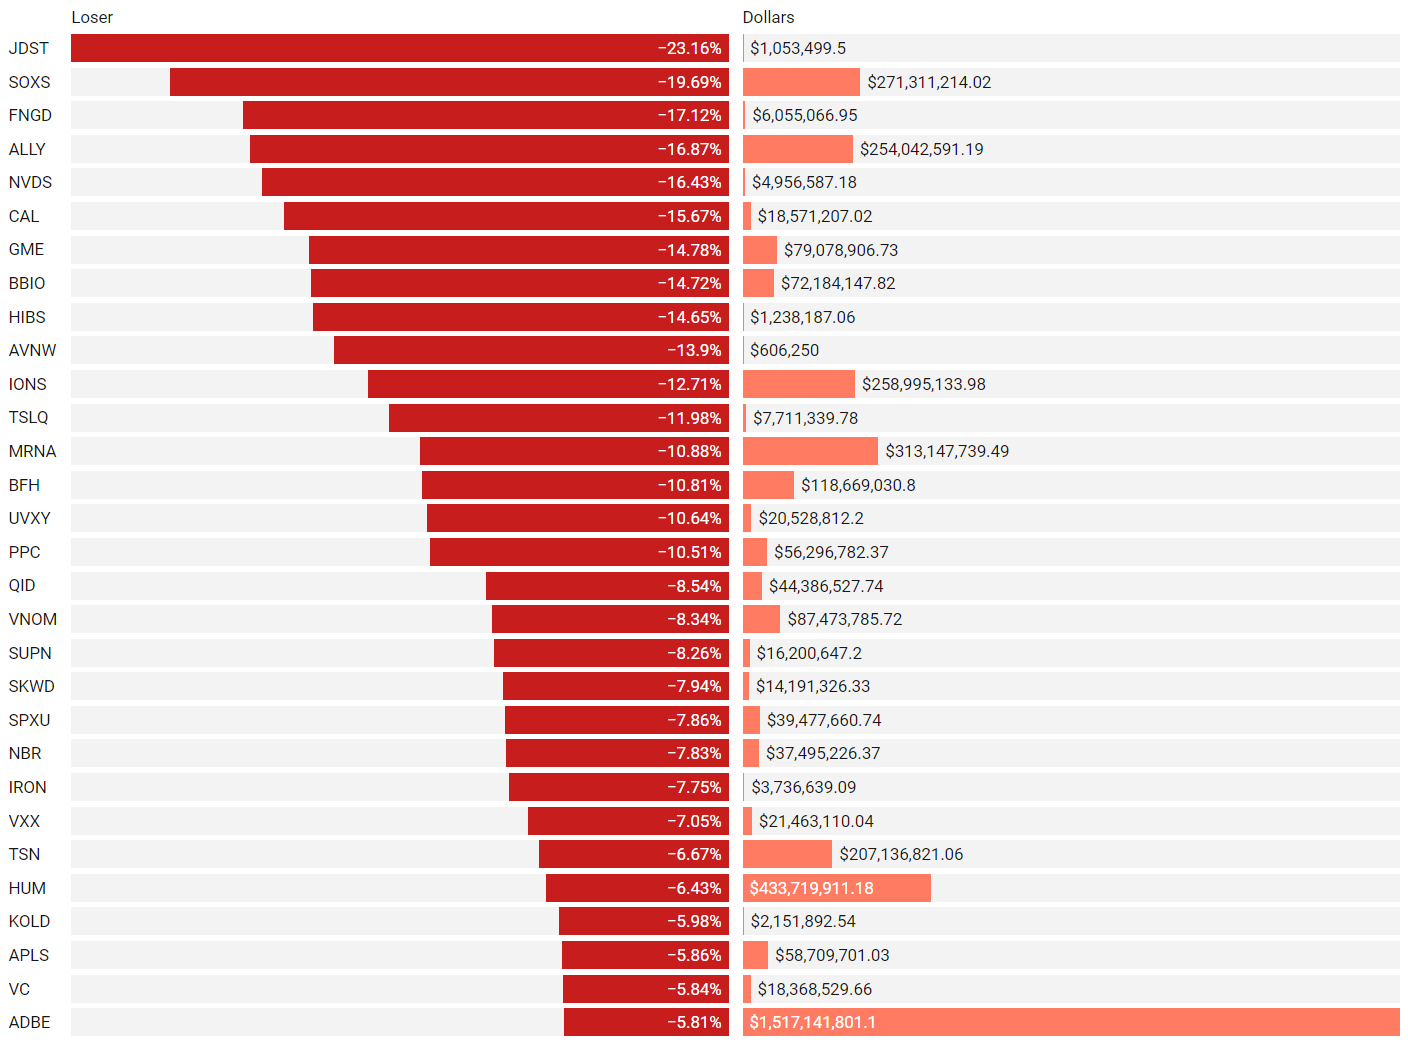
If you’re going to bet on a horse, consider one that is officially endorsed by an institution! These are the top percent gainers (green) and percent losers (red) from this week’s open-to-close that had a trade price greater than $20 and institutional involvement. Continue watching tickers from prior stacks as these frequently turn into multi-leg trades with a lot of movement!
Top Institutionally Backed Gainers
Top Institutionally Backed Losers
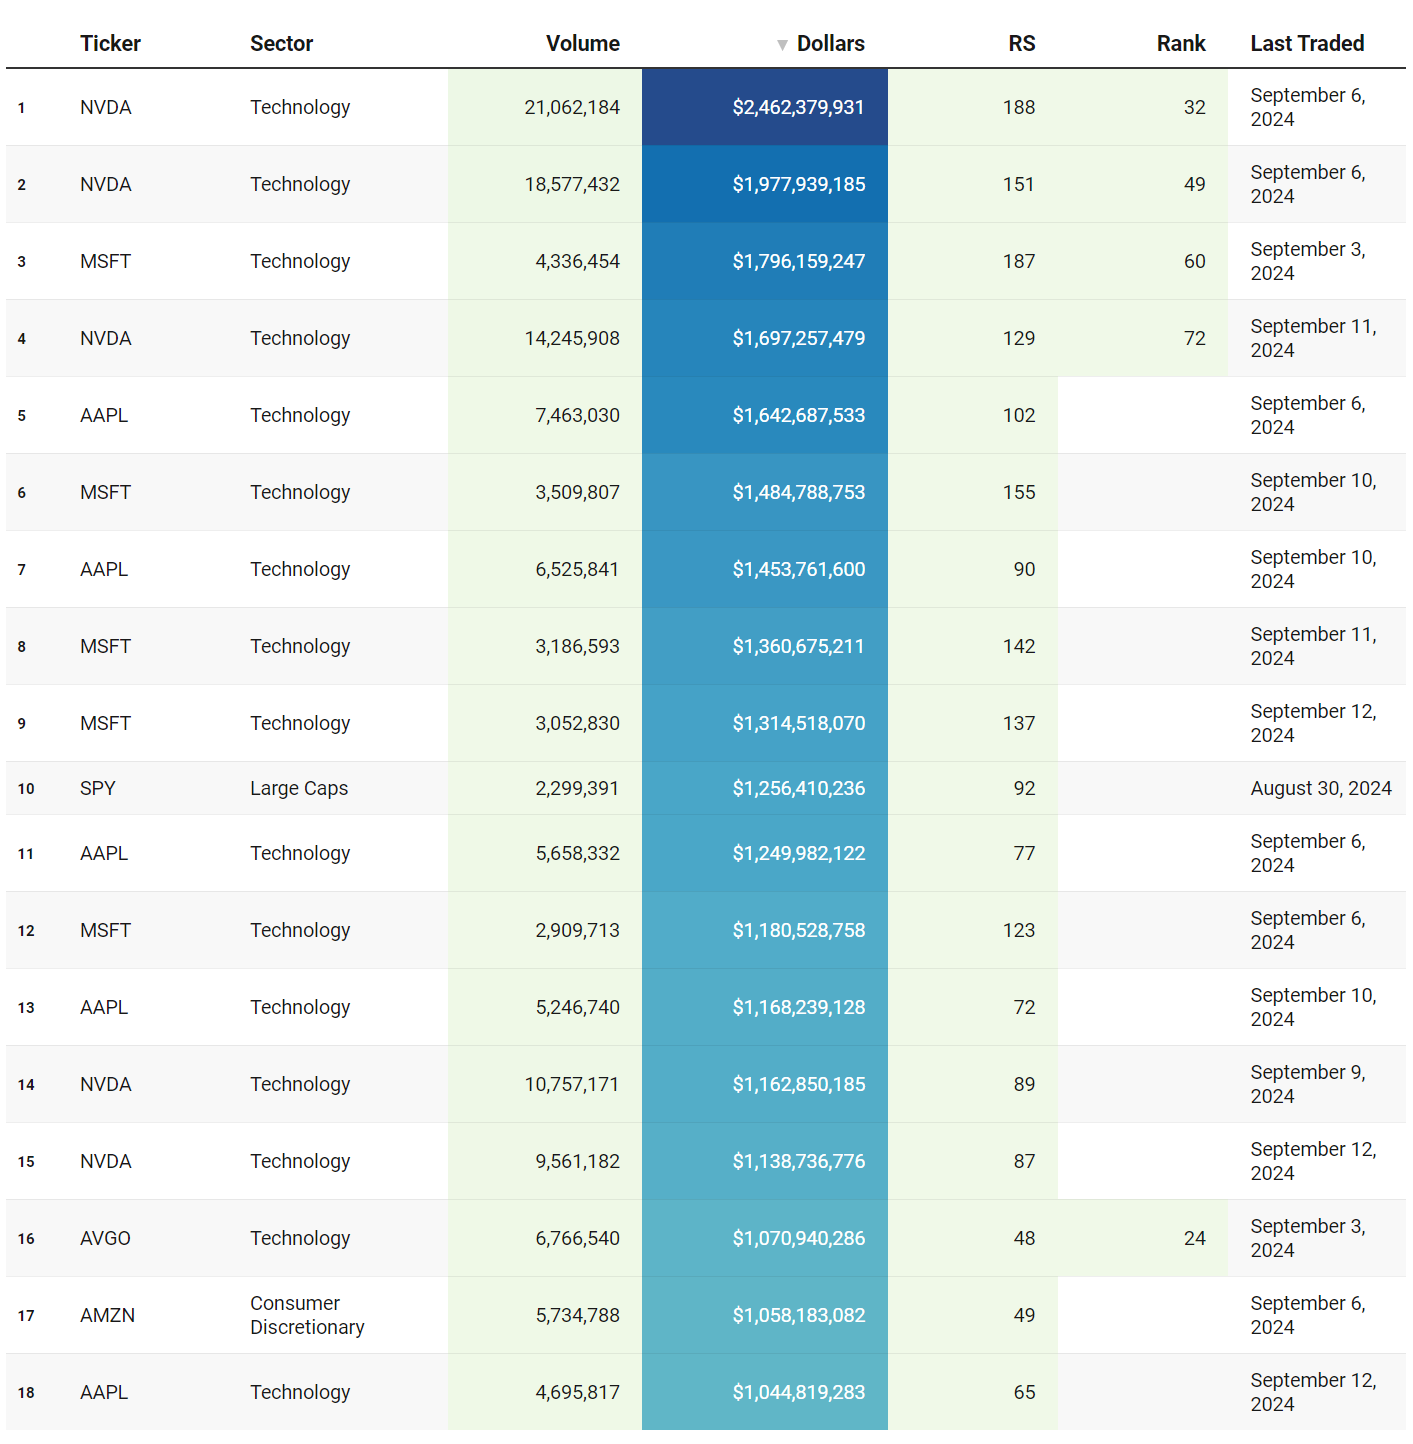
Billionaire Boys Club
Tickers that printed a trade worth at least $1B last week get a special shout-out… Welcome to the club. Subs should login to VL to get the exact trade price and relevant institutional levels around the trade - these are massive commitments by institutions that should not be ignored.
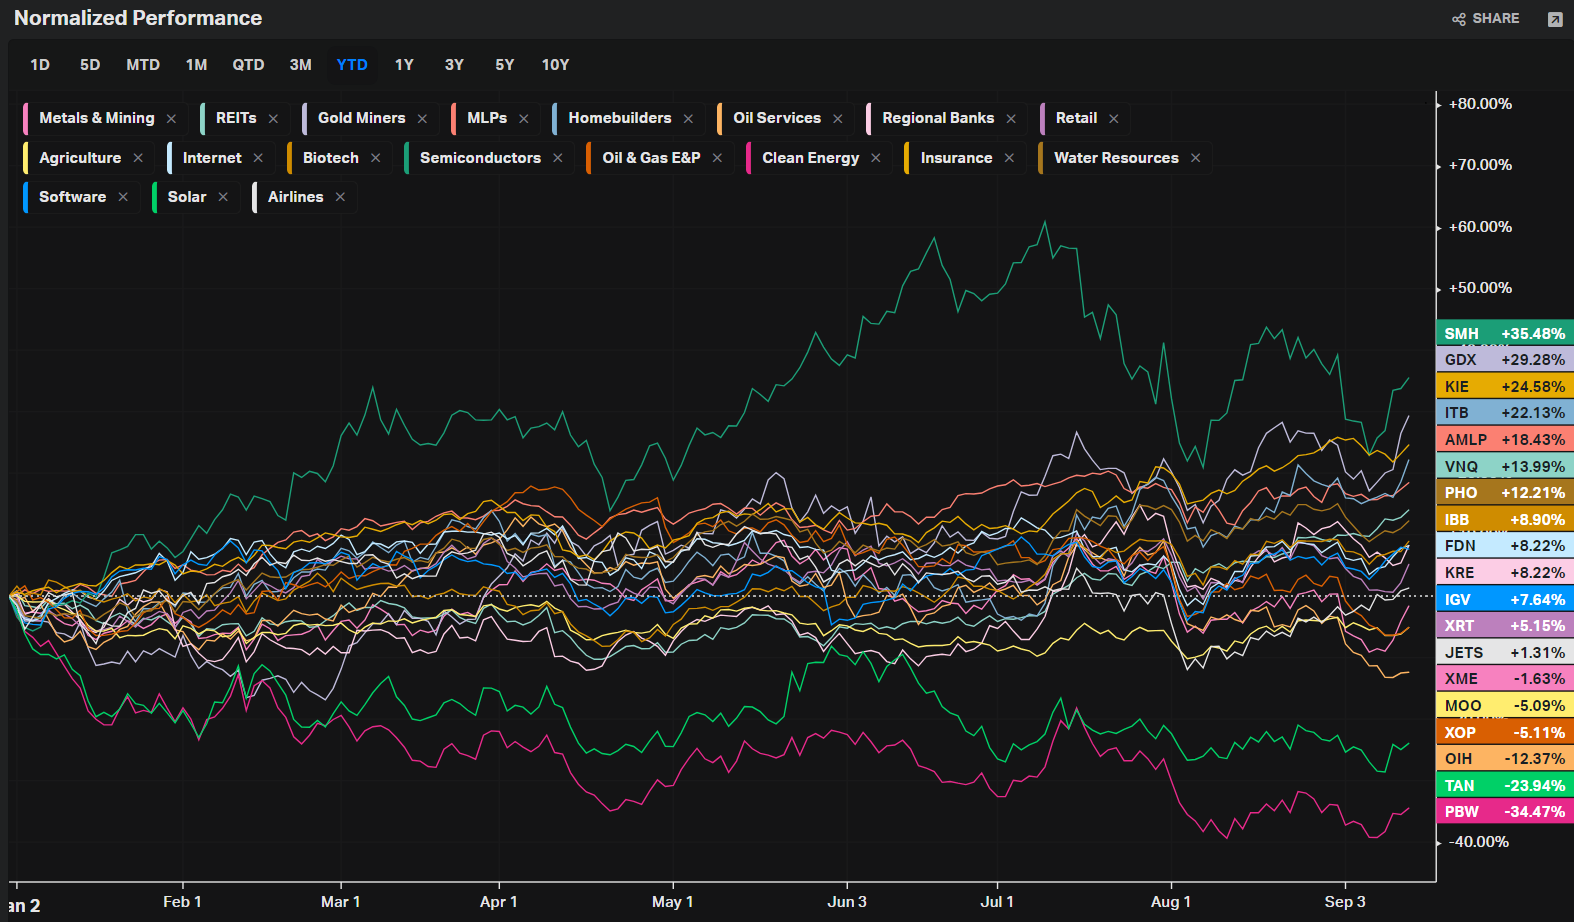
Summary Of Thematic Performance YTD
VL provides a lot of pre-built filters for thematics so that you can quickly dive into specific areas of the market. These performance overviews are provided here only for inspiration. Consider targeting leaders and/or laggards in the best and worst sectors, for example.
We’re now half-way through the year so we’re offering our semi-annual recap of what we’re seeing YTD in each theme. The next detailed wrap-up of thematics will come at the end of the year. If we missed something important, sound-off in the comments!
S&P By Sector

S&P By Industry
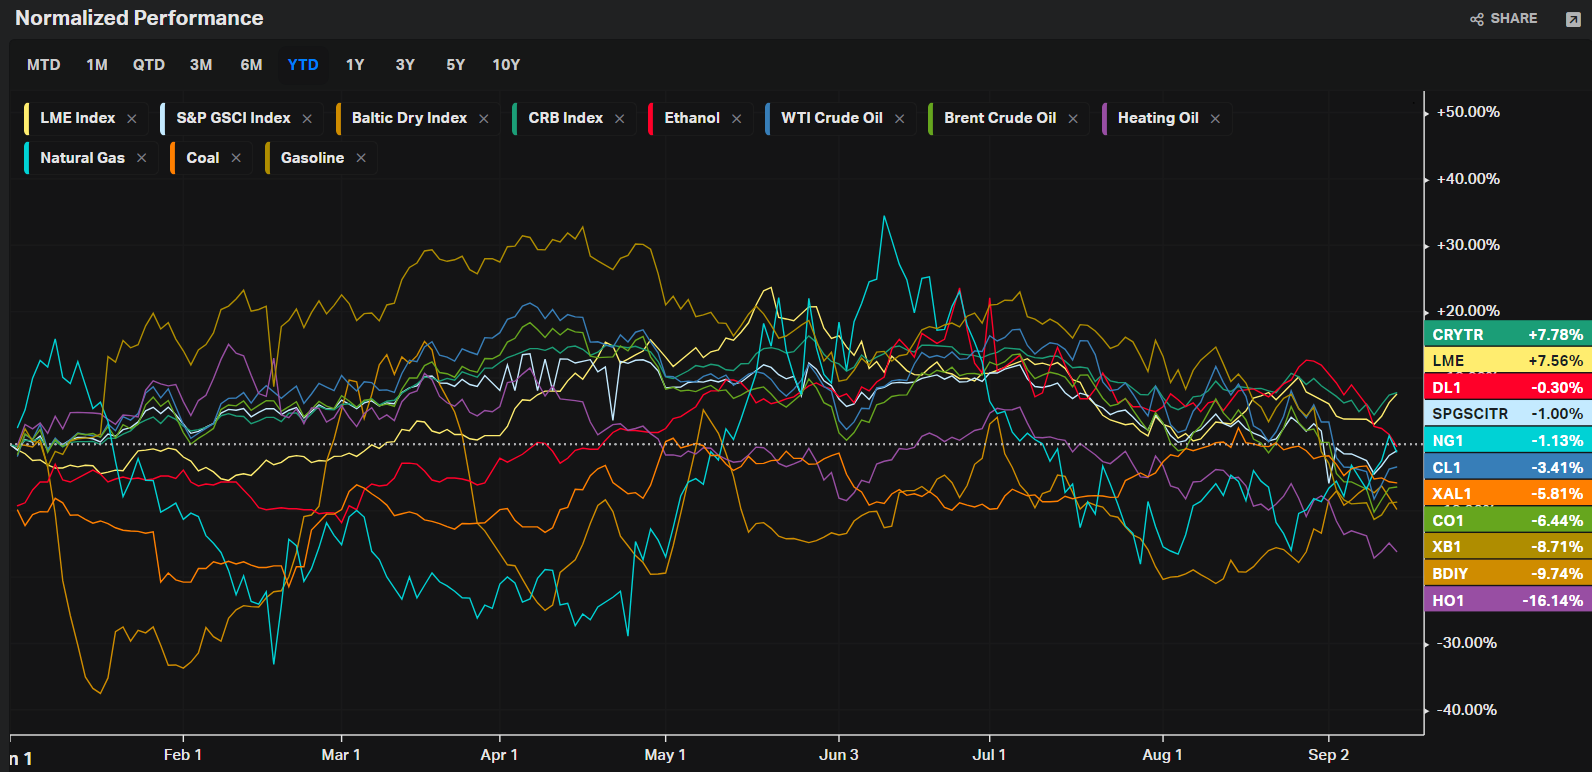
Energy
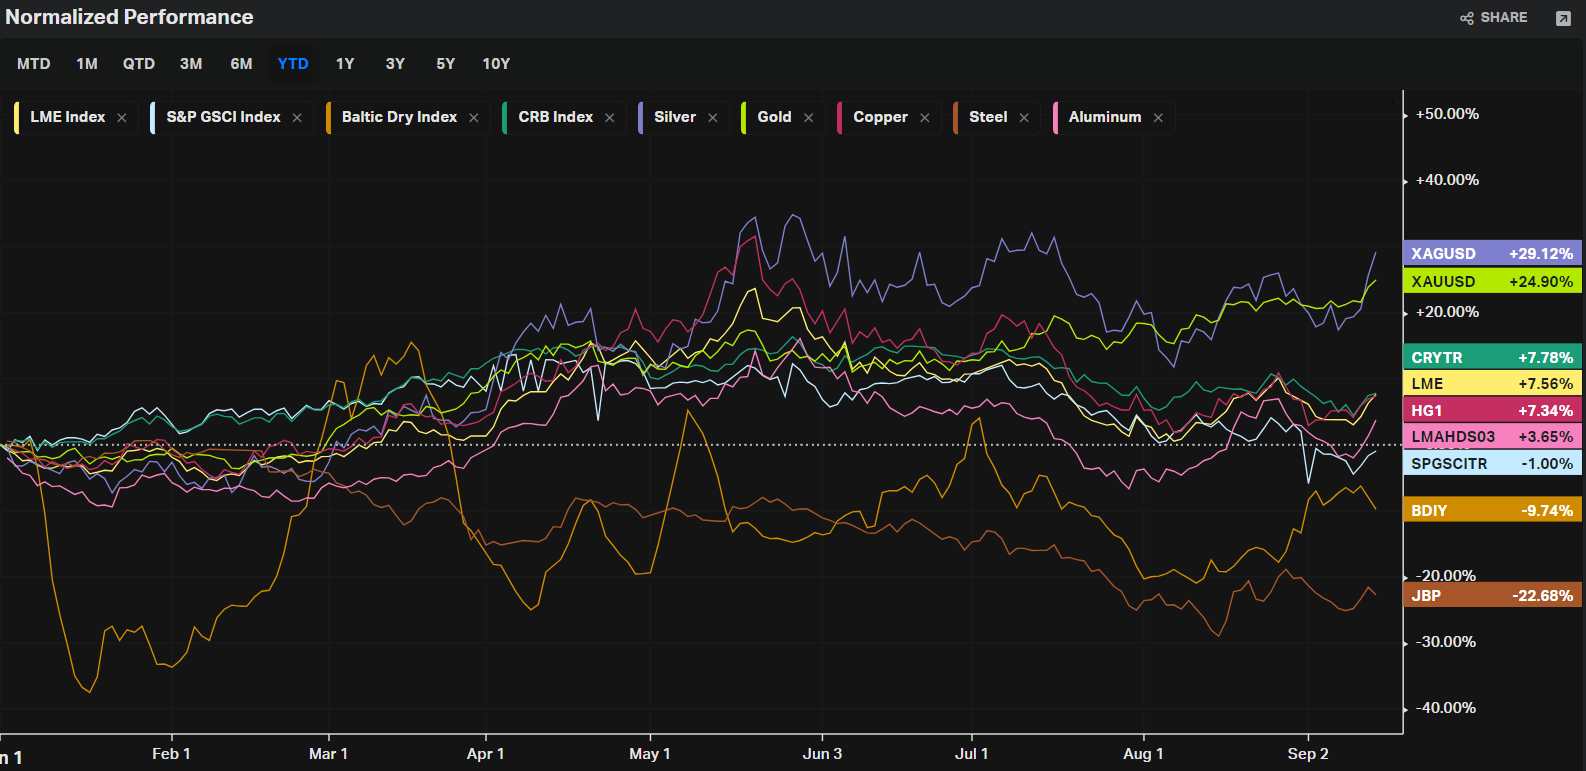
Metals
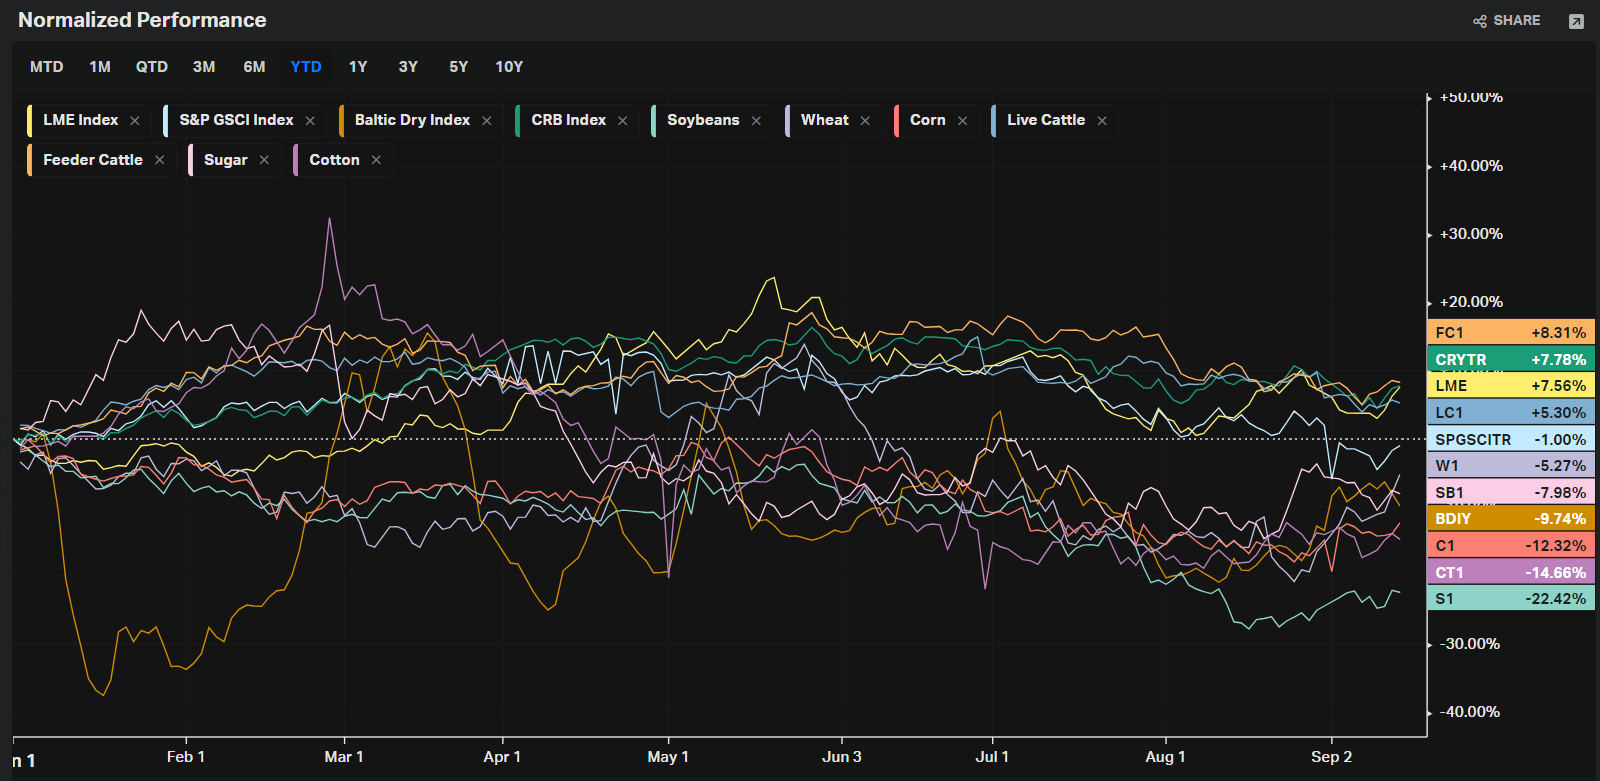
Agriculture
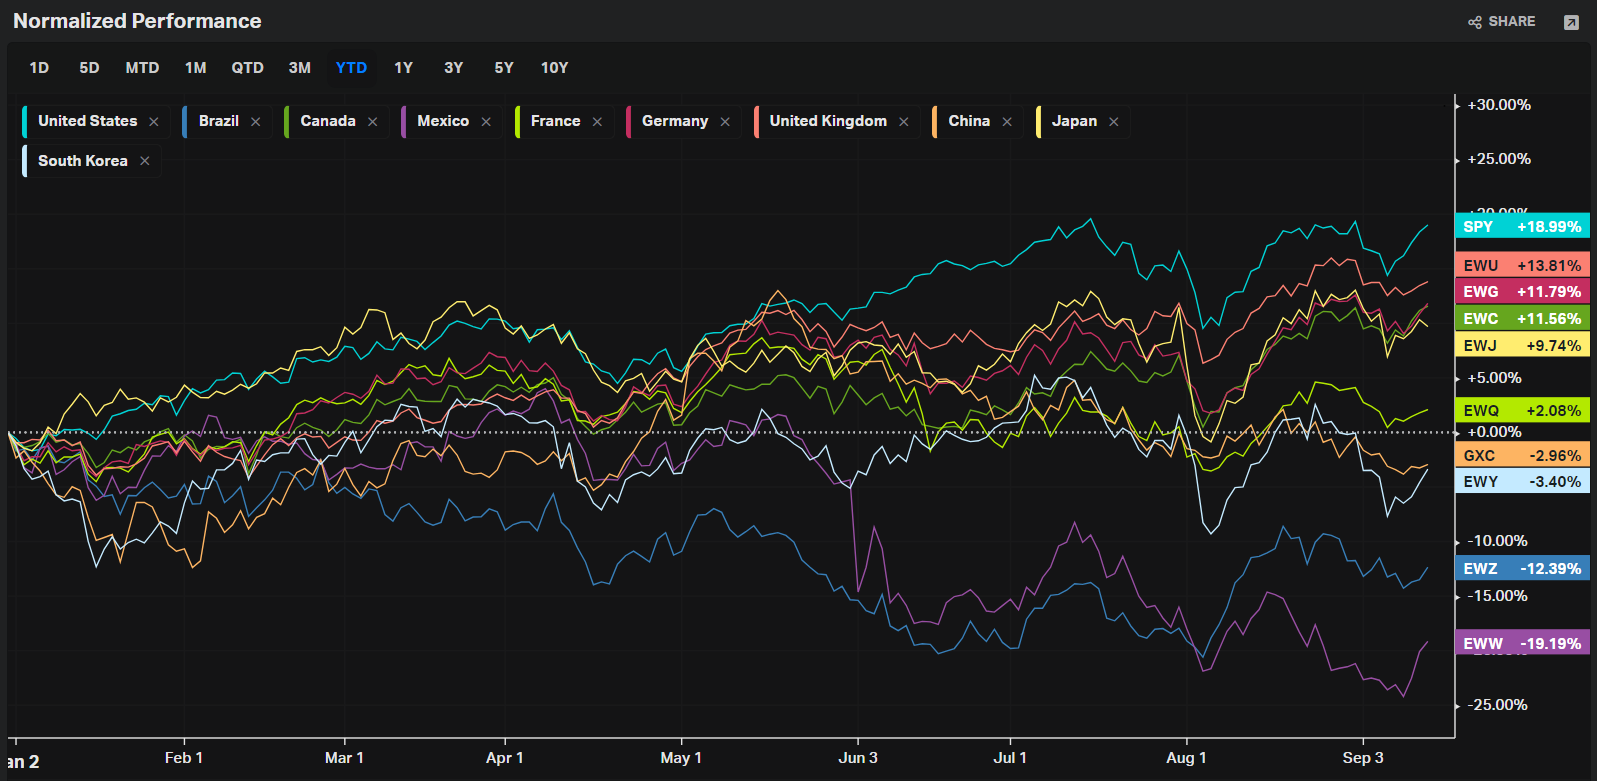
Country ETFs
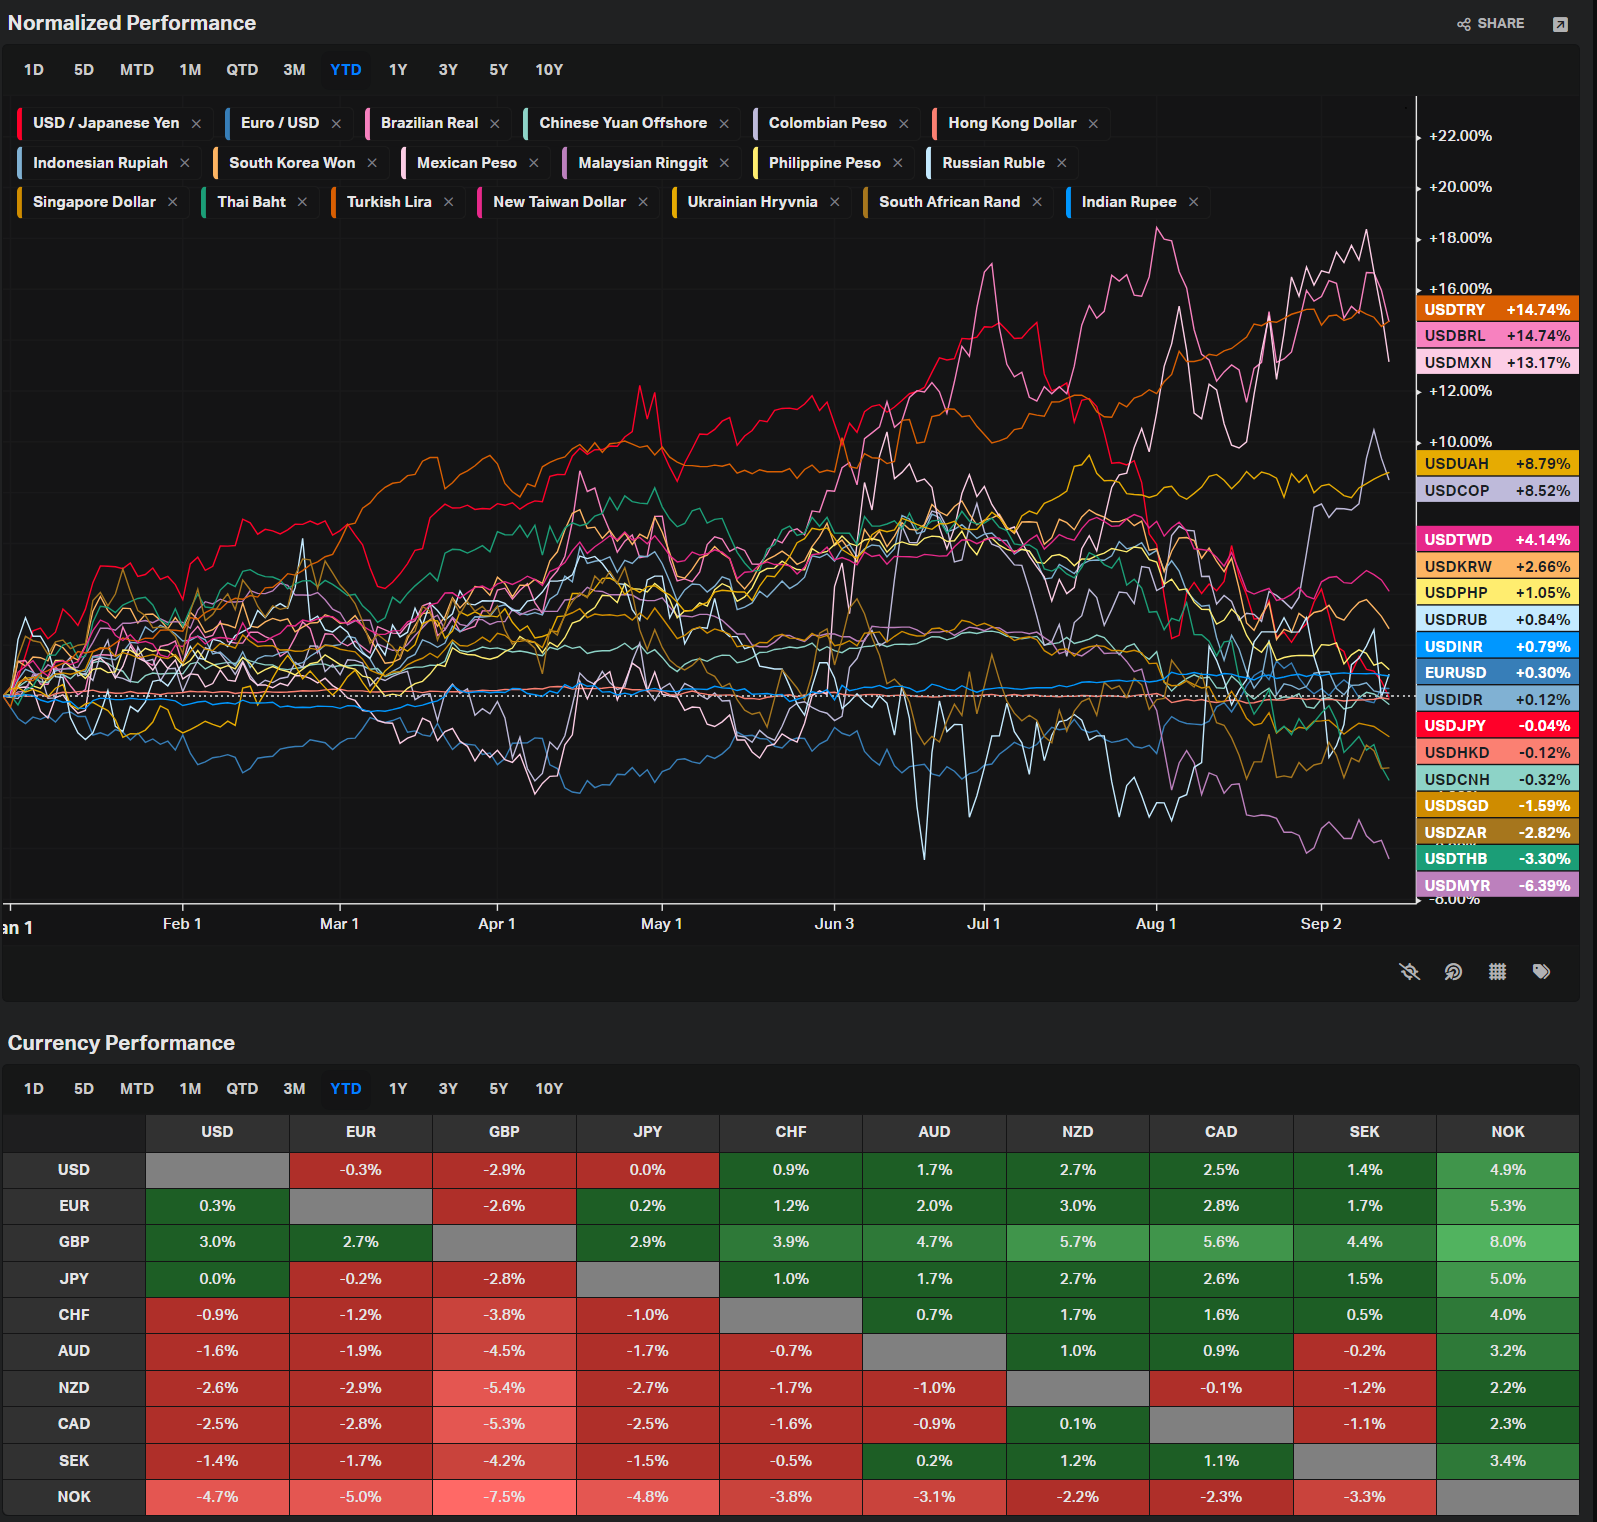
Currencies
Yields
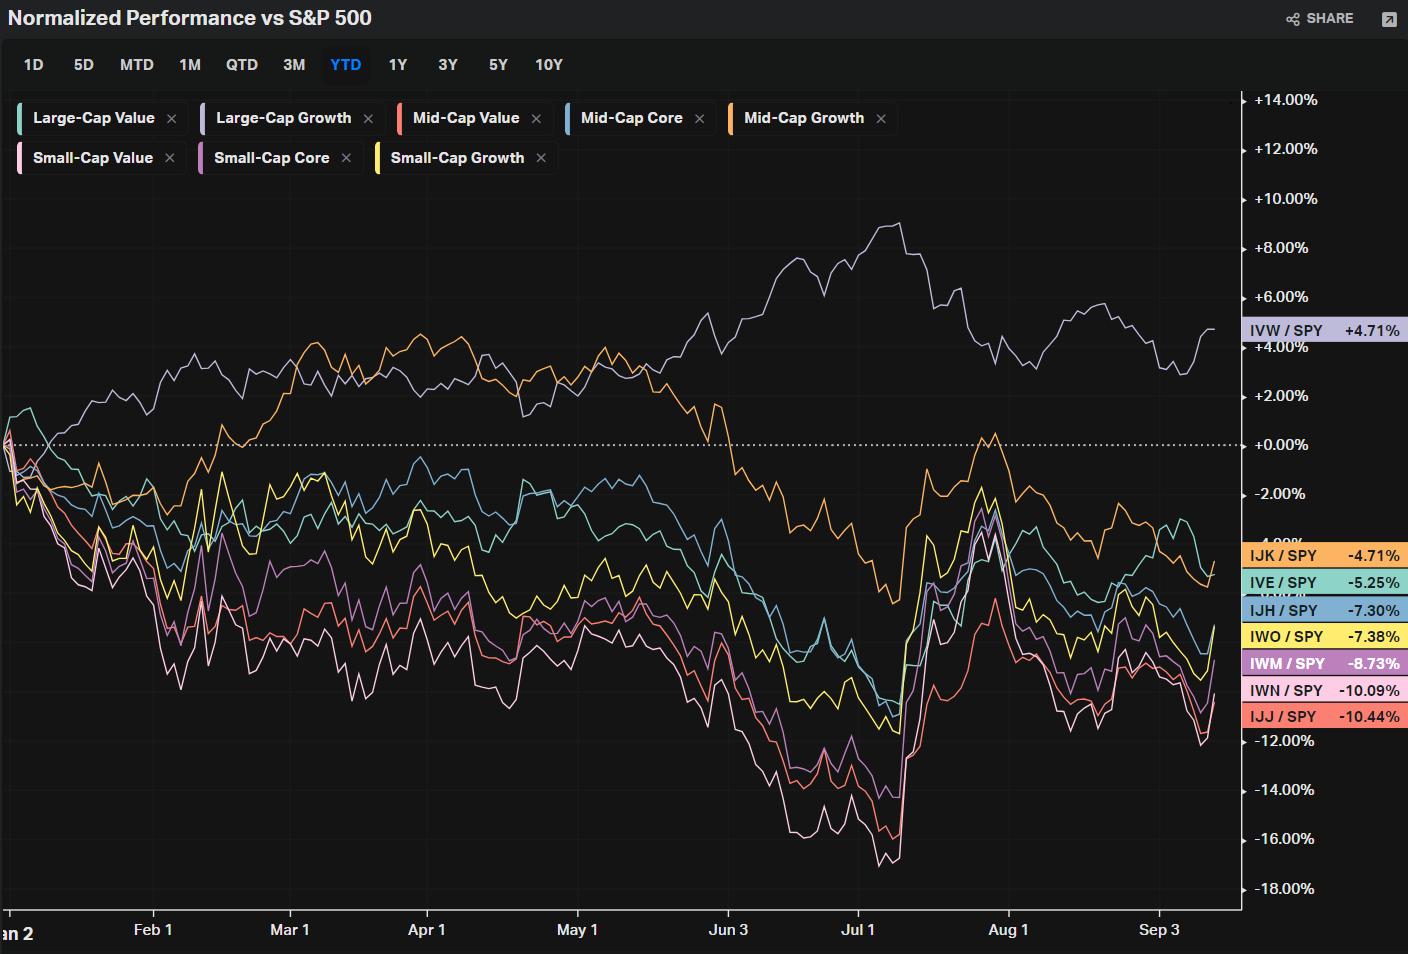
Factors: Size vs Value
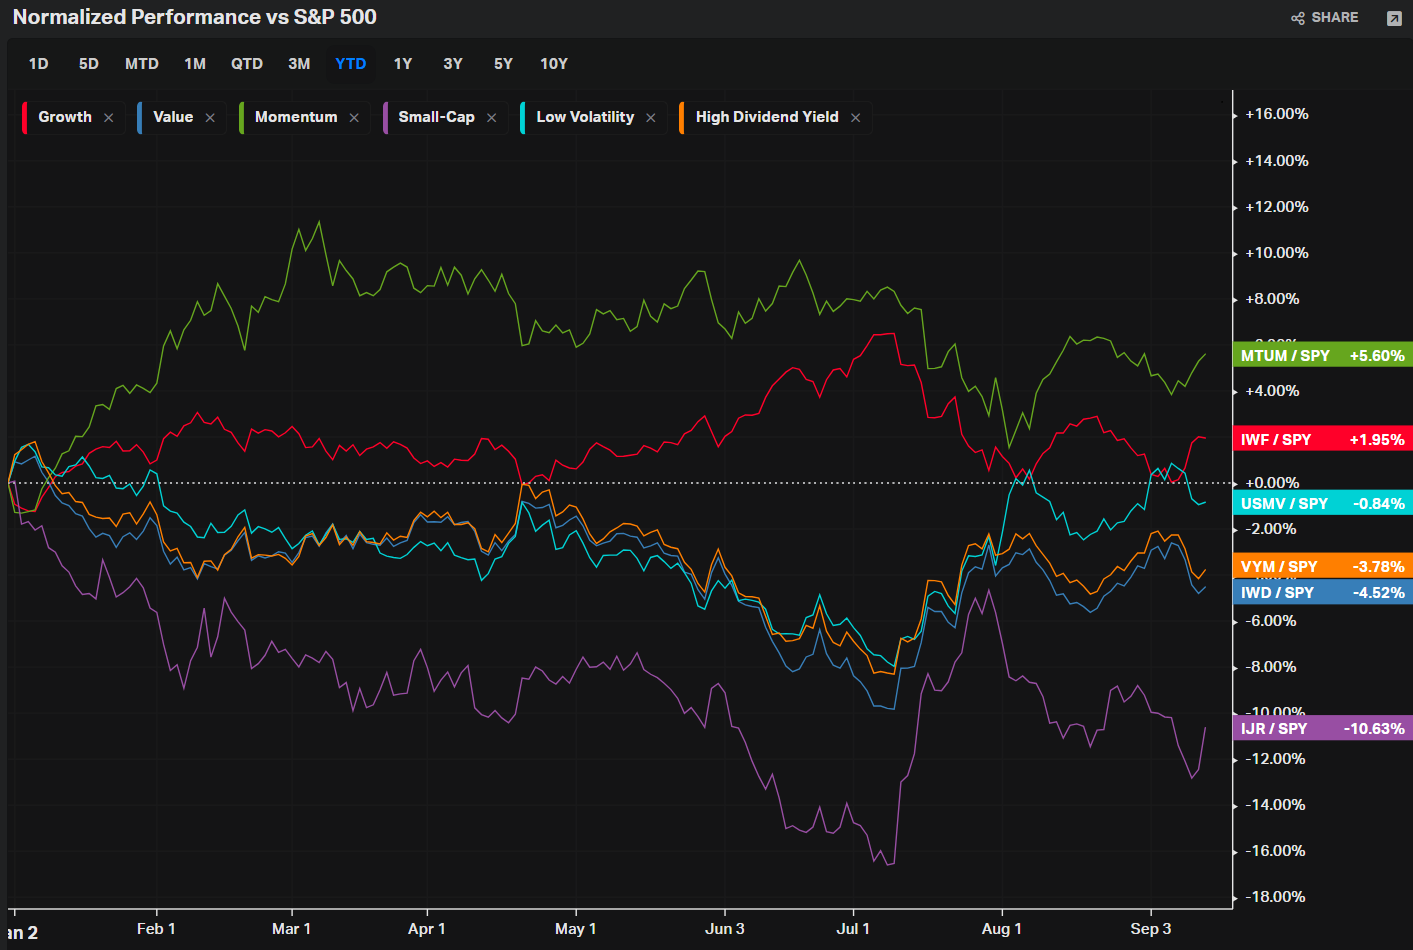
Factors: Style
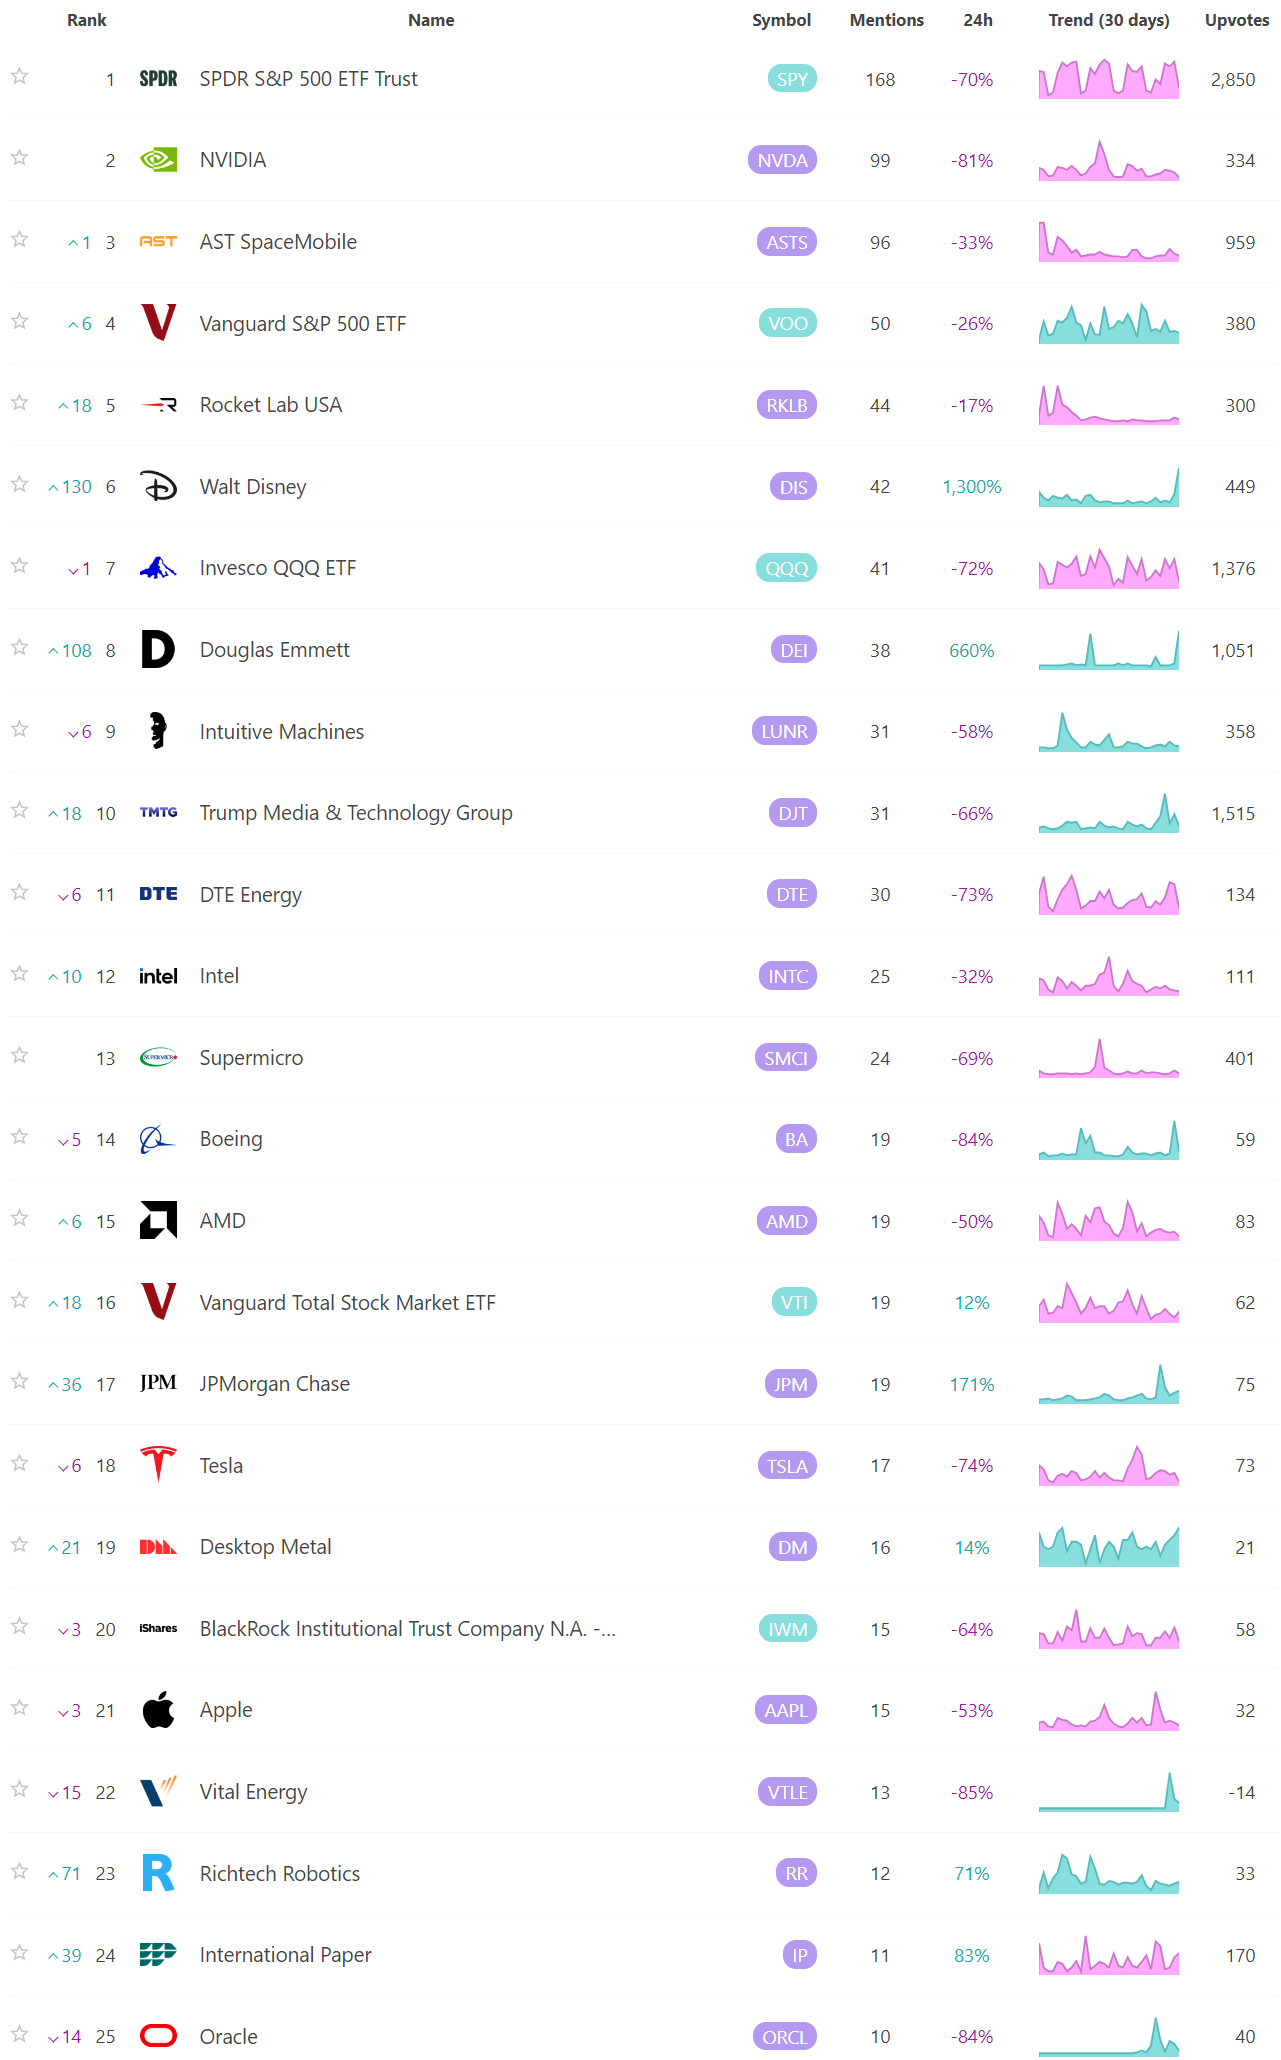
Social Media Favs
Most mentioned/discussed tickers on Reddit from some of the most active Subreddits for trading:
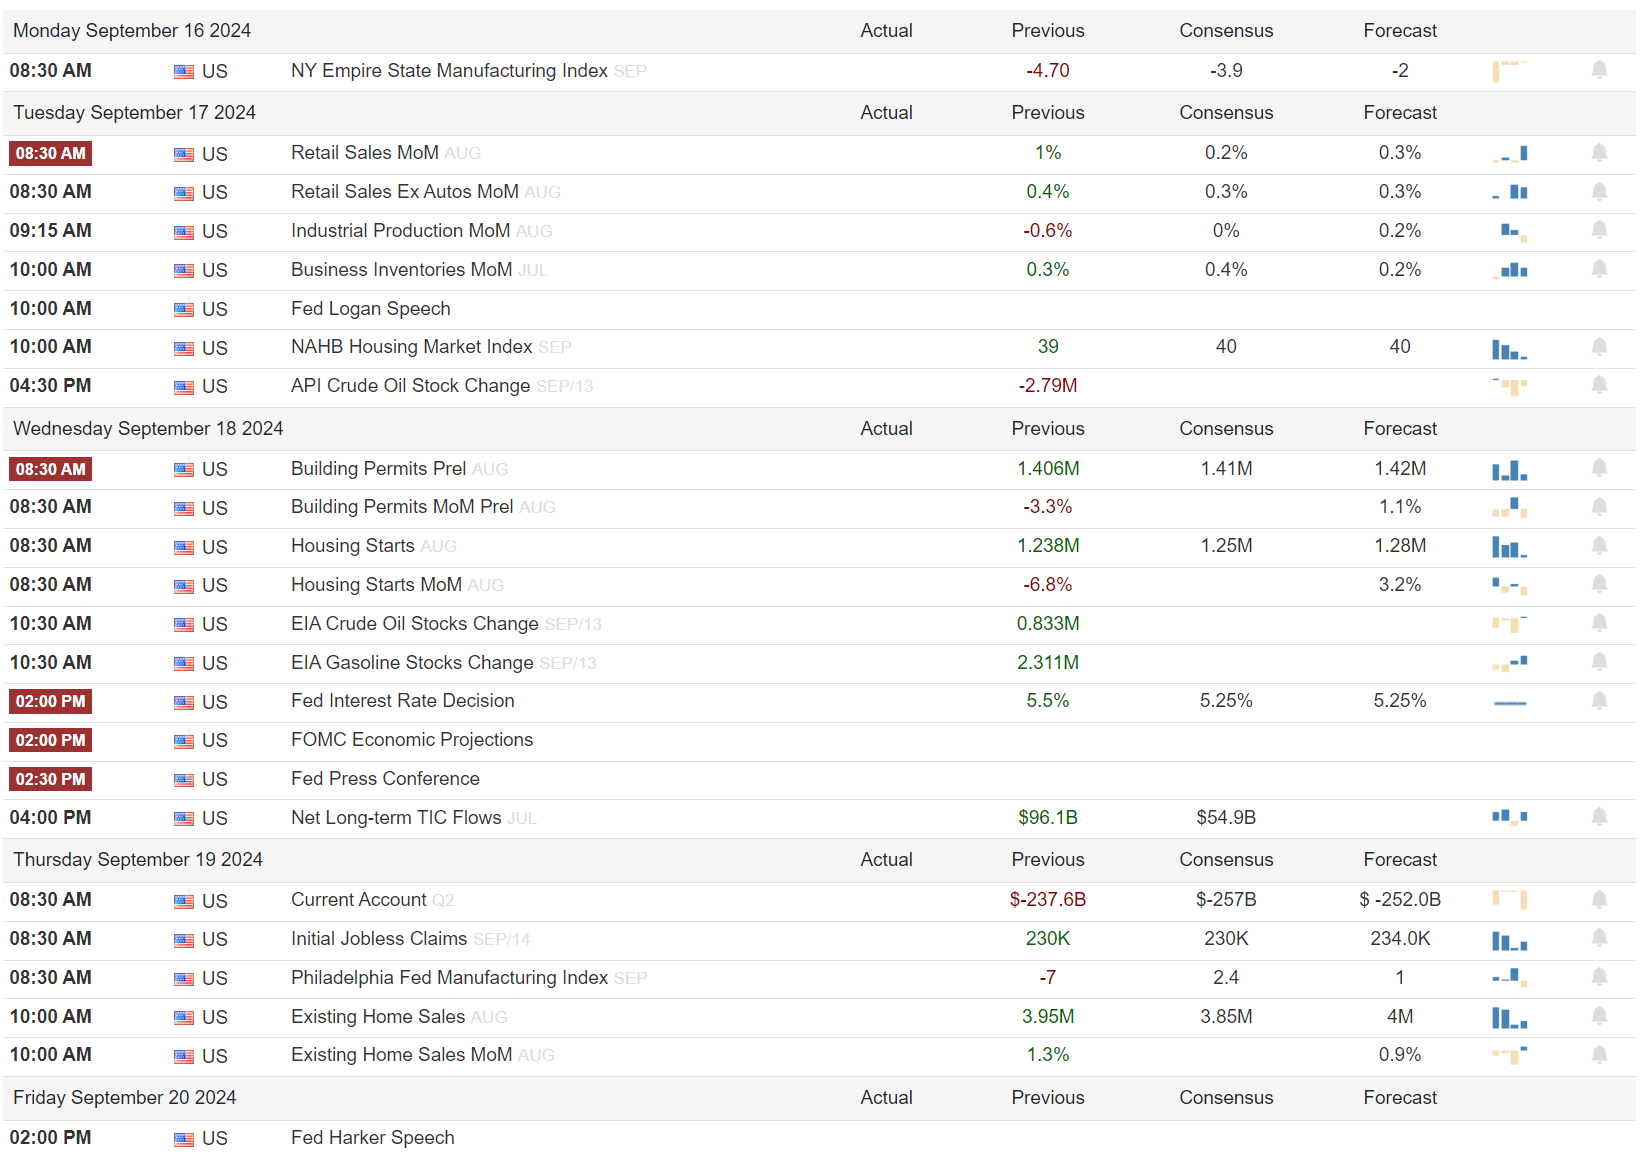
Events On Deck This Week
Here are key events happening this week that have the potential to cause outsized moves in the market or heightened short-term volatility.
Econ
Earnings

A Final Word
Thank you for reading this week's edition of Market Momentum. If you found value in this content, please consider sharing it with a friend or colleague, in a Discord or a Tweet. This small favor helps keep this stack free for you! Please check out VolumeLeaders.com for your own free trial of the platform that brings you the data powering this stack. Wishing you all a green week ahead filled with many bags ❤️💰.


