Market Momentum: Your Weekly Financial Forecast
Issue 10 / What to expect Aug 26, 2024 thru August 30, 2024

Weekly Wrap-Up
During the week of August 19 through August 23, 2024, U.S. financial markets experienced some volatility influenced by mixed economic data, earnings reports, and global events. The S&P 500 and Nasdaq both saw fluctuations as indices largely chopped in range-bound activity as investors processed news about interest rates and economic performance.

Economic Data: Powell signaled that the Fed is preparing to cut interest rates, a significant shift from its previous stance focused on curbing inflation.
He noted that inflation is easing, but also expressed concerns about a weakening job market, which has led to the decision to consider lowering rates. Powell emphasized that the central bank's future actions would be guided by economic data and cautioned against any premature rate cuts, warning that inflation could persist above the Fed's 2% target.

The speech marked a policy pivot, as Powell acknowledged that the risks have shifted from inflationary pressures to the potential for a slowing labor market. He also reflected on the Fed's earlier misjudgments regarding the transitory nature of pandemic-era inflation. Despite this, Powell maintained a hopeful tone, expressing confidence that the economy could return to 2% inflation without triggering widespread layoffs.

The U.S. economy experienced a significant downward revision in job growth figures for the 12-month period through March 2024, as reported by the Bureau of Labor Statistics (BLS). The revision showed that the economy created 818,000 fewer jobs than initially estimated, reducing the reported job growth by nearly 30%. This adjustment suggests that the labor market was not as robust as previously thought, with substantial downward revisions in sectors such as professional and business services, leisure and hospitality, manufacturing, and trade. Despite this, job creation still exceeded 2 million during the period, and sectors like private education, health services, and transportation saw upward revisions.

The revision has implications for Federal Reserve policy, as it could provide further justification for the Fed to consider lowering interest rates. The weaker-than-expected job growth aligns with recent signs of a softening labor market, including a rise in the unemployment rate to 4.3%. This increase in the unemployment rate triggered the Sahm Rule, a historically accurate recession indicator. However, the rise in unemployment has been partly attributed to more people returning to the workforce rather than a significant increase in layoffs.
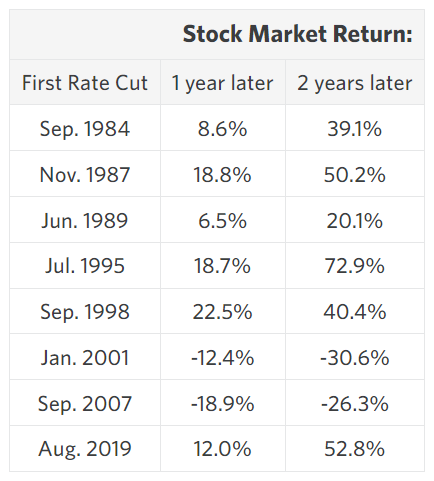
Economists and analysts are divided on the significance of these revisions. While some, like Jeffrey Roach of LPL Financial, believe the weaker labor market supports the case for rate cuts, others, including Goldman Sachs economists, argue that the revisions may have been overstated. The debate continues as Federal Reserve officials, including Chair Jerome Powell, closely monitor the evolving job market ahead of the Fed’s September meeting, where the first interest rate cut in four years is expected to be approved.

Corporate Earnings: In terms of corporate earnings, the retail sector was in the spotlight. Reports from major retailers such as Home Depot and Lowe's provided insights into consumer behavior and the housing market. Home Depot reported better-than-expected earnings, driven by strong demand for home improvement products. However, Lowe's earnings were more mixed, reflecting challenges in maintaining growth amid a cooling housing market. Nvidia is in the spotlight later this week.
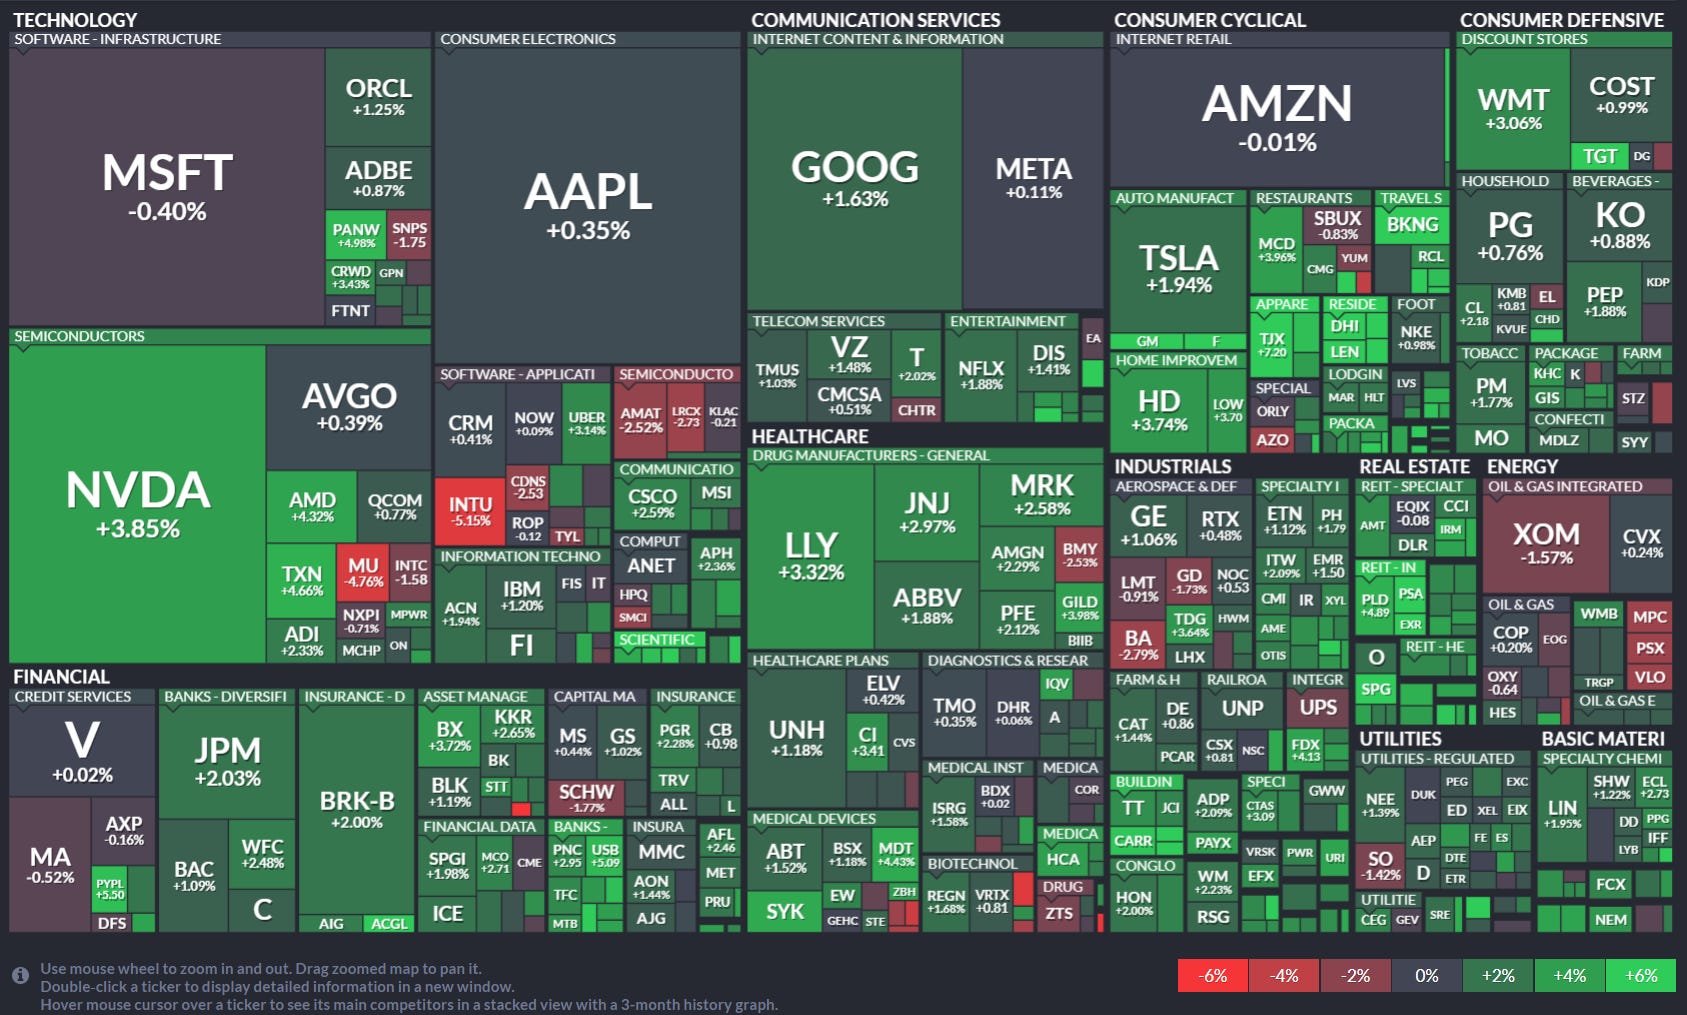
In broad strokes auto makers, homebuilders, retailers, entertainment and biotech companies caught bids on the back of Fed Chair Powell’s comments. Semi and large banks did well, too. SPX is up a staggering 10% off this month’s lows when the yen carry trade caused a massive unwinding of positions in the markets and SPY - along with many other tickers - saw their highest volume day of 2024.
This Week’s Snapshots
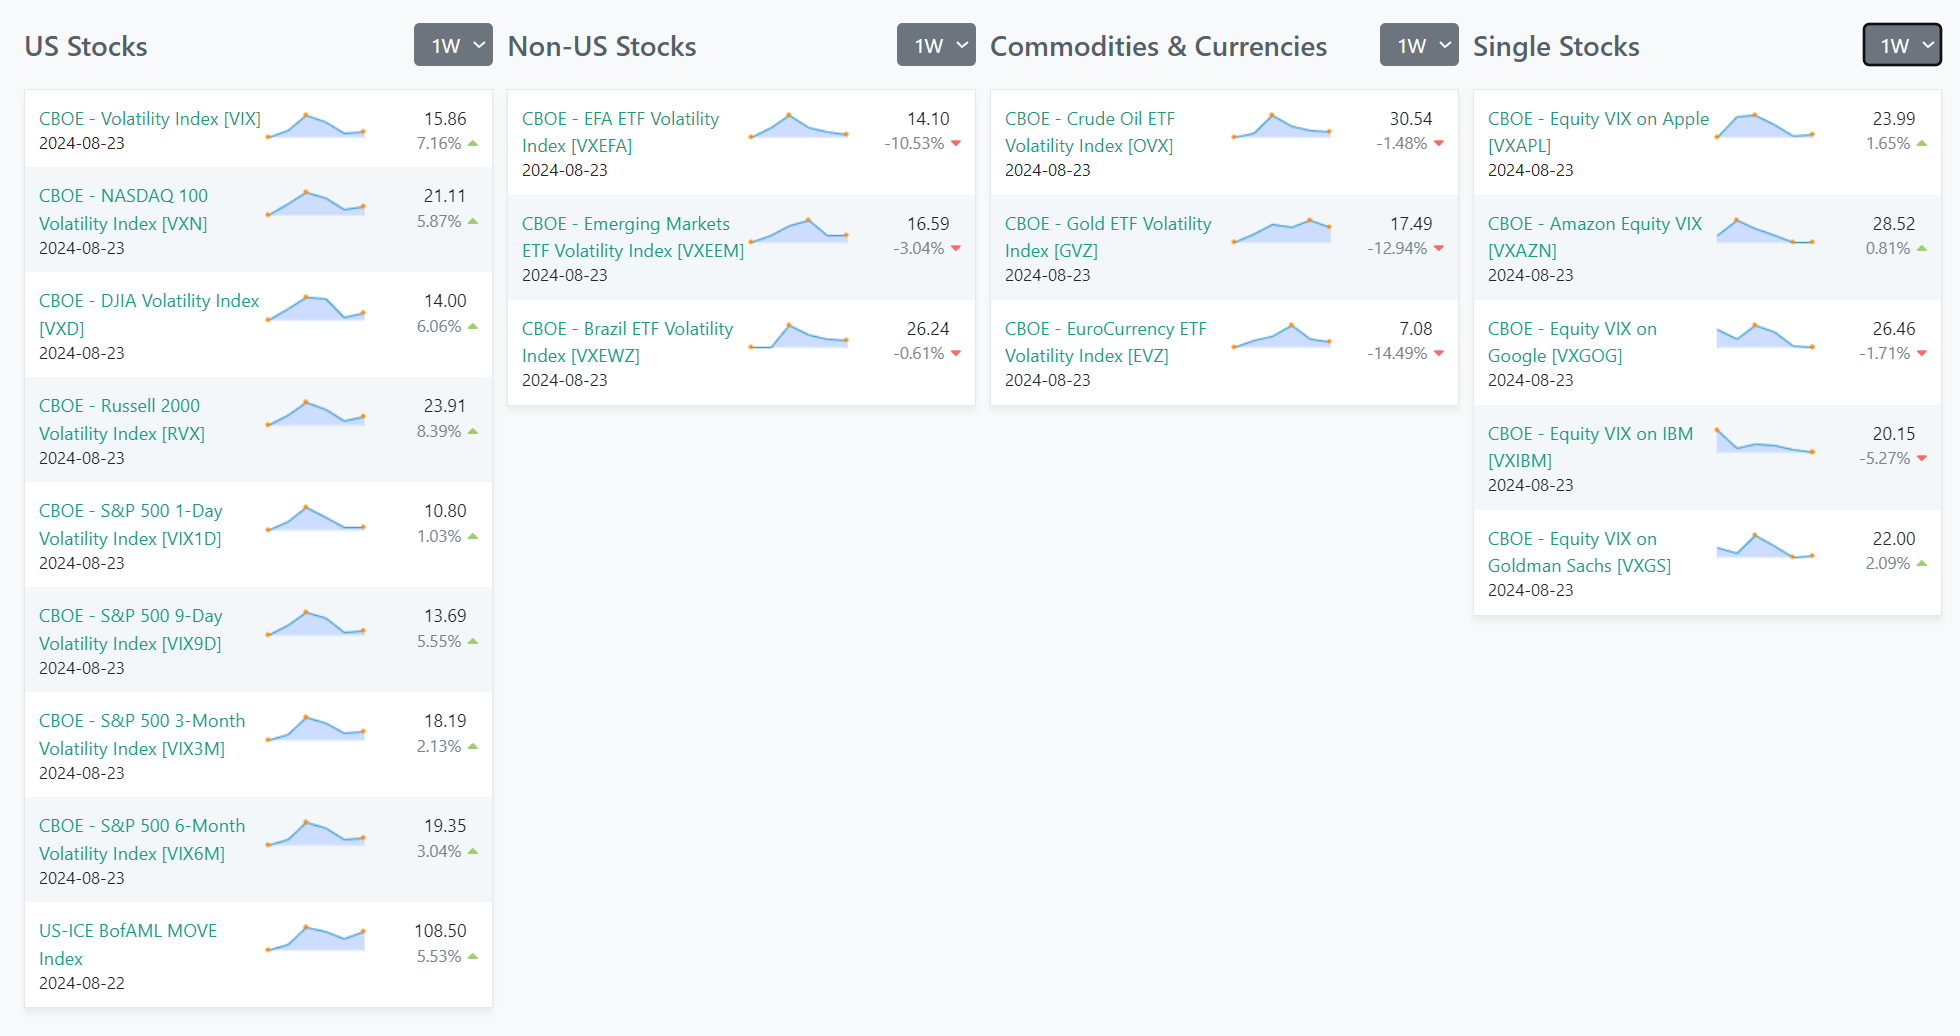
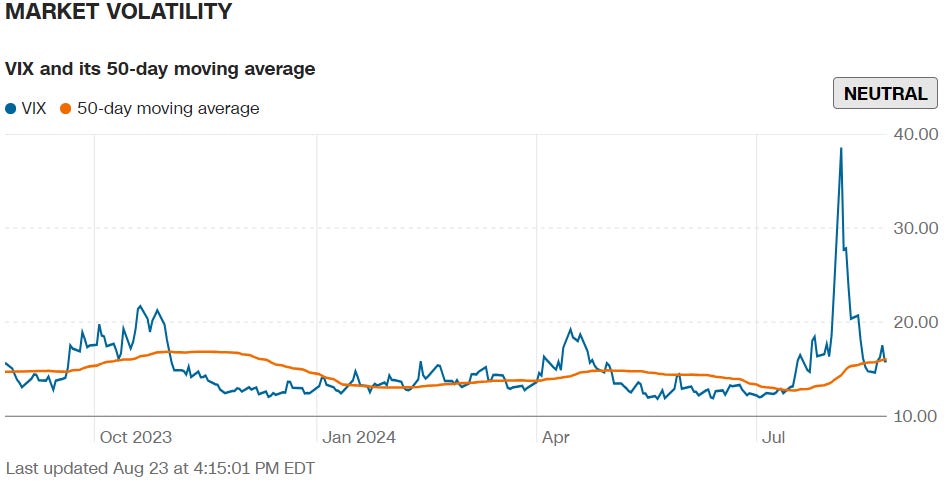
Volatility
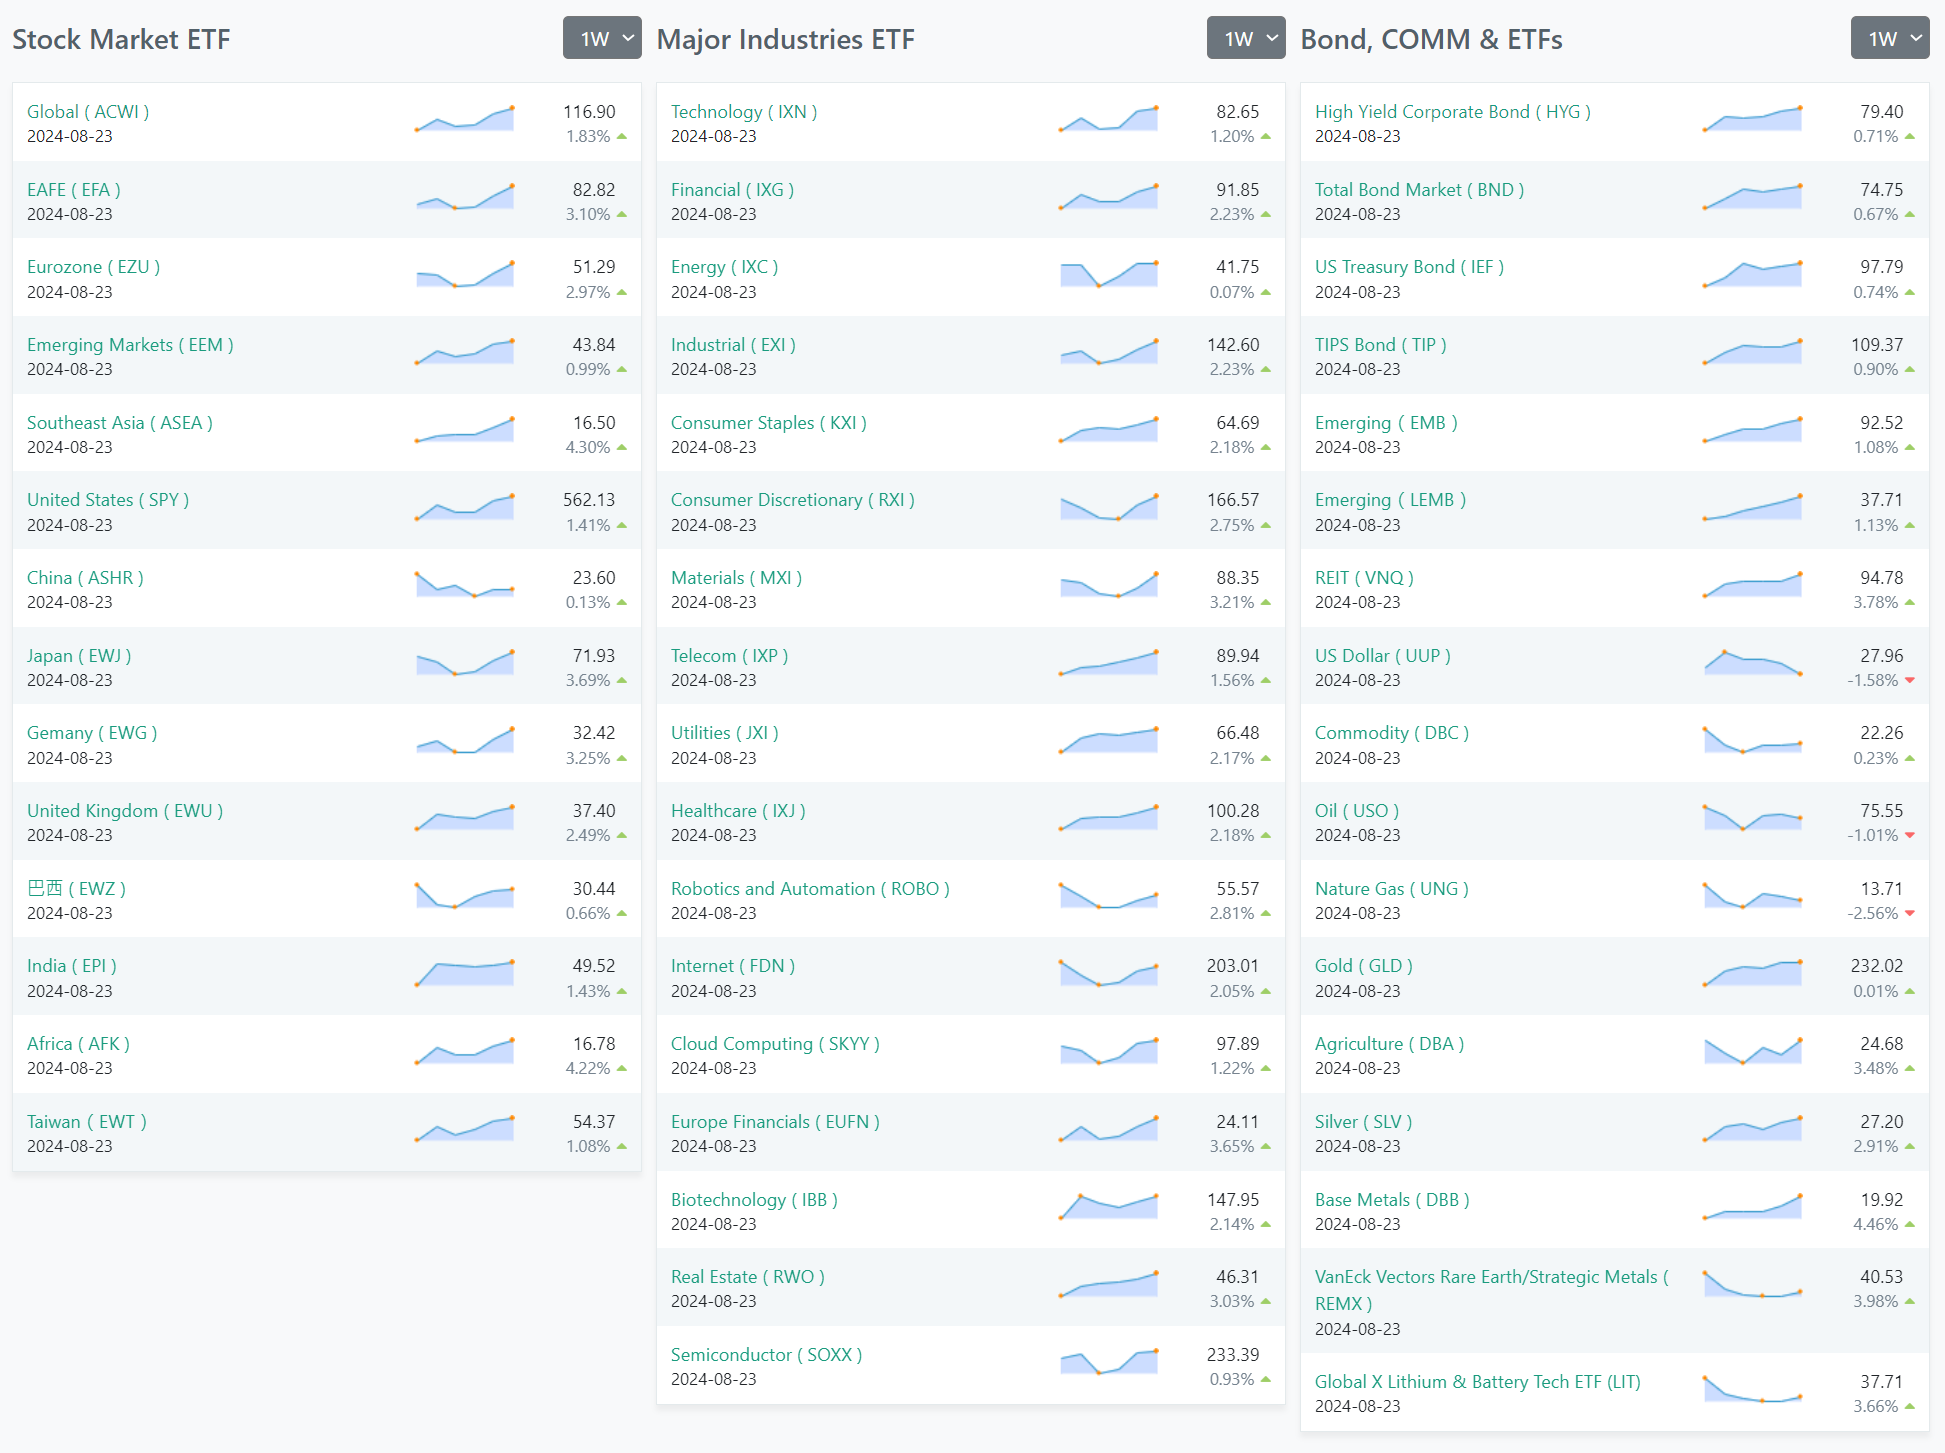
ETFs
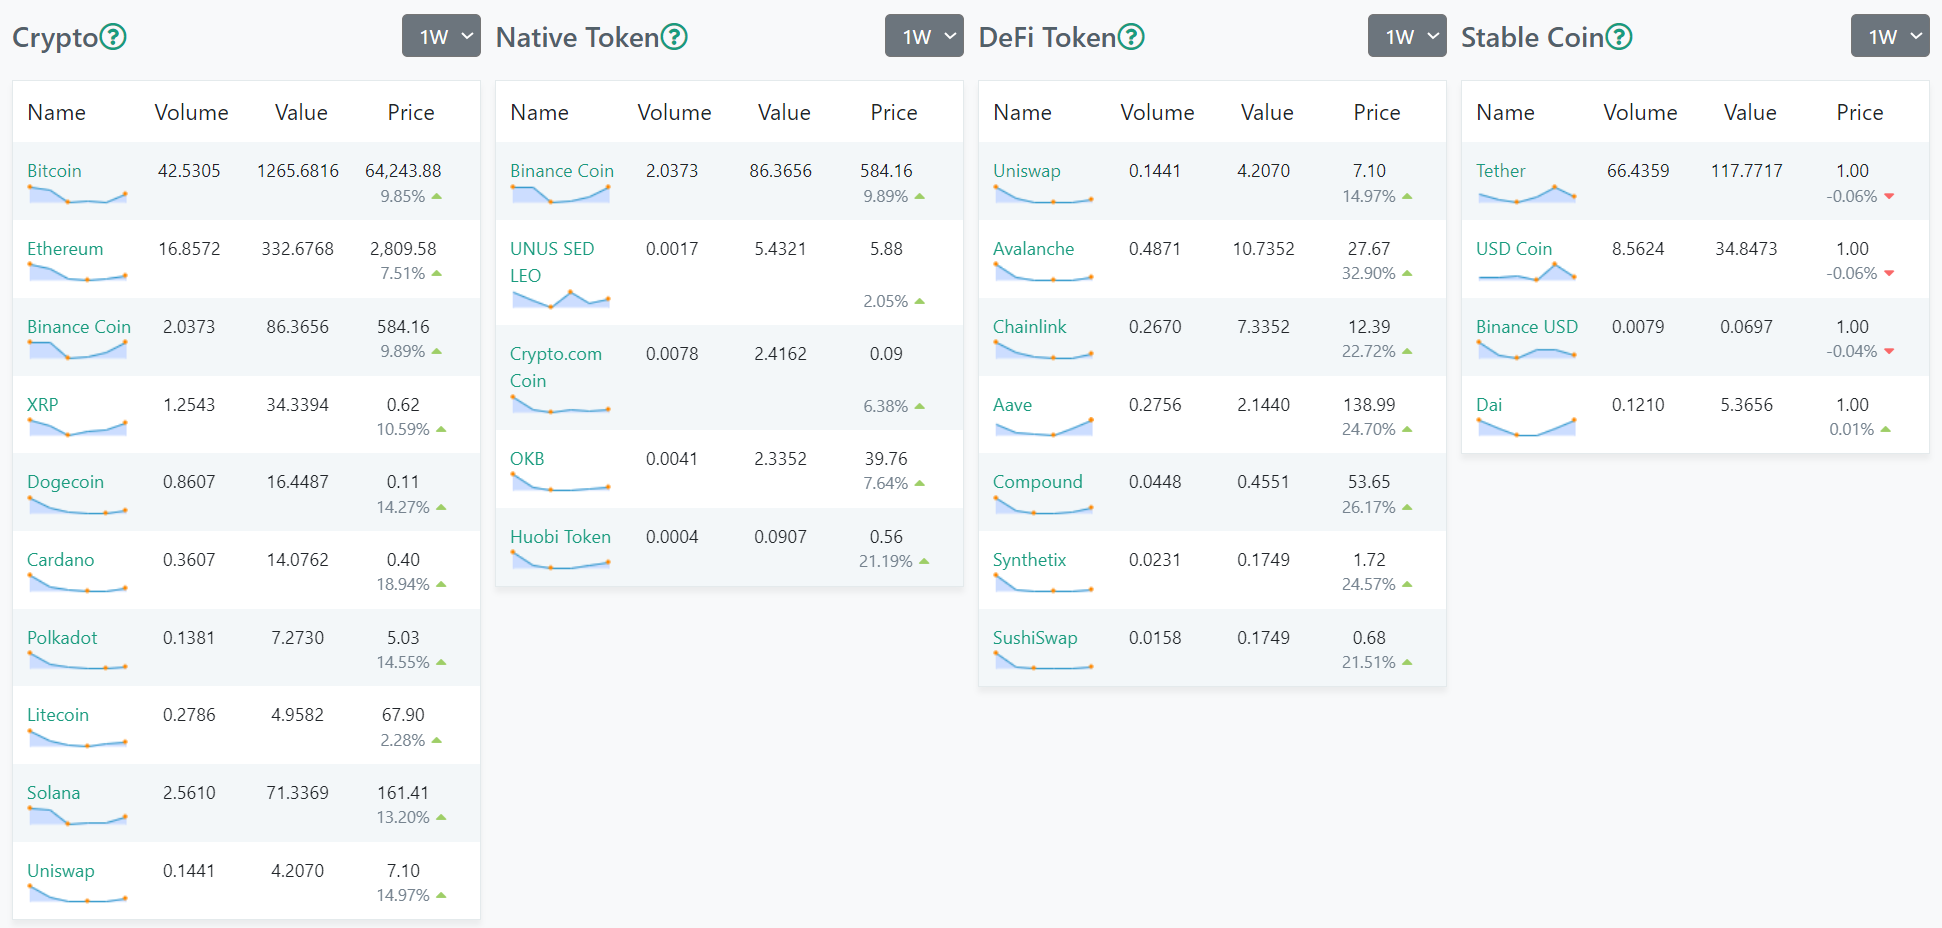
Crypto
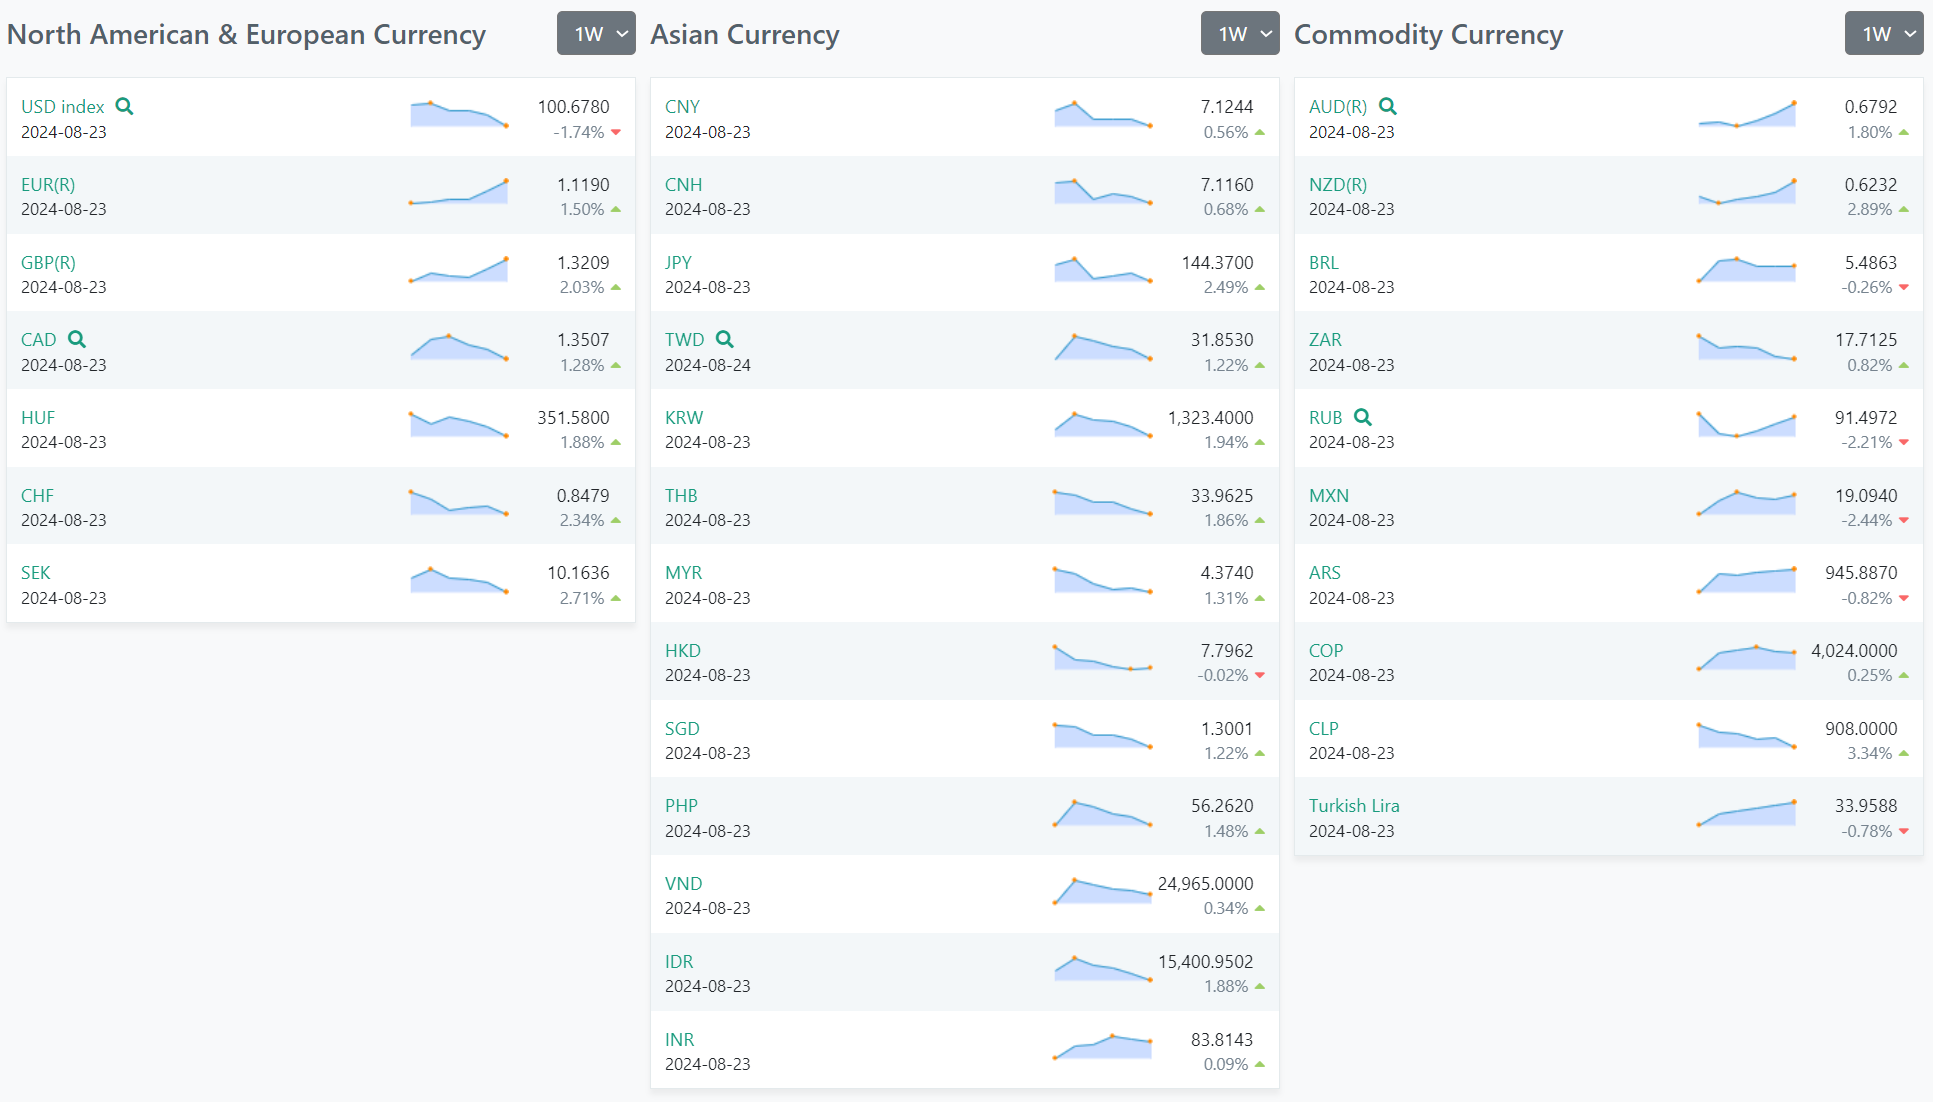
Forex
US Investor Sentiment
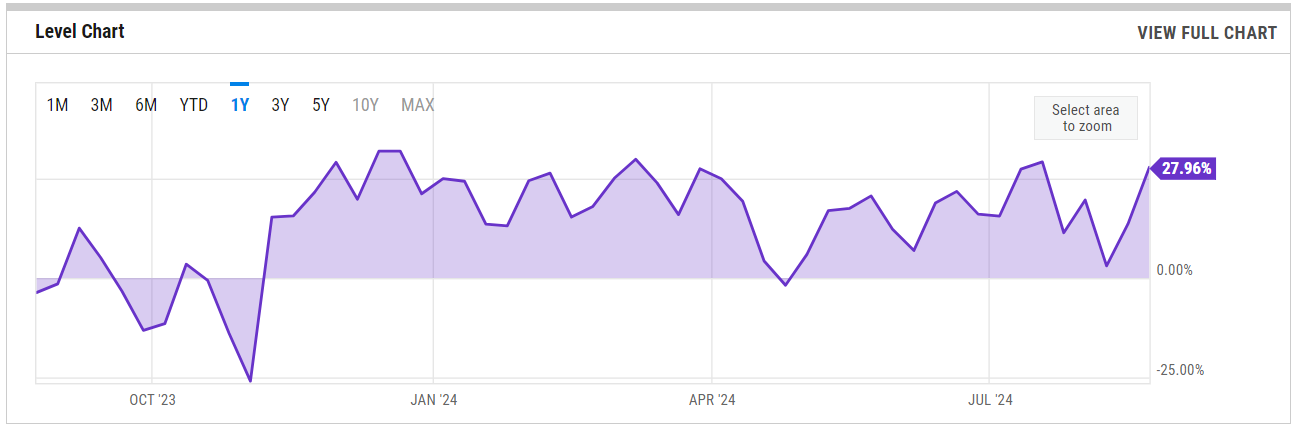
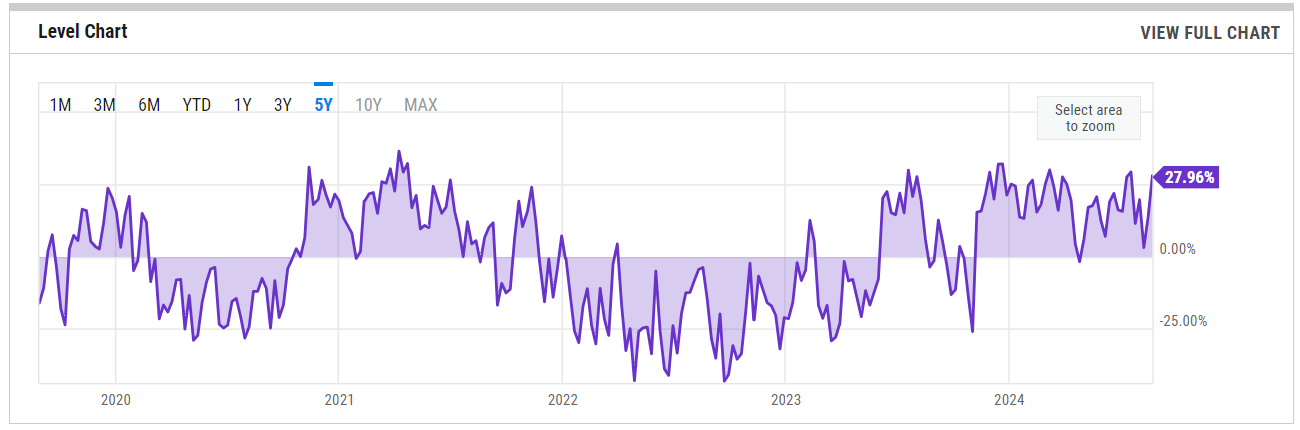
%Bull-Bear Spread
US Investor Sentiment, % Bull-Bear Spread is at 27.96%, compared to 13.65% last week and 5.75% last year. This is higher than the long-term average of 6.68%.
1-Year View
5-Year View
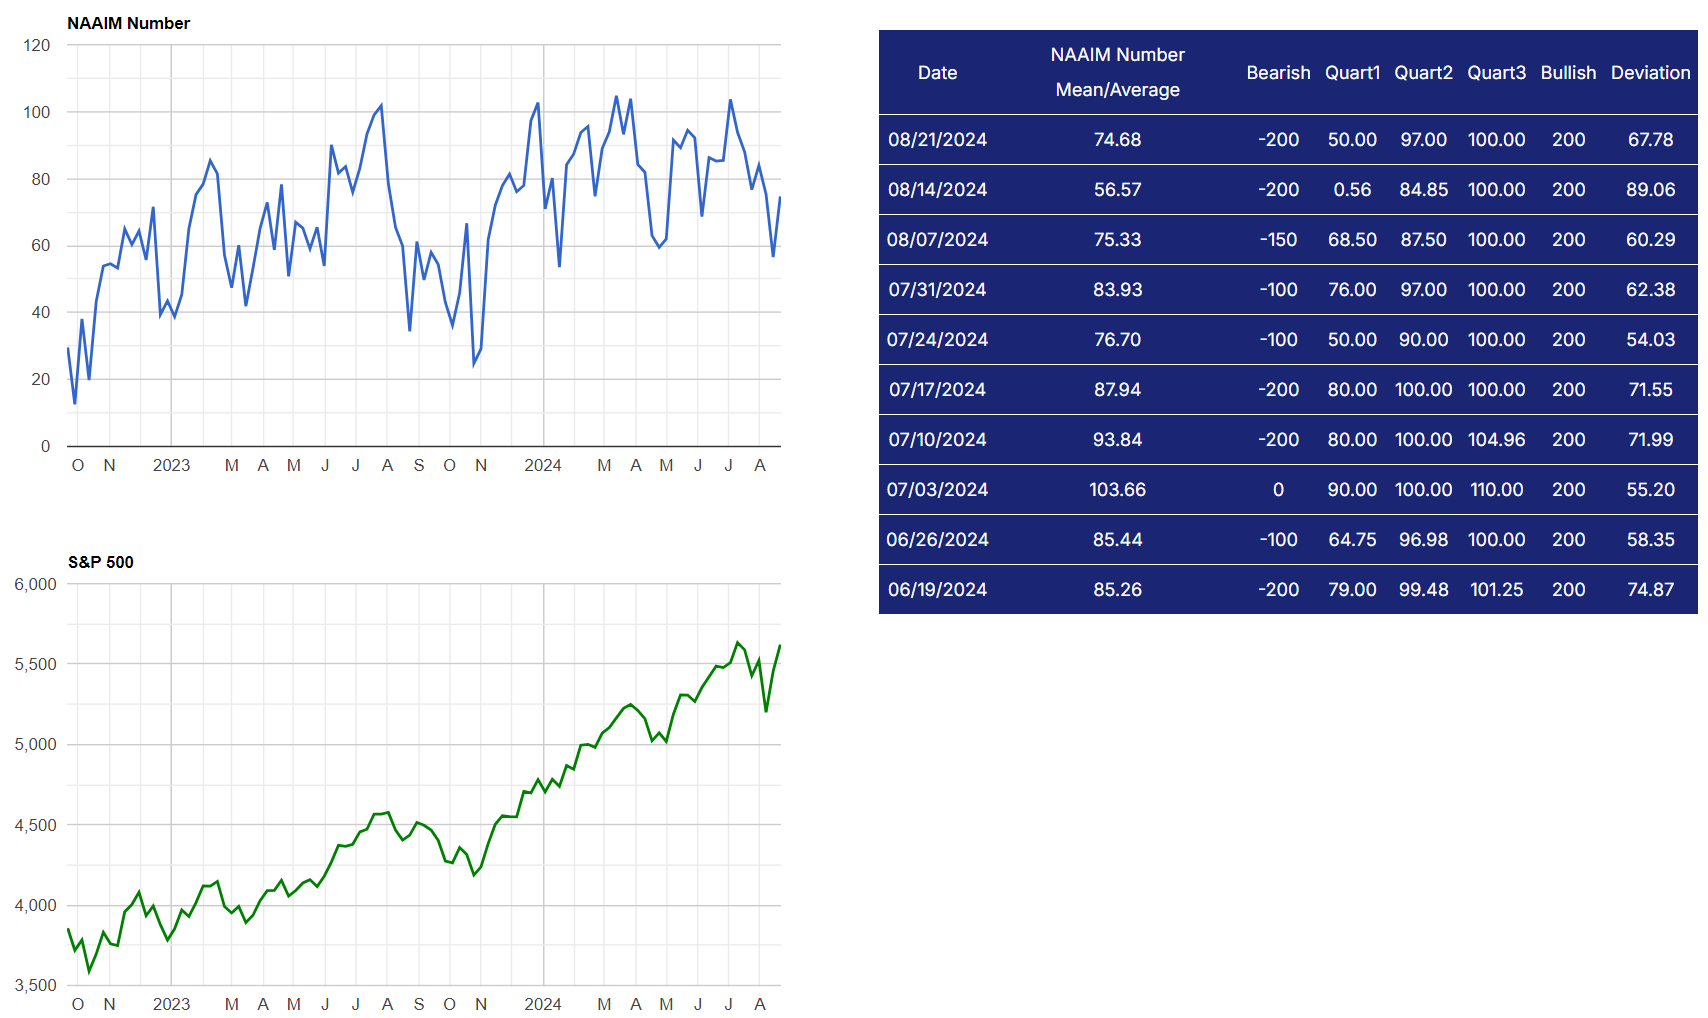
NAAIM Exposure Index
As of August 2024, the NAAIM Exposure Index, which tracks the average equity exposure of active investment managers, has experienced some fluctuations over the year. The most recent reading, as of August 21, 2024, is 74.68. This marks a notable shift from earlier in the year when the index exhibited higher average exposure, including a peak of 103.66 in early July. Current readings reflect a moderate increase in market exposure among active managers compared to the previous week.
Throughout the year, the index has reflected the cautious stance of managers, with exposure generally trending lower during periods of heightened market uncertainty, such as when there were concerns about inflation and Federal Reserve policies. This cautiousness was evident in mid-August when the index dropped to 56.57 before rebounding slightly. The index's year-to-date average has been marked by this ebb and flow, reflecting the ongoing tension between market optimism and risk management.
Overall, the recent changes in the NAAIM Exposure Index suggest that while active managers have generally maintained a positive outlook on the market, they have also been quick to reduce exposure in response to perceived risks, especially during volatile periods.
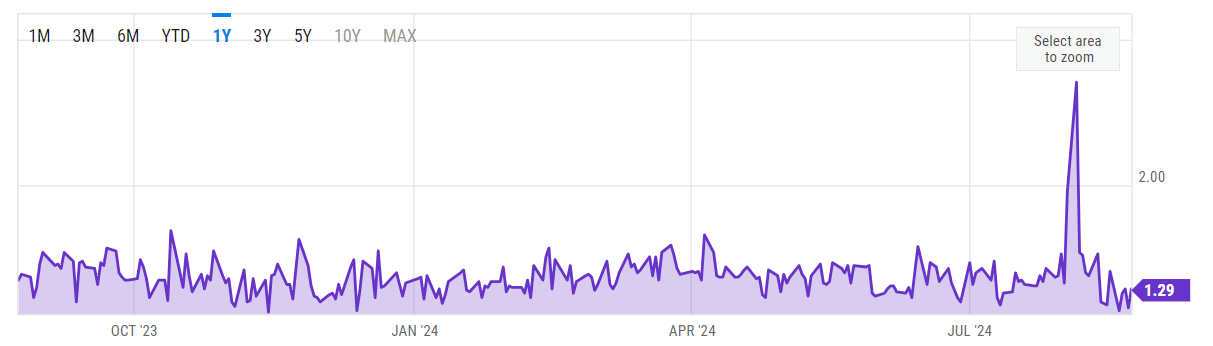
SPX Put/Call Ratio
1-Year View
5-Year View
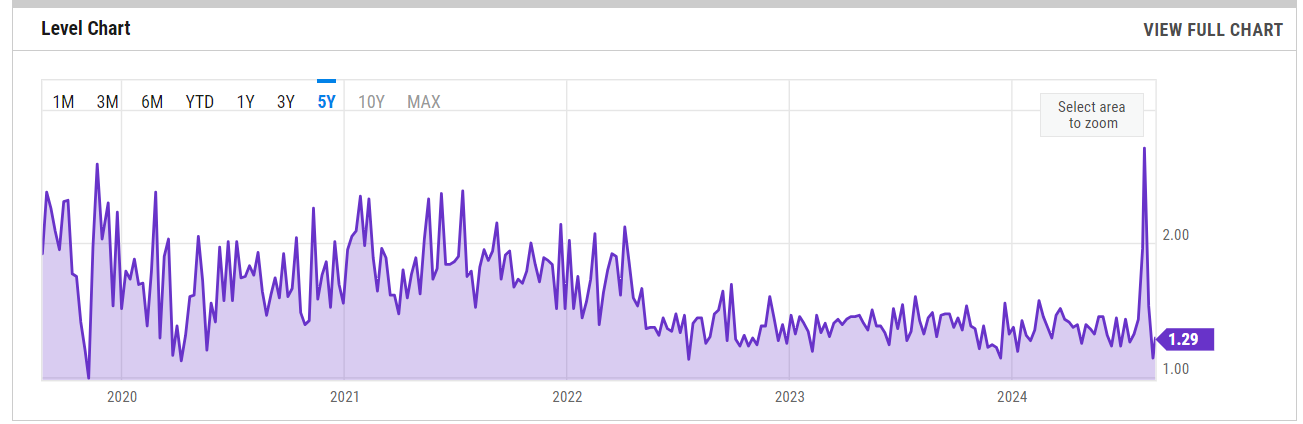
CBOE Equity Put/Call Ratio
1-Year View
5-Year View
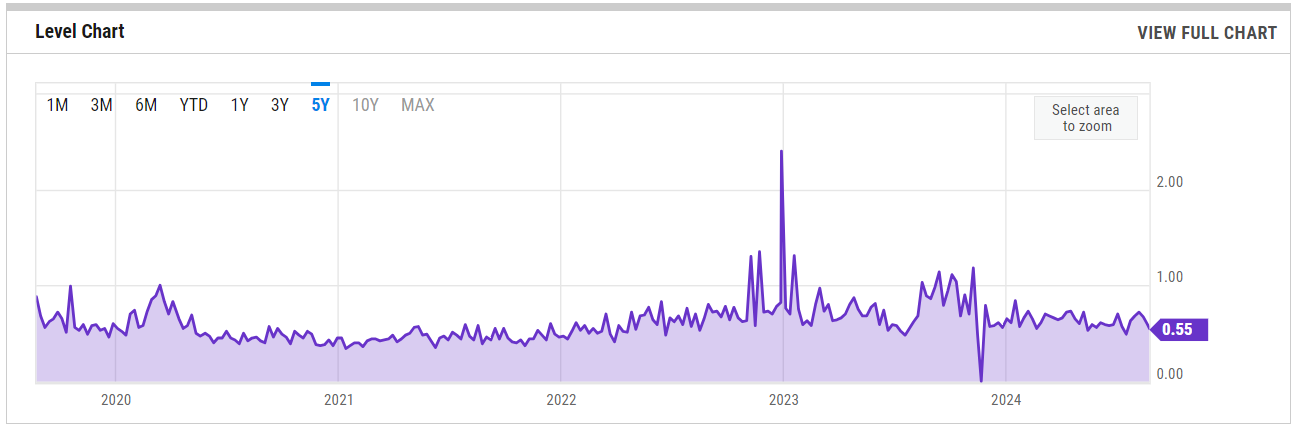
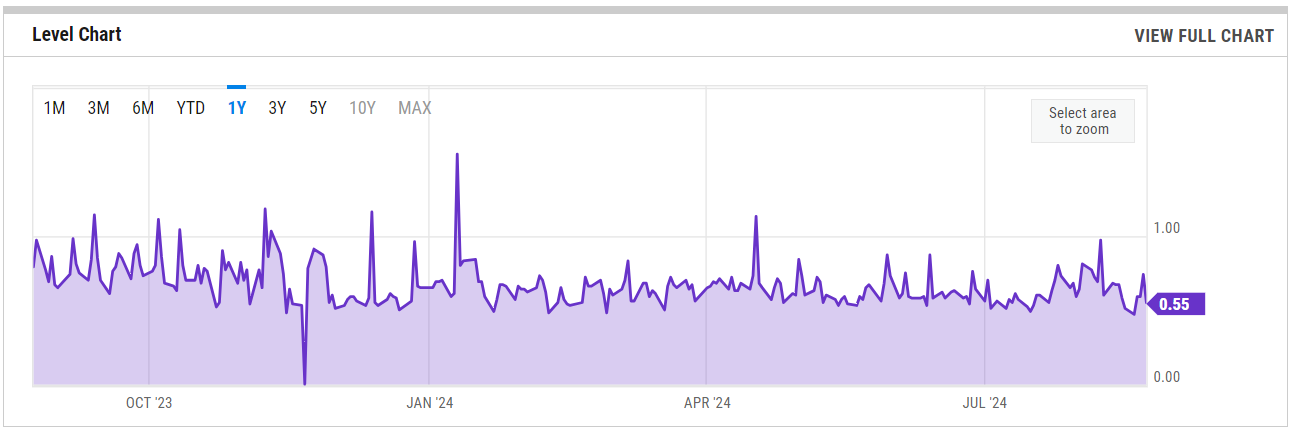
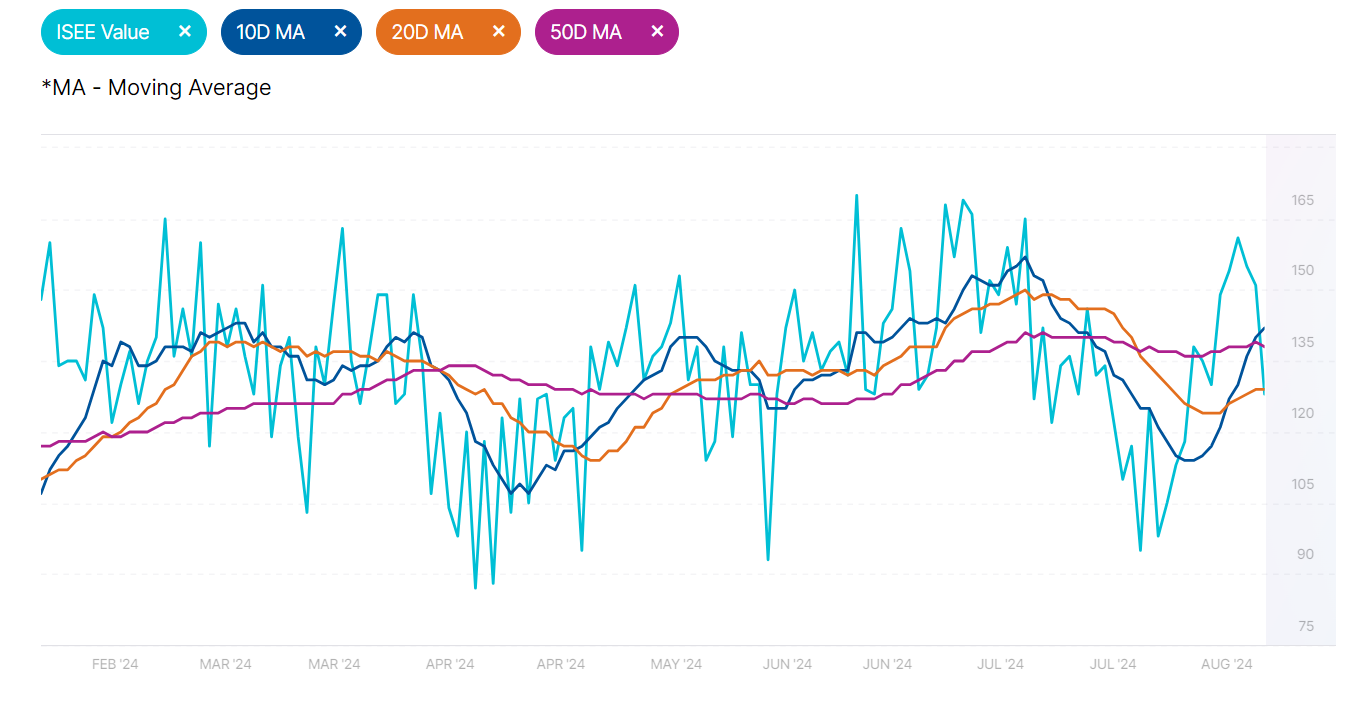
ISEE Sentiment Index
The ISEE (International Securities Exchange Sentiment) Index is a measure of investor sentiment derived from options trading. Unlike traditional put/call ratios, the ISEE Index focuses only on opening long customer transactions and is adjusted to remove market-maker and firm trades, providing a purer sentiment reading.
The ISEE Index typically ranges from 0 to 200, with readings above 100 indicating more call options being bought relative to put options, suggesting bullish sentiment. Conversely, readings below 100 suggest bearish sentiment, with more puts being purchased relative to calls.
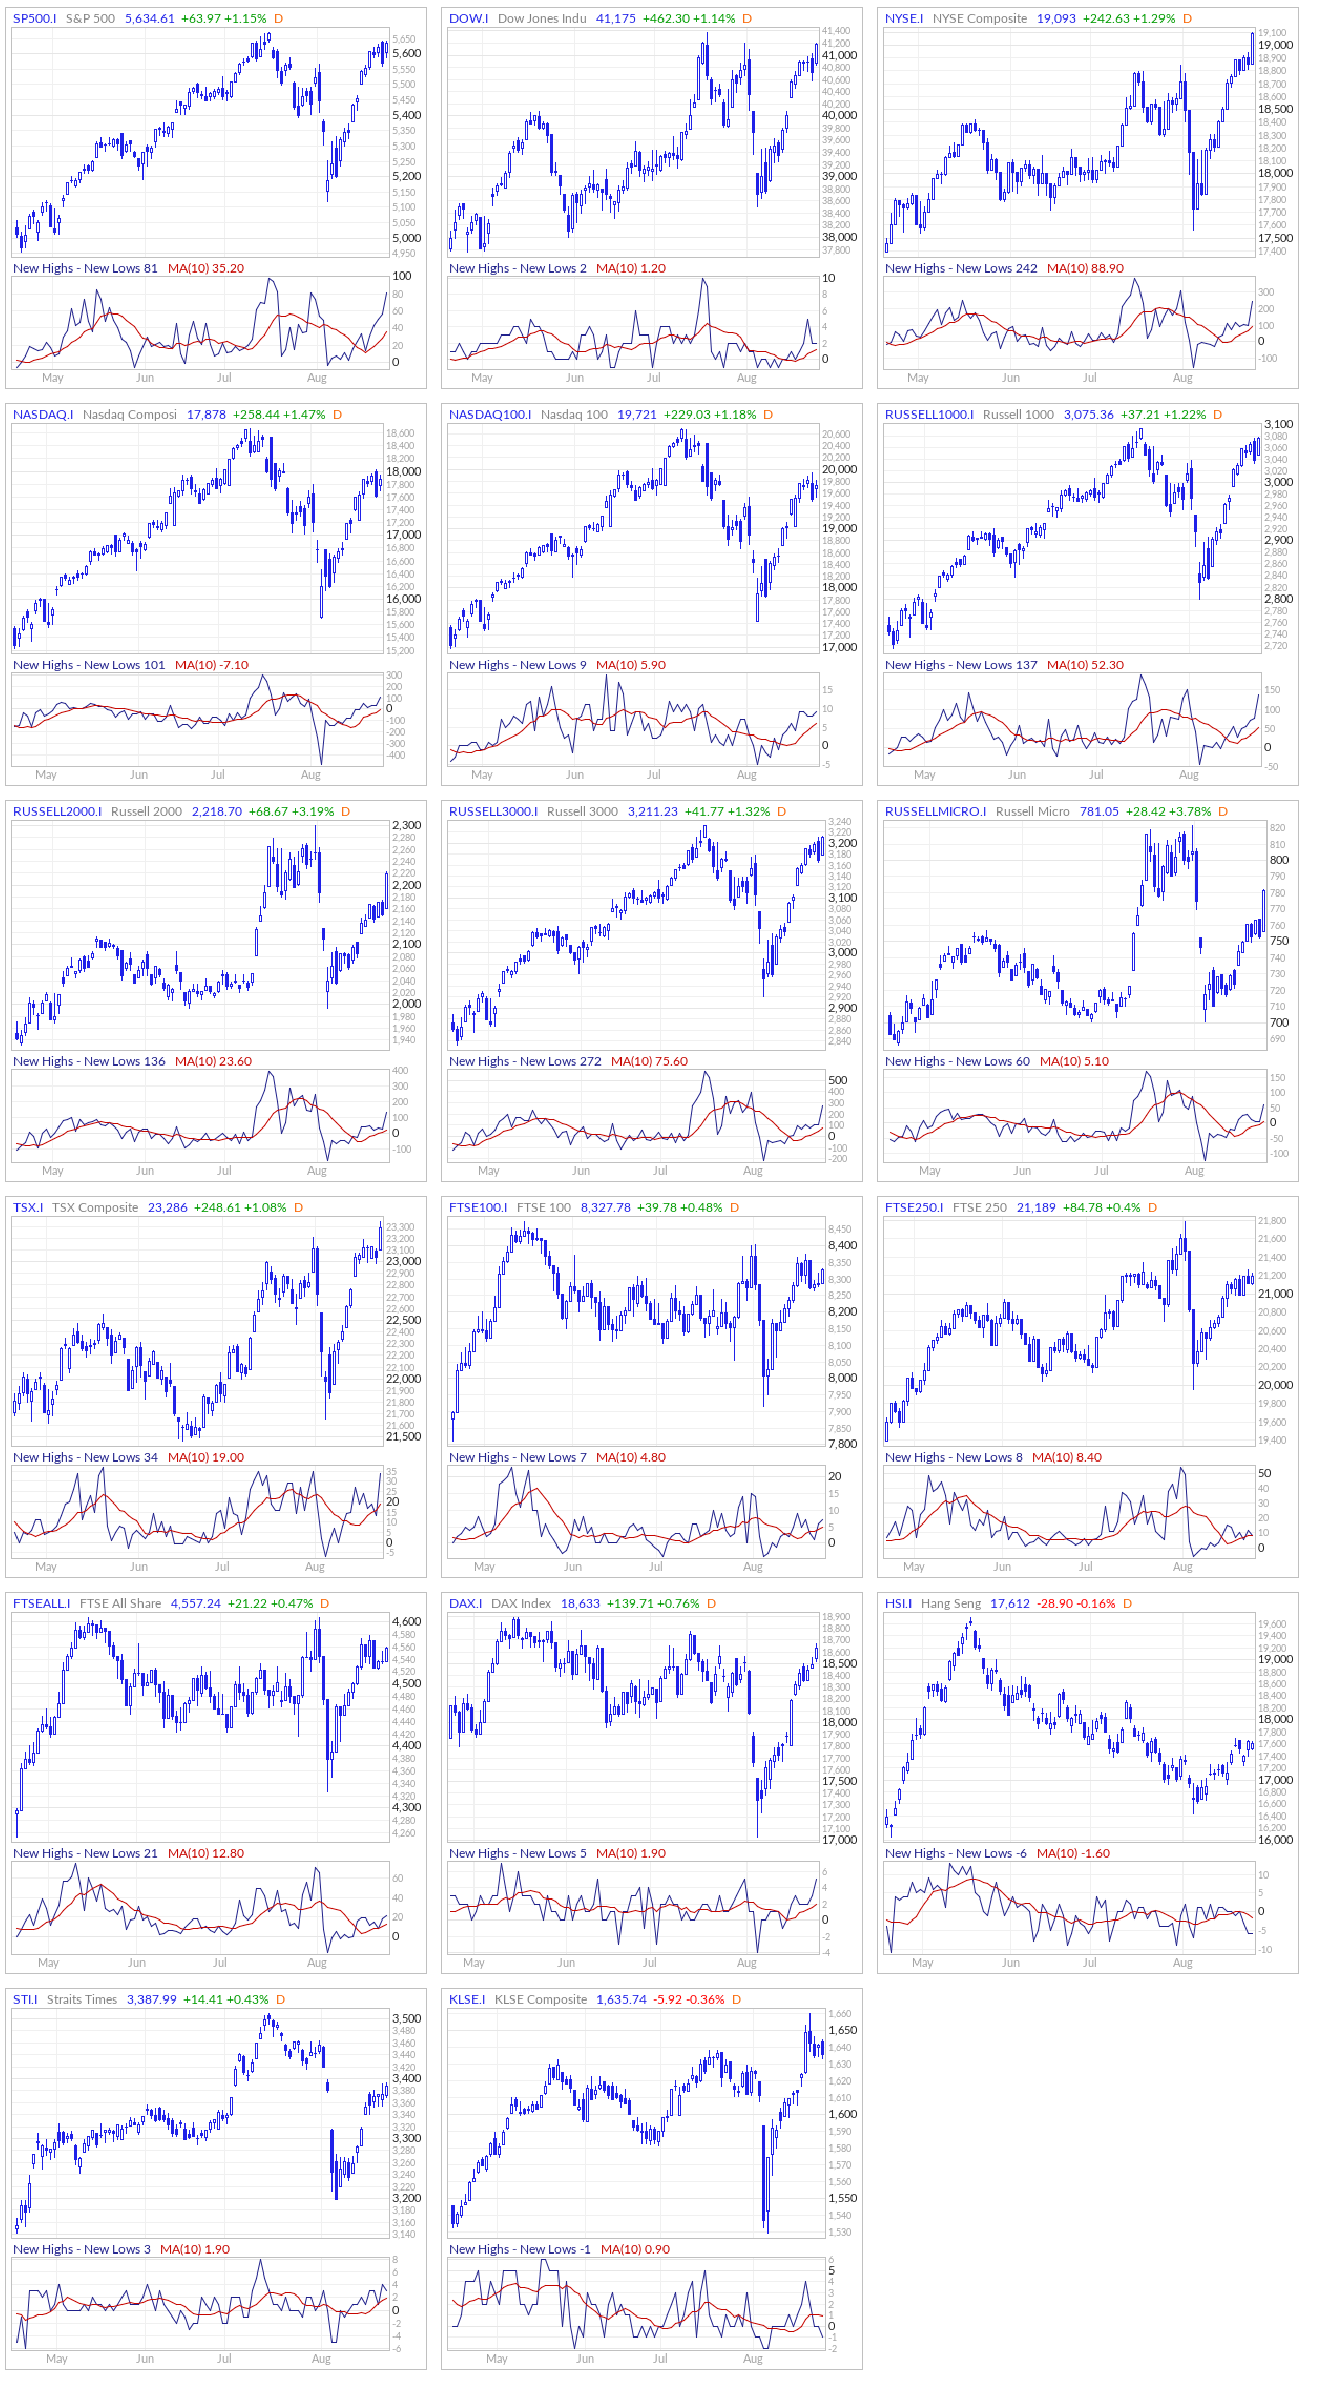
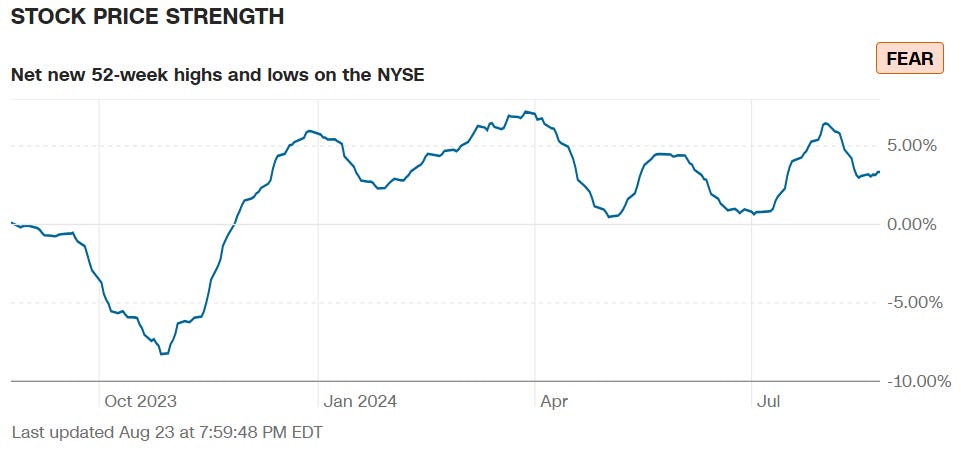
New Highs - New Lows
The New Highs - New Lows indicator (NH-NL) displays the daily difference between the number of stocks reaching new 52-week highs and the number of stocks reaching new 52-week lows. The NH-NL indicator generally reaches its extreme lows slightly before a major market bottom. As the market then turns up from the major bottom, the indicator jumps up rapidly. During this period, many new stocks are making new highs because it's easy to make a new high when prices have been depressed for a long time. The NH-NL indicator oscillates around zero. If the indicator is positive, the bulls are in control. If it is negative, the bears are in control. As the cycle matures, a divergence often occurs as fewer and fewer stocks are making new highs (the indicator falls), yet the market indices continue to reach new highs. This is a classic bearish divergence that indicates that the current upward trend is weak and may reverse.
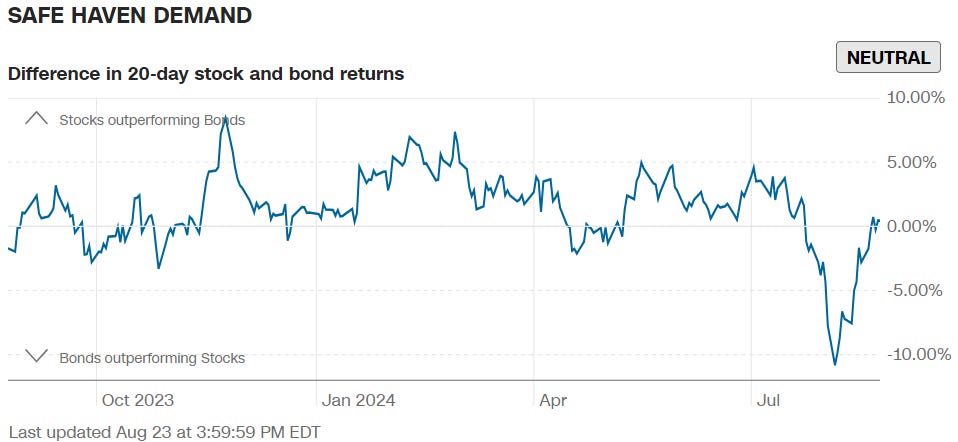
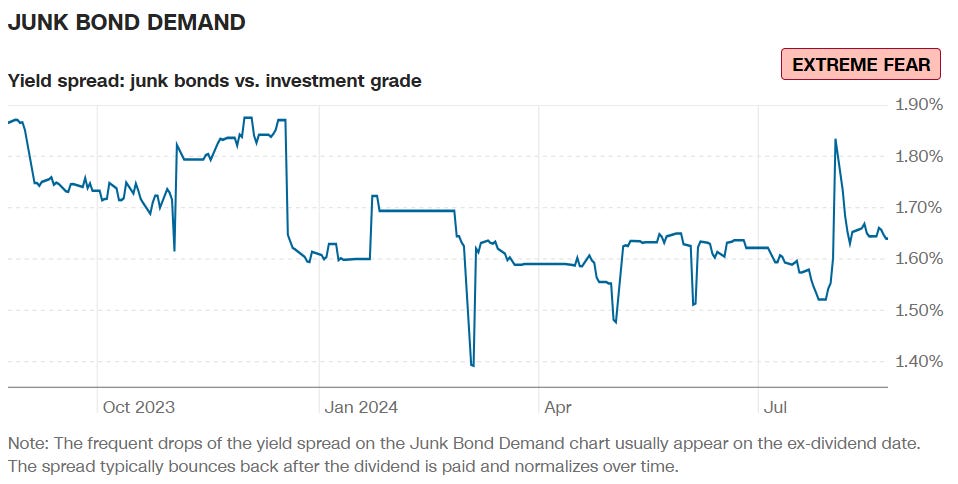
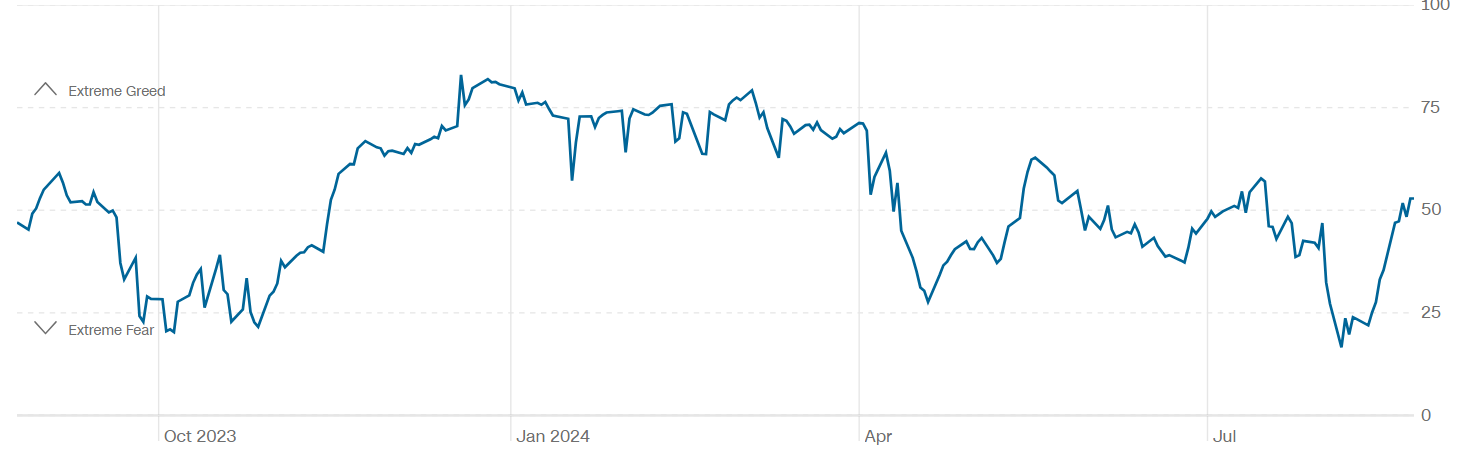
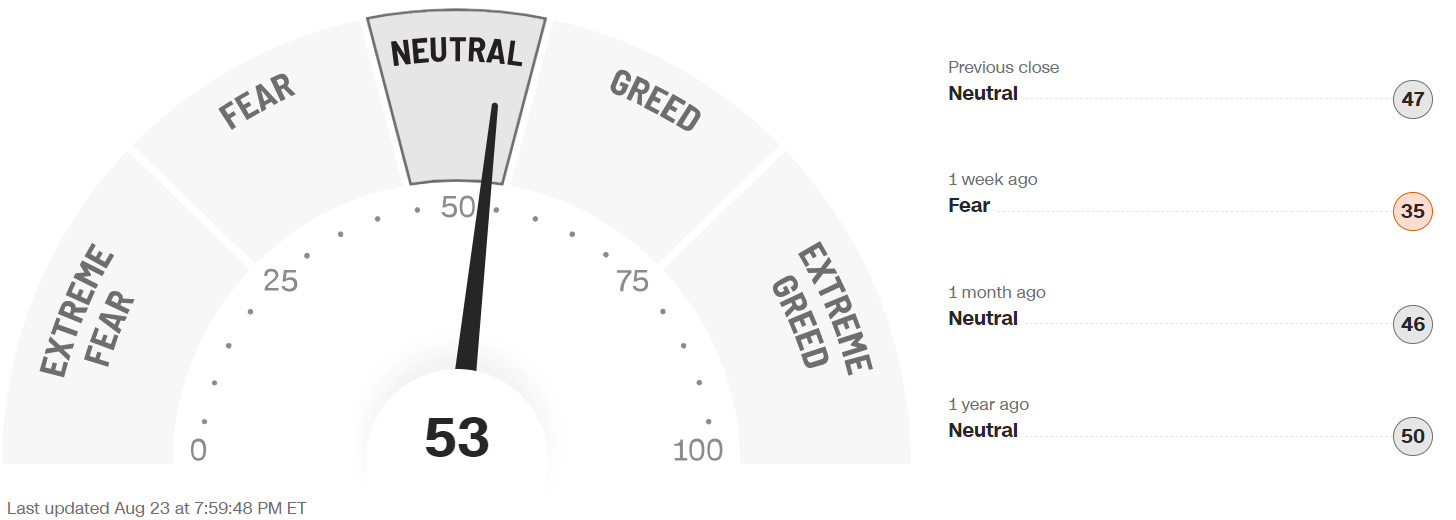
CNN 7 Fear & Greed Indicators + Composite Index
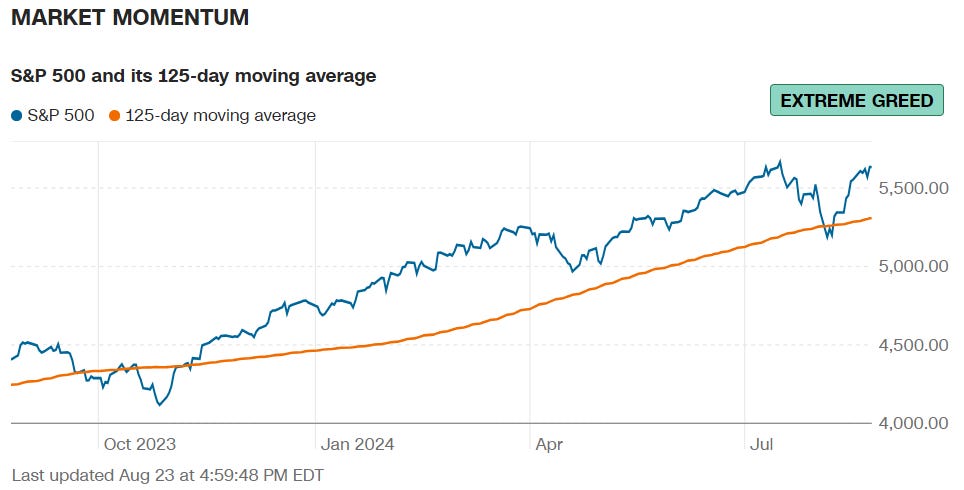
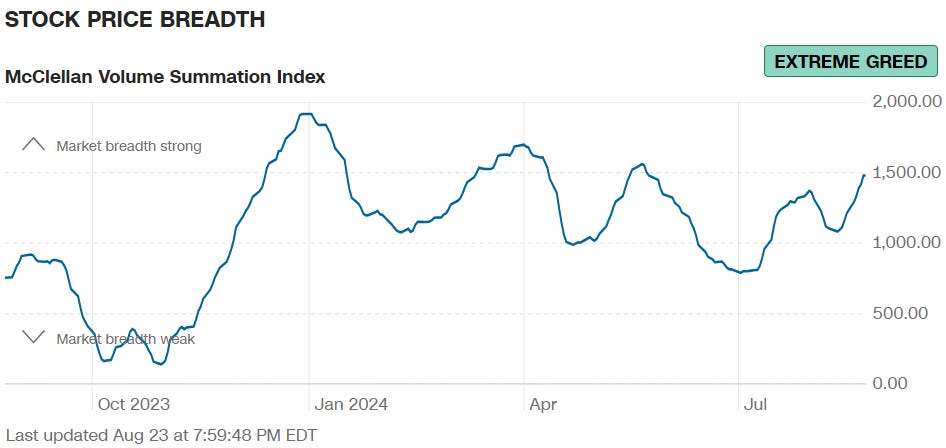
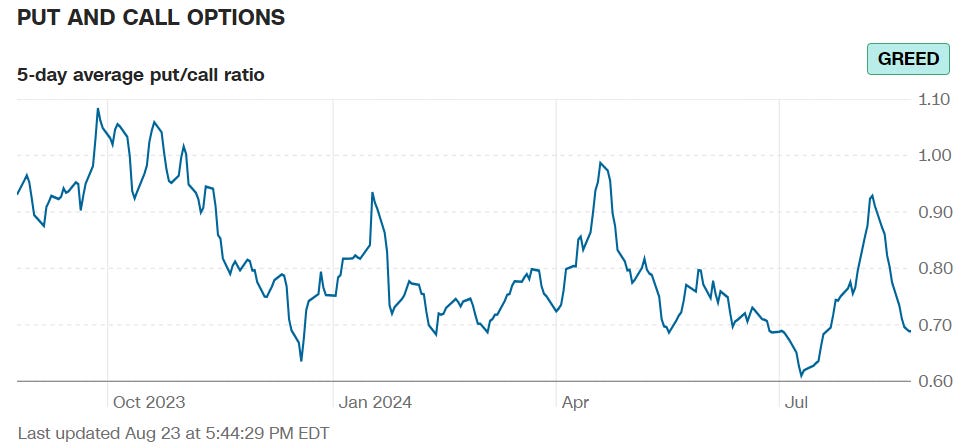
Final Composite Fear & Greed Index Reading
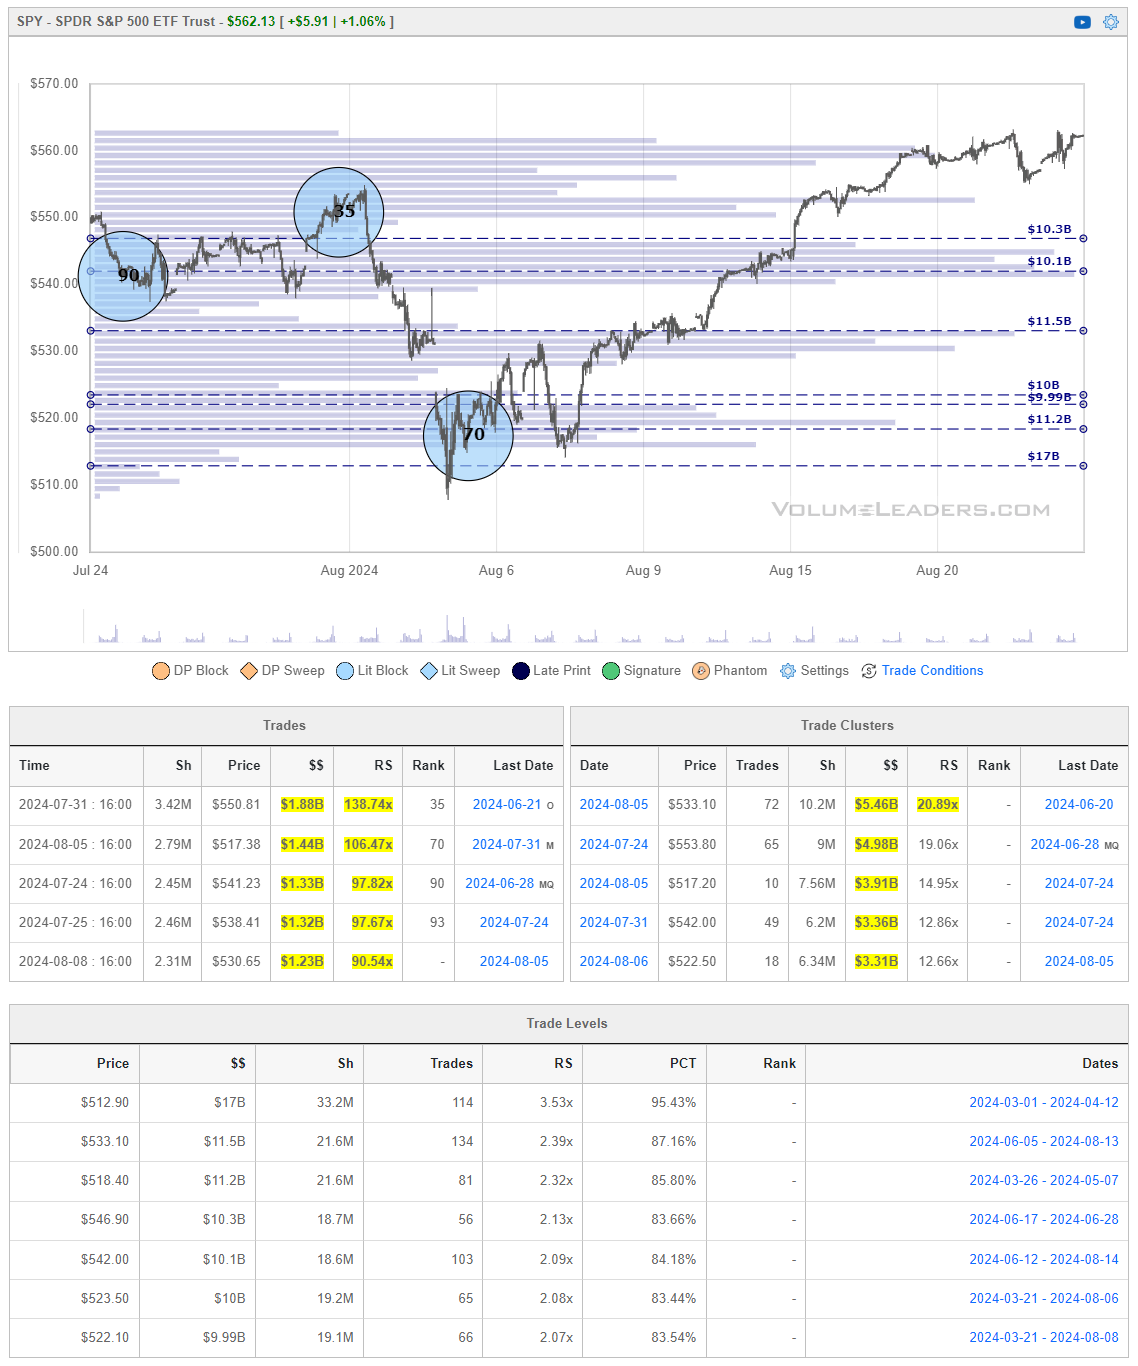
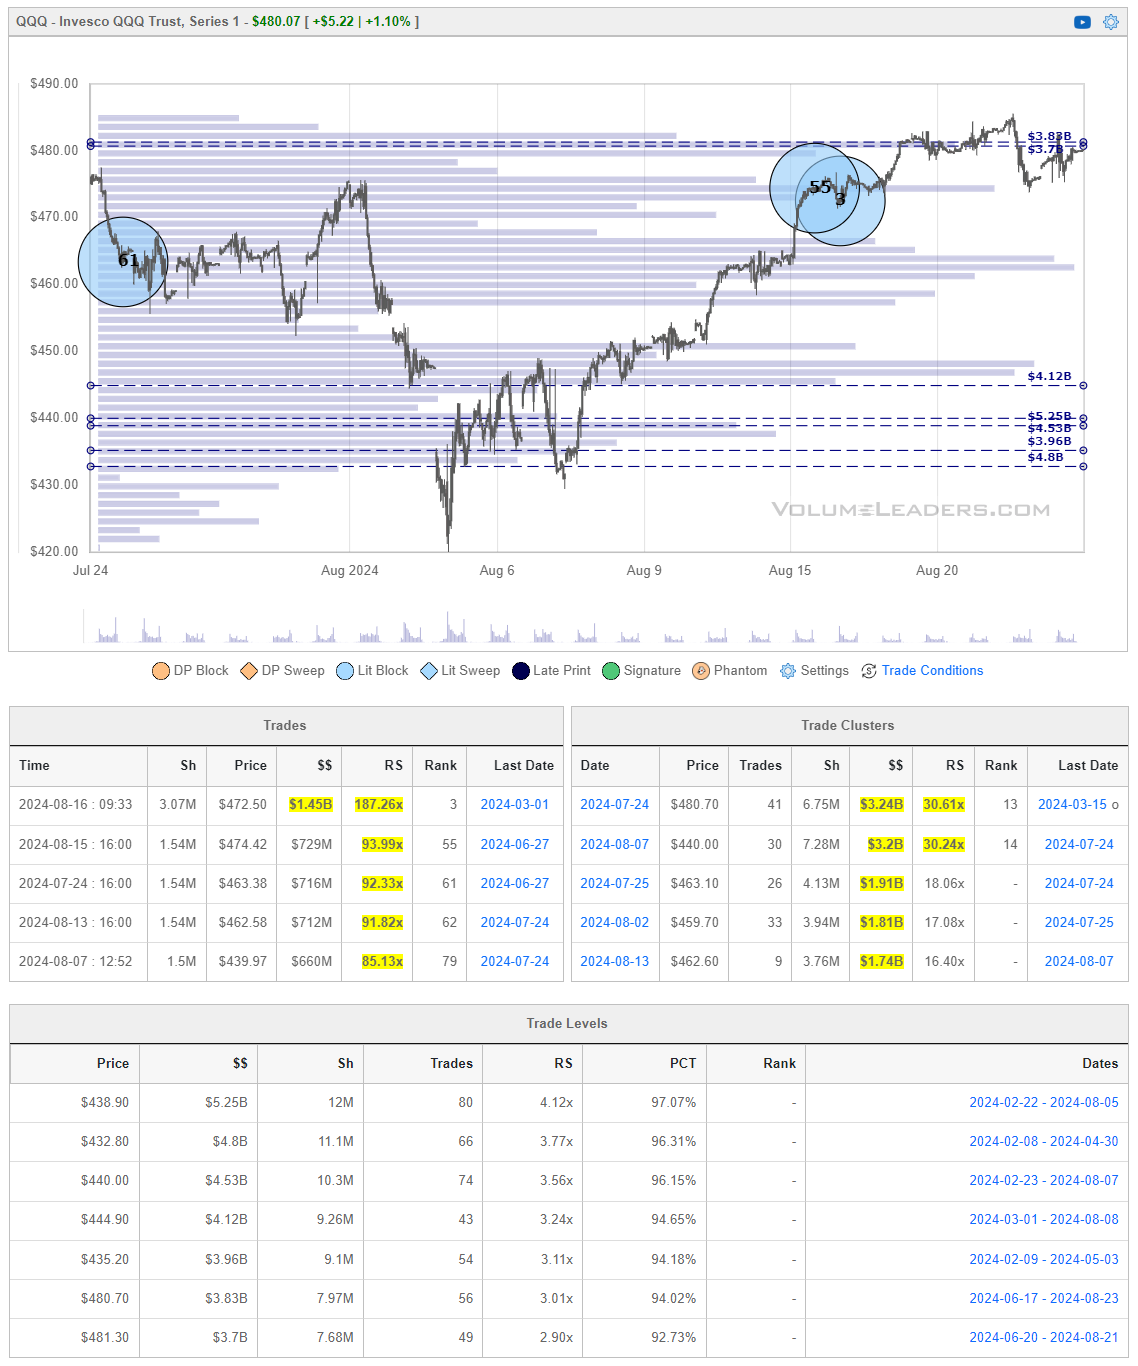
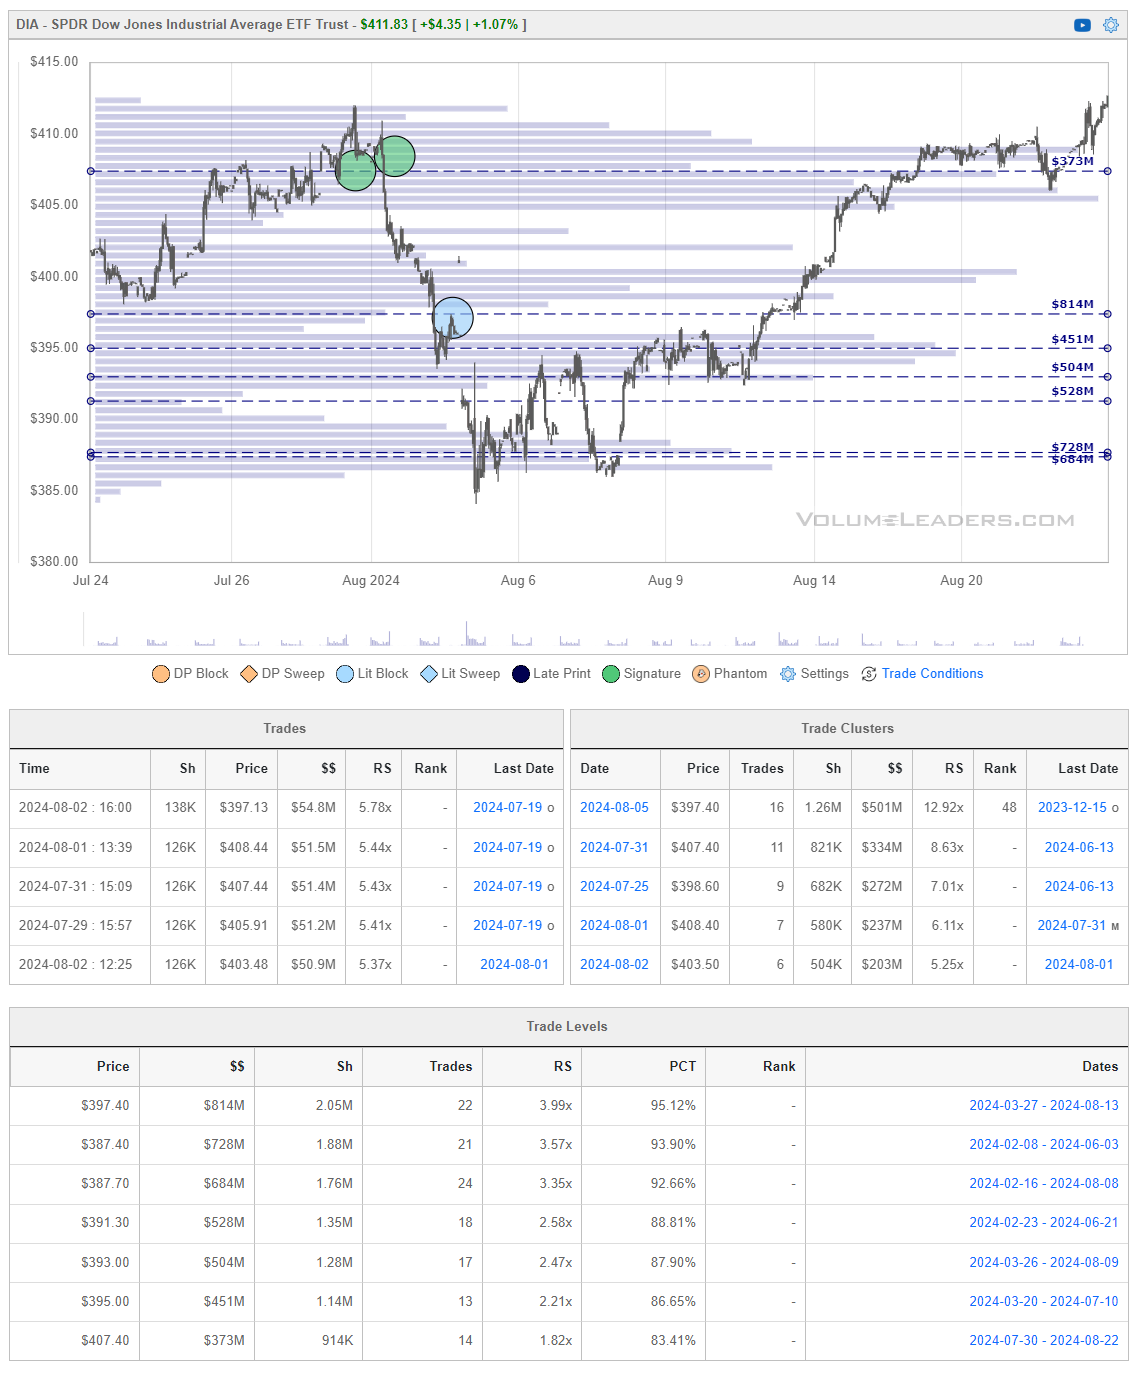
Institutional S/R Levels for Major Indices
When you’re a large institutional player, your primary goal is to find liquidity - places to do a ton of business with the least amount of slippage possible. VolumeLeaders.com automatically identifies and visually plots the exact spots where institutions are doing business and where they are are likely to return for more. It’s one of the primary reasons “support” and “resistance” concepts work and truly one of the reasons “price has memory”.
Levels from the VolumeLeaders.com platform can help you formulate trades theses about:
Where to add or take profit
Where to de-risk or hedge
What strikes to target for options
Where to expect support or resistance
This is just a small sample; there are countless ways to leverage this information into trades that express your views on the market. The platform covers thousands of tickers on multiple timeframes to accommodate all types of traders. Observe for yourself how accurate the levels are by marking-up your charts with the information in the “Trade Levels” boxes I’m giving for free below and play-along in real-time this week. These charts cover the past 7 or so sessions but subs will get new levels as they develop in real-time and have access to levels from other time frames. I’m confident you’ll see how clear-cut, intuitive and actionable this information is for yourself.
Top Institutional Order Flow
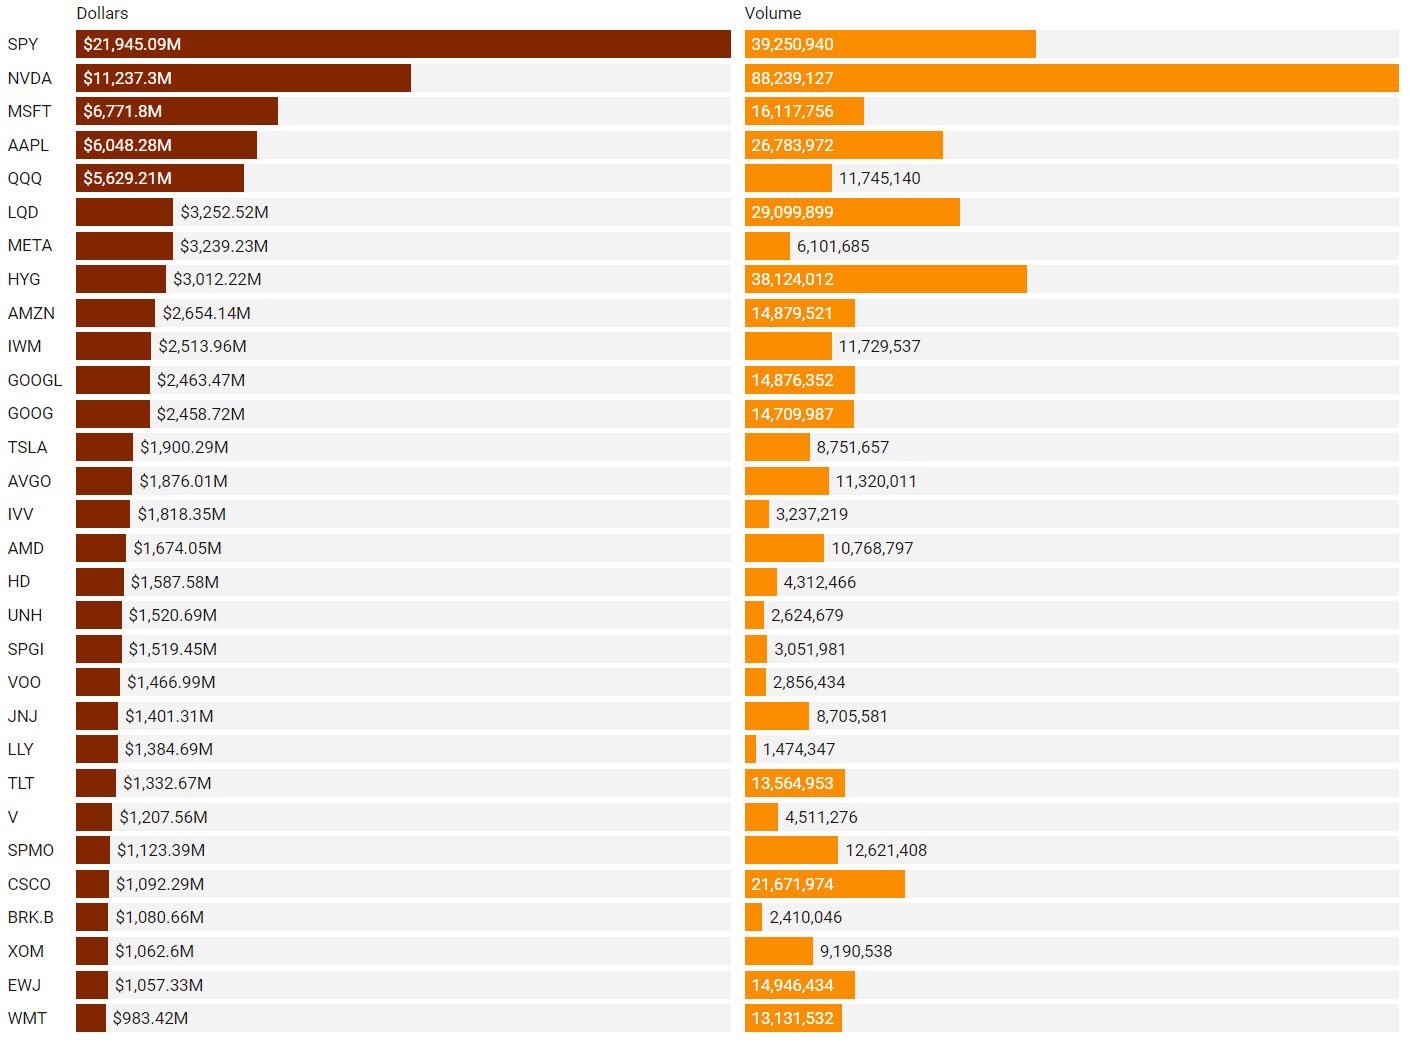
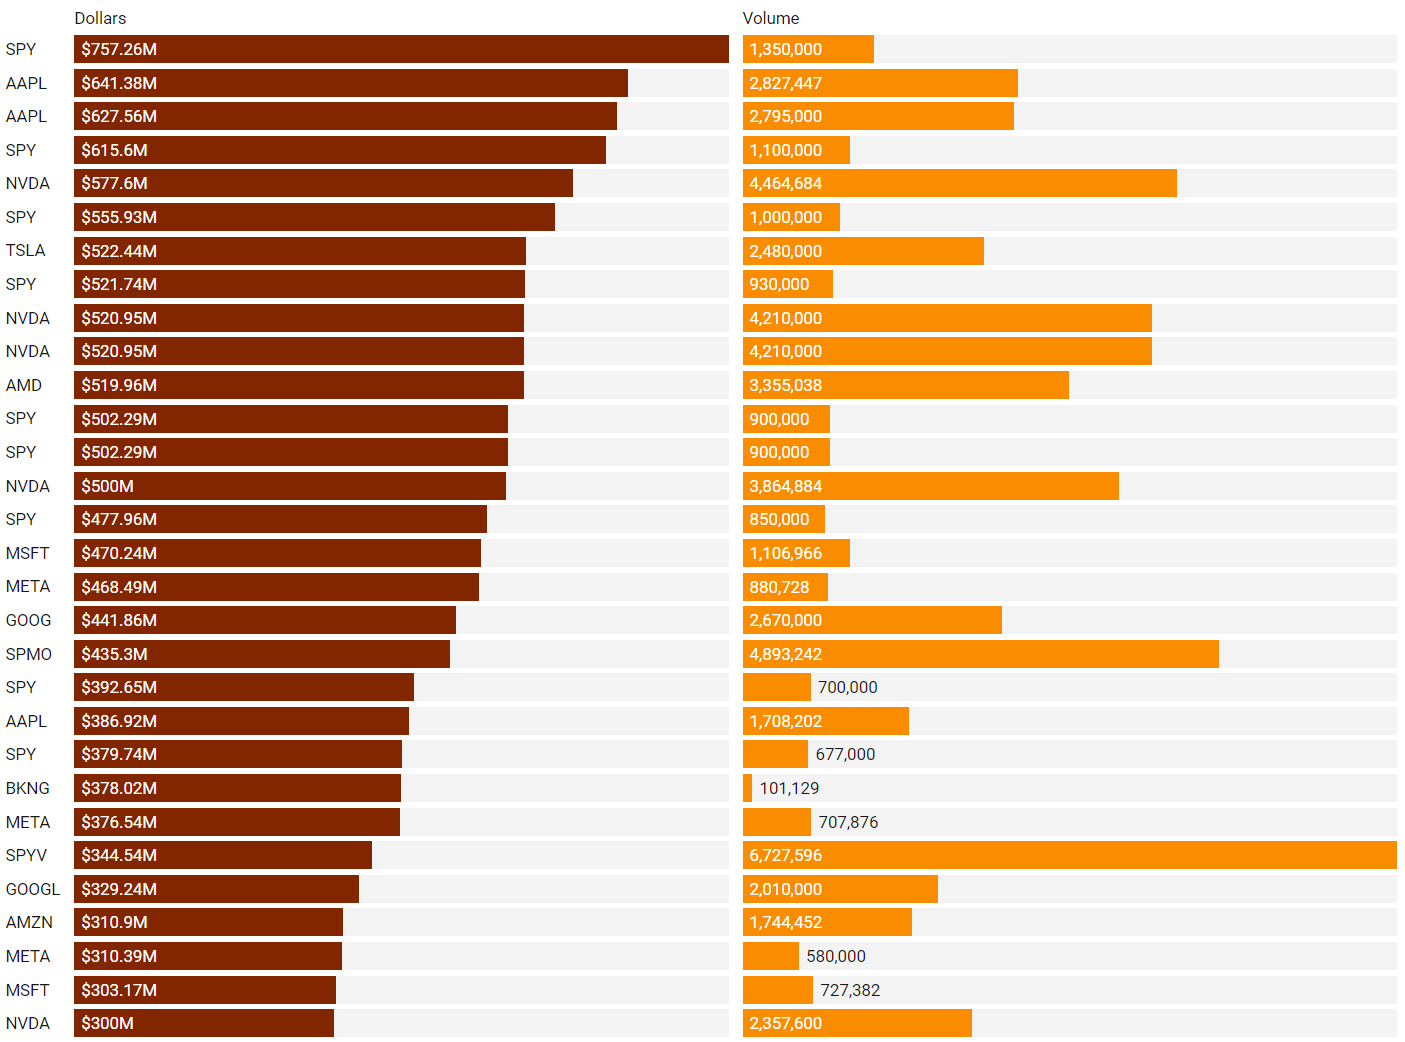
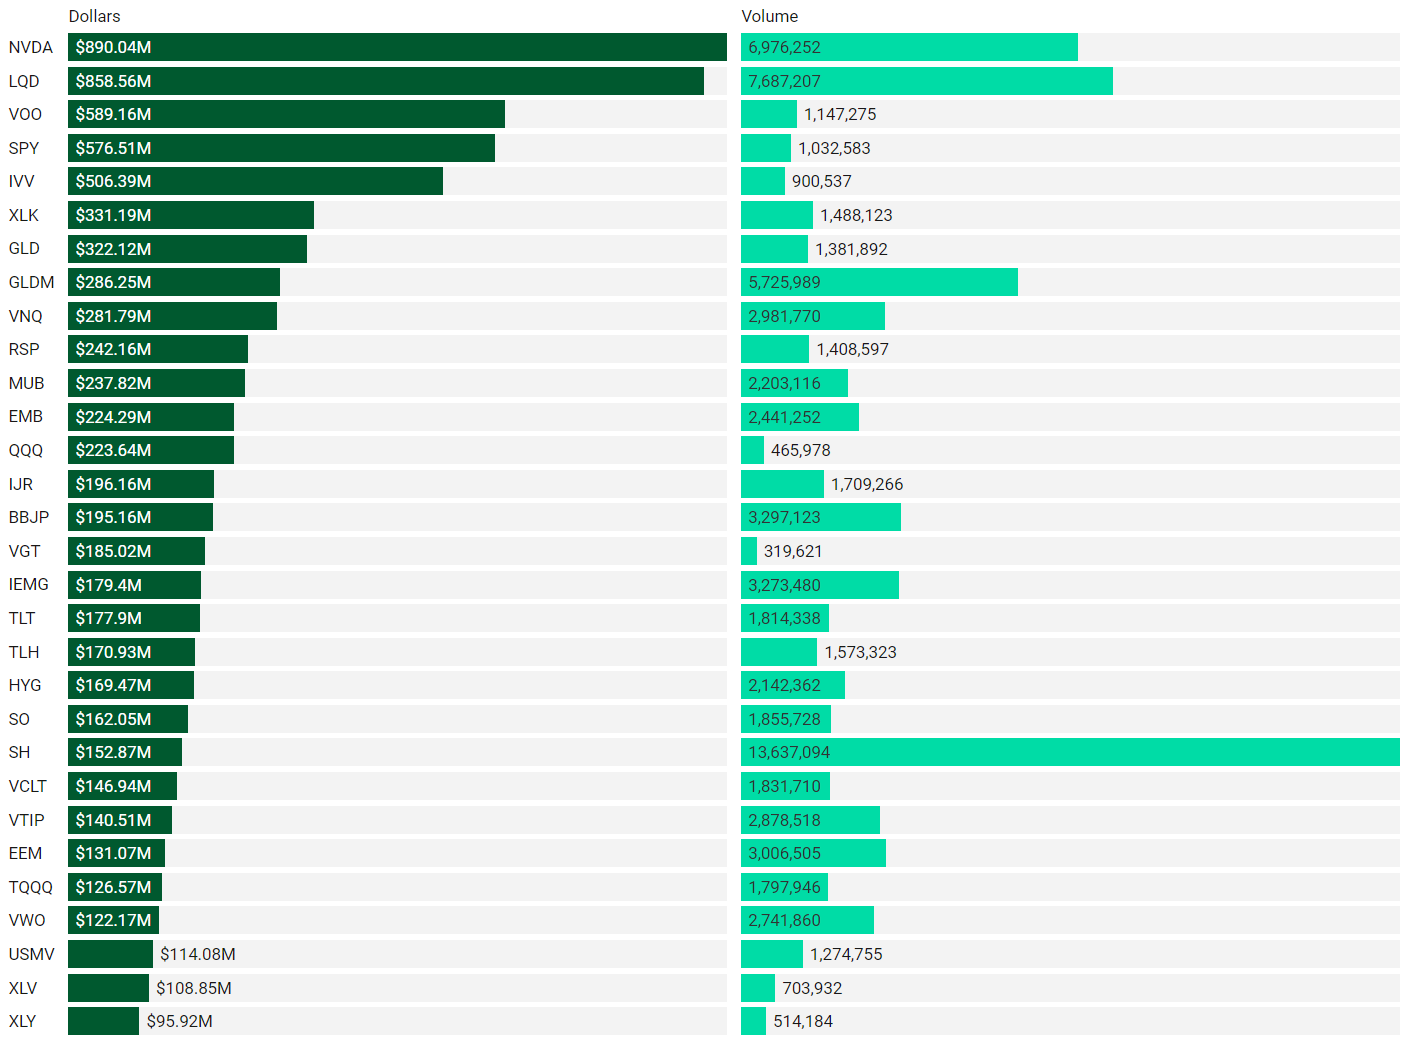
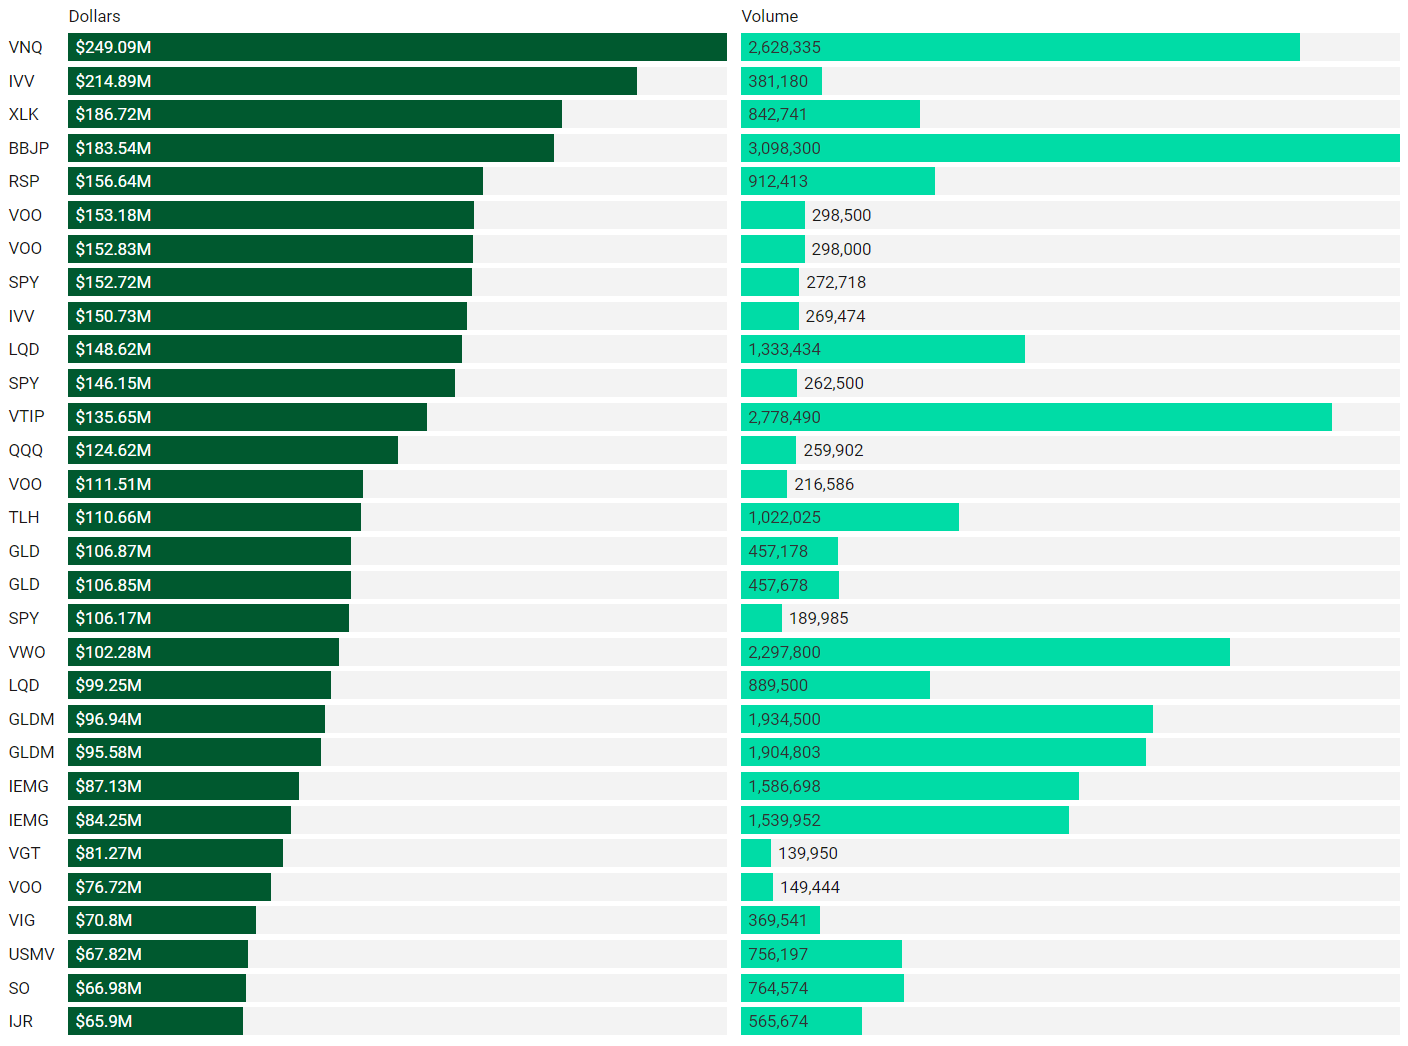
There are often great trades ideas or sources for inspiration in these prints. Only the top 30 of each group are shown but the full results are available in VL for you to browse at your leisure. Don’t forget to set up trade alerts inside the platform so you never miss institutional order flow that piques your interest or is otherwise important to you. Blue charts include all trade types including blocks on lit exchanges; red/orange charts are dark pool only trades; green charts are sweeps only.
Top Aggregate Dollars Transacted by Ticker

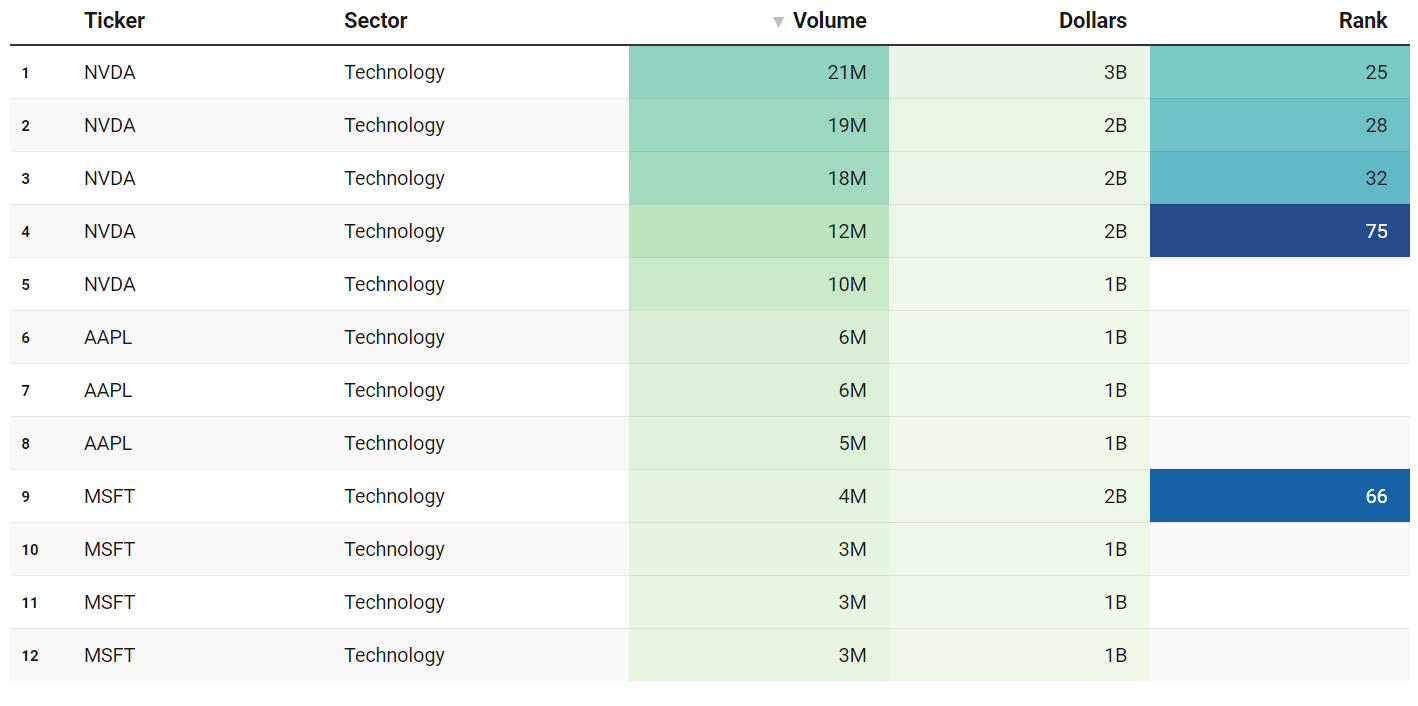
Largest Individual Trades by Dollars Transacted
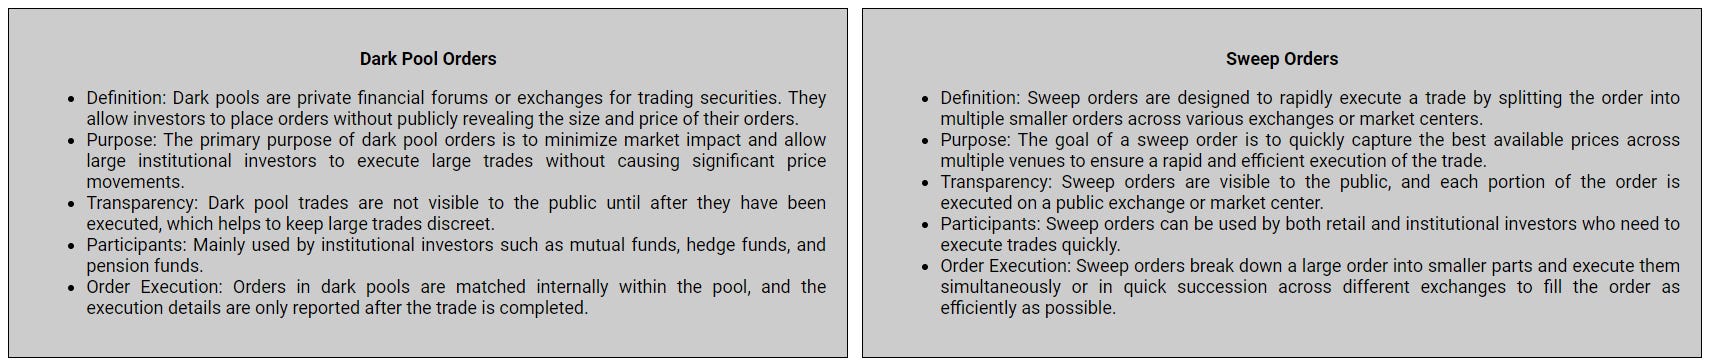
Top Aggregate Dark Pool Activity by Ticker
Largest Individual Dark Pool Blocks by Dollars
Top Aggregate Sweeps by Ticker
Top Individual Sweeps by Dollars Transacted
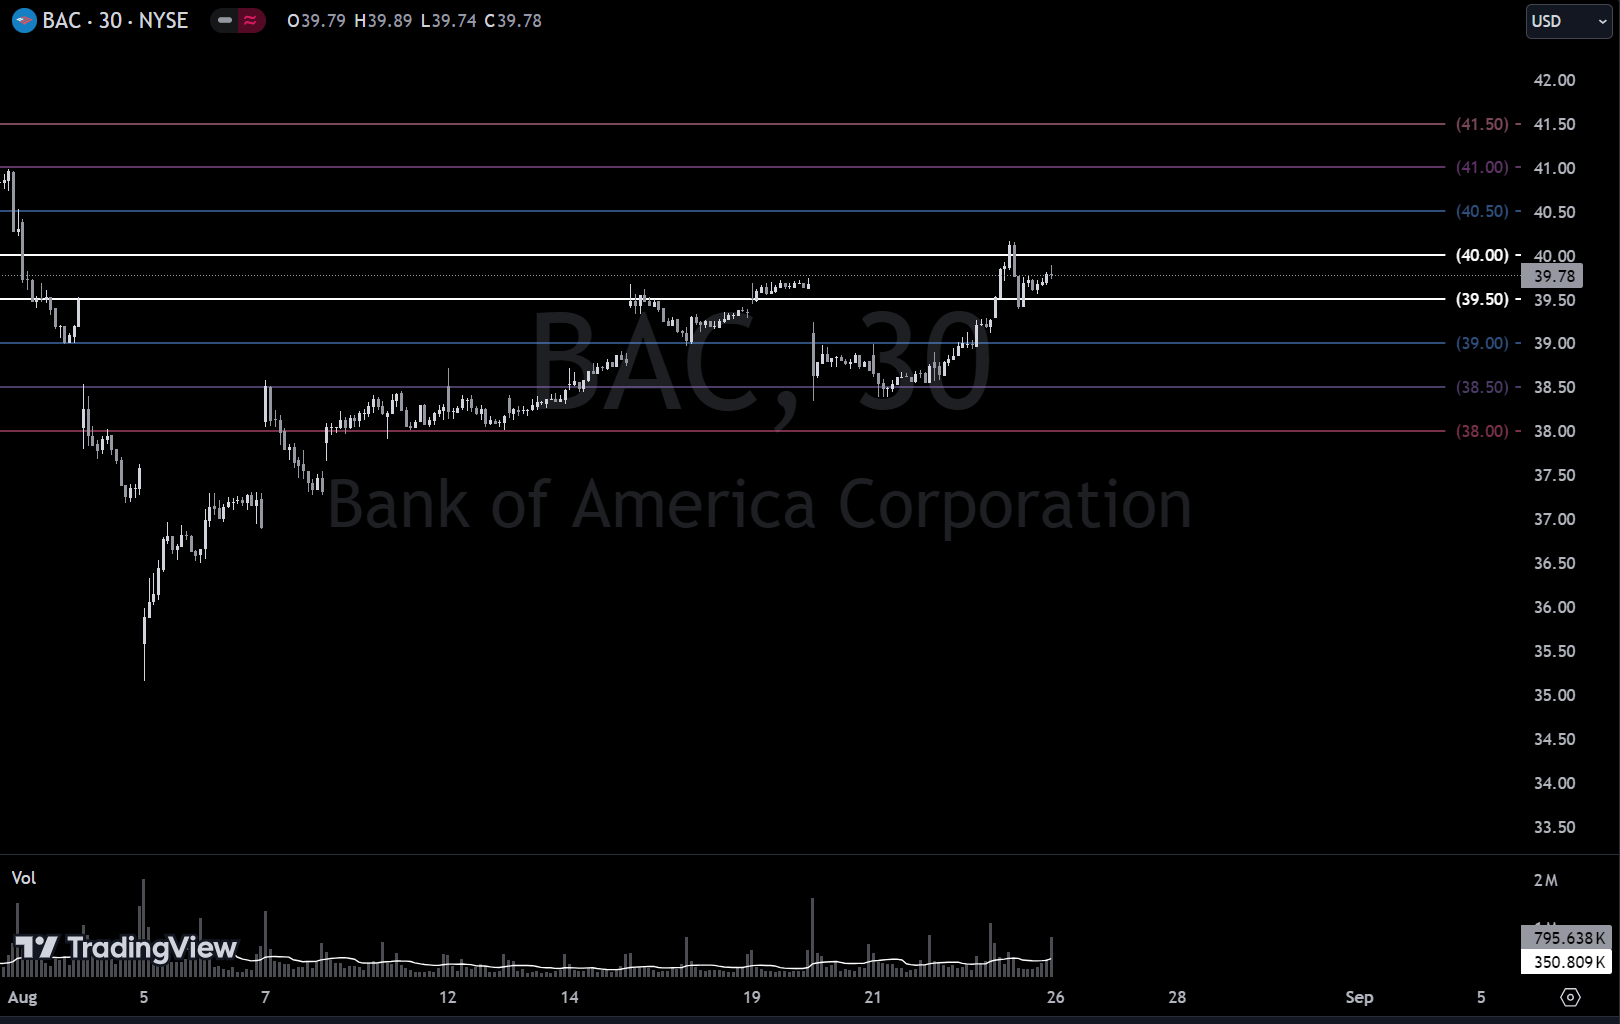
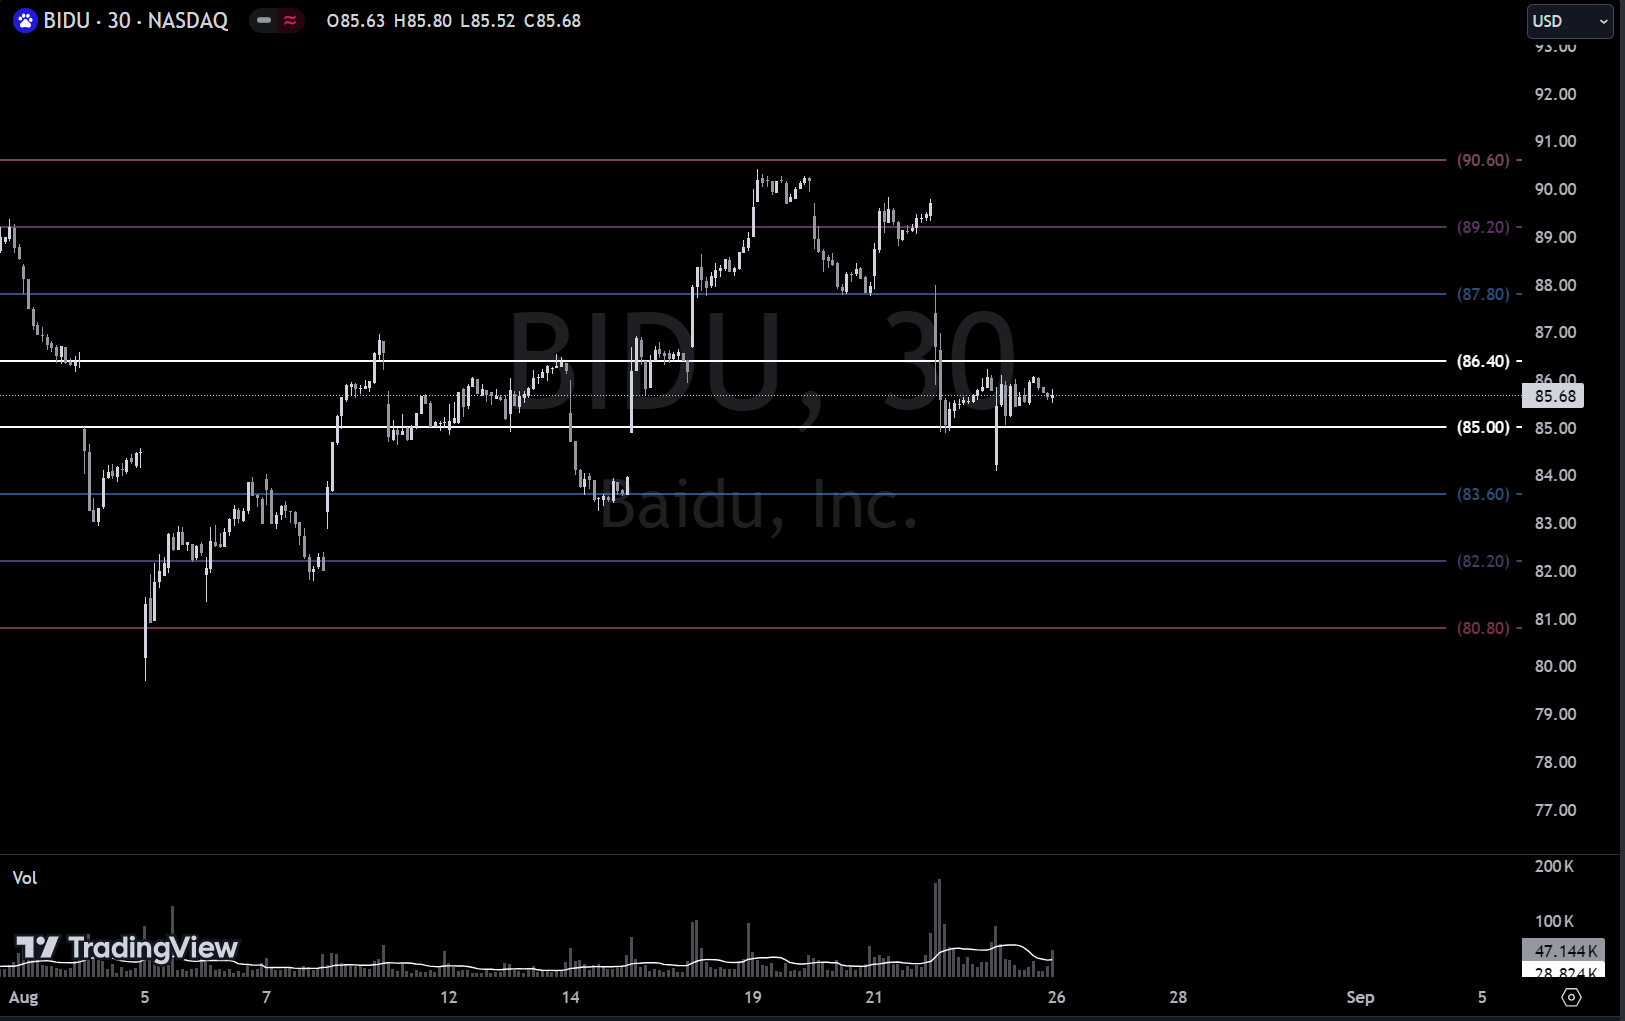
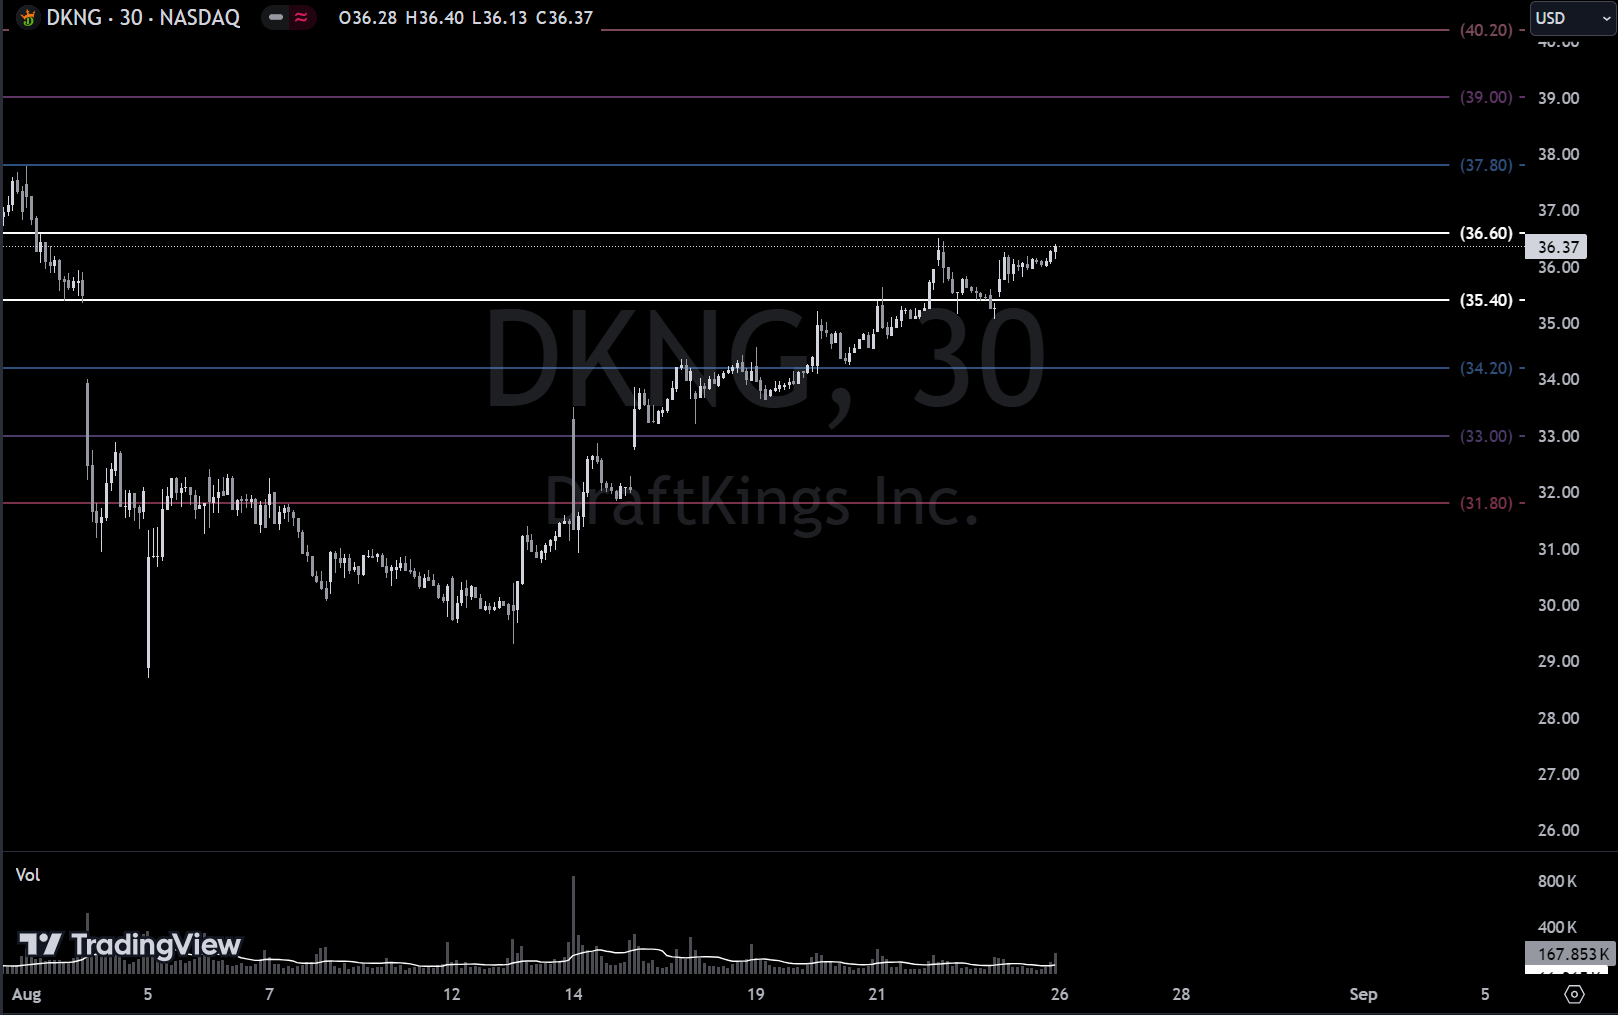
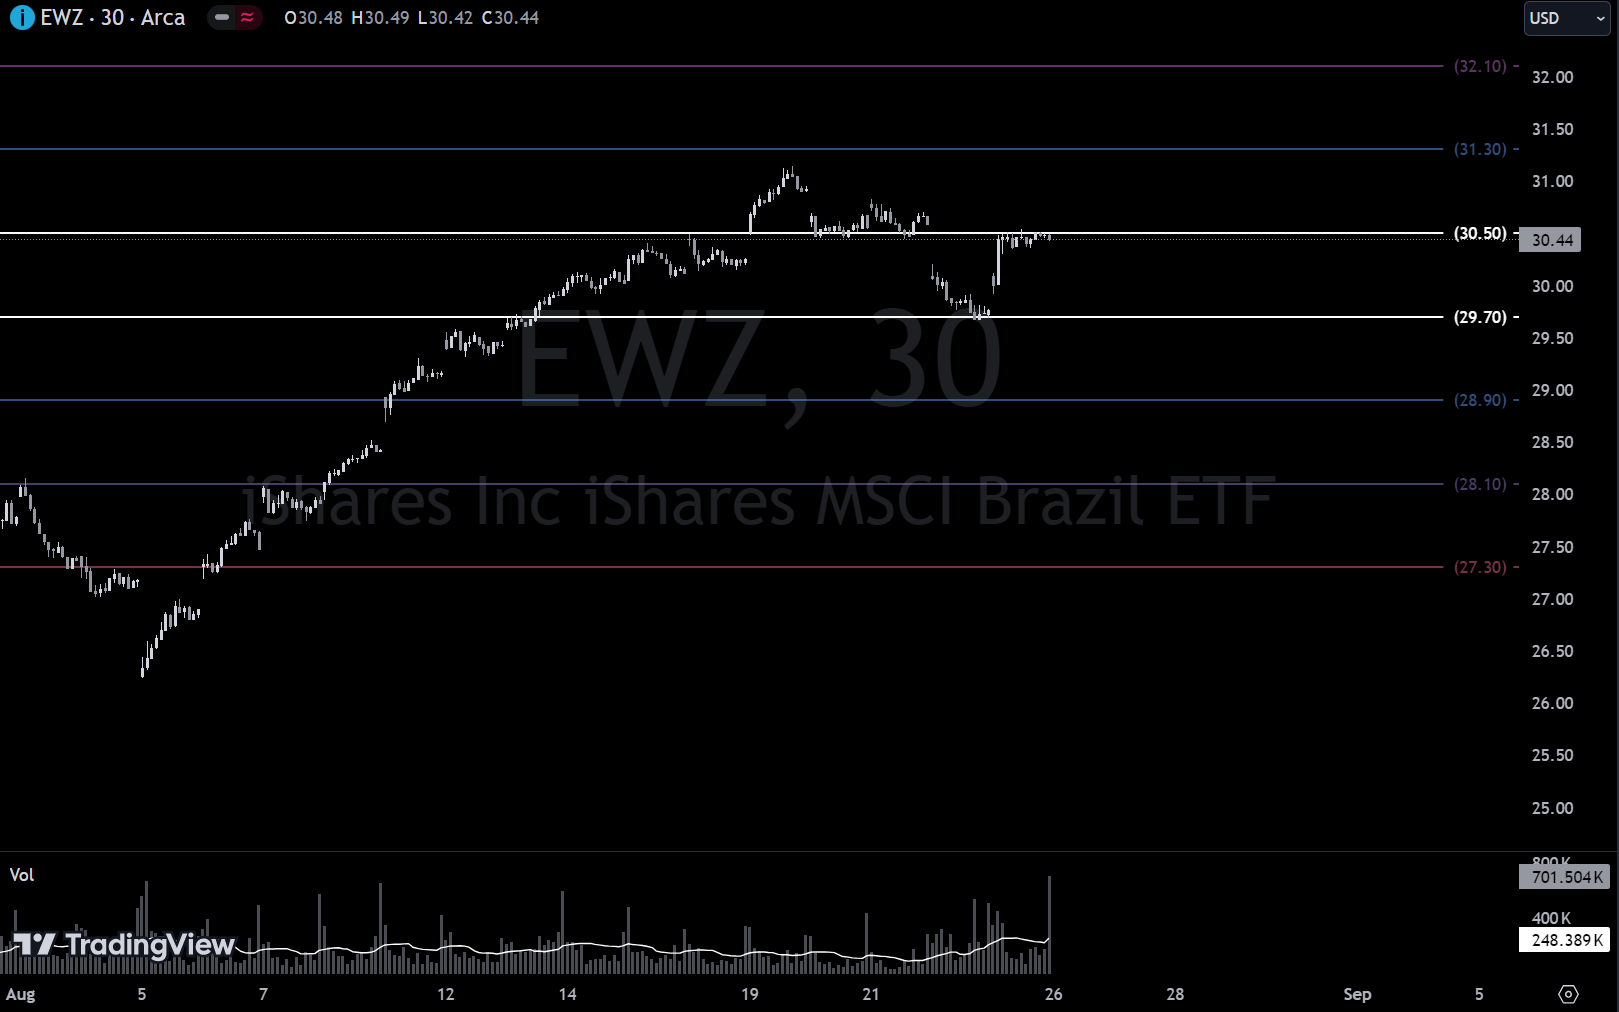
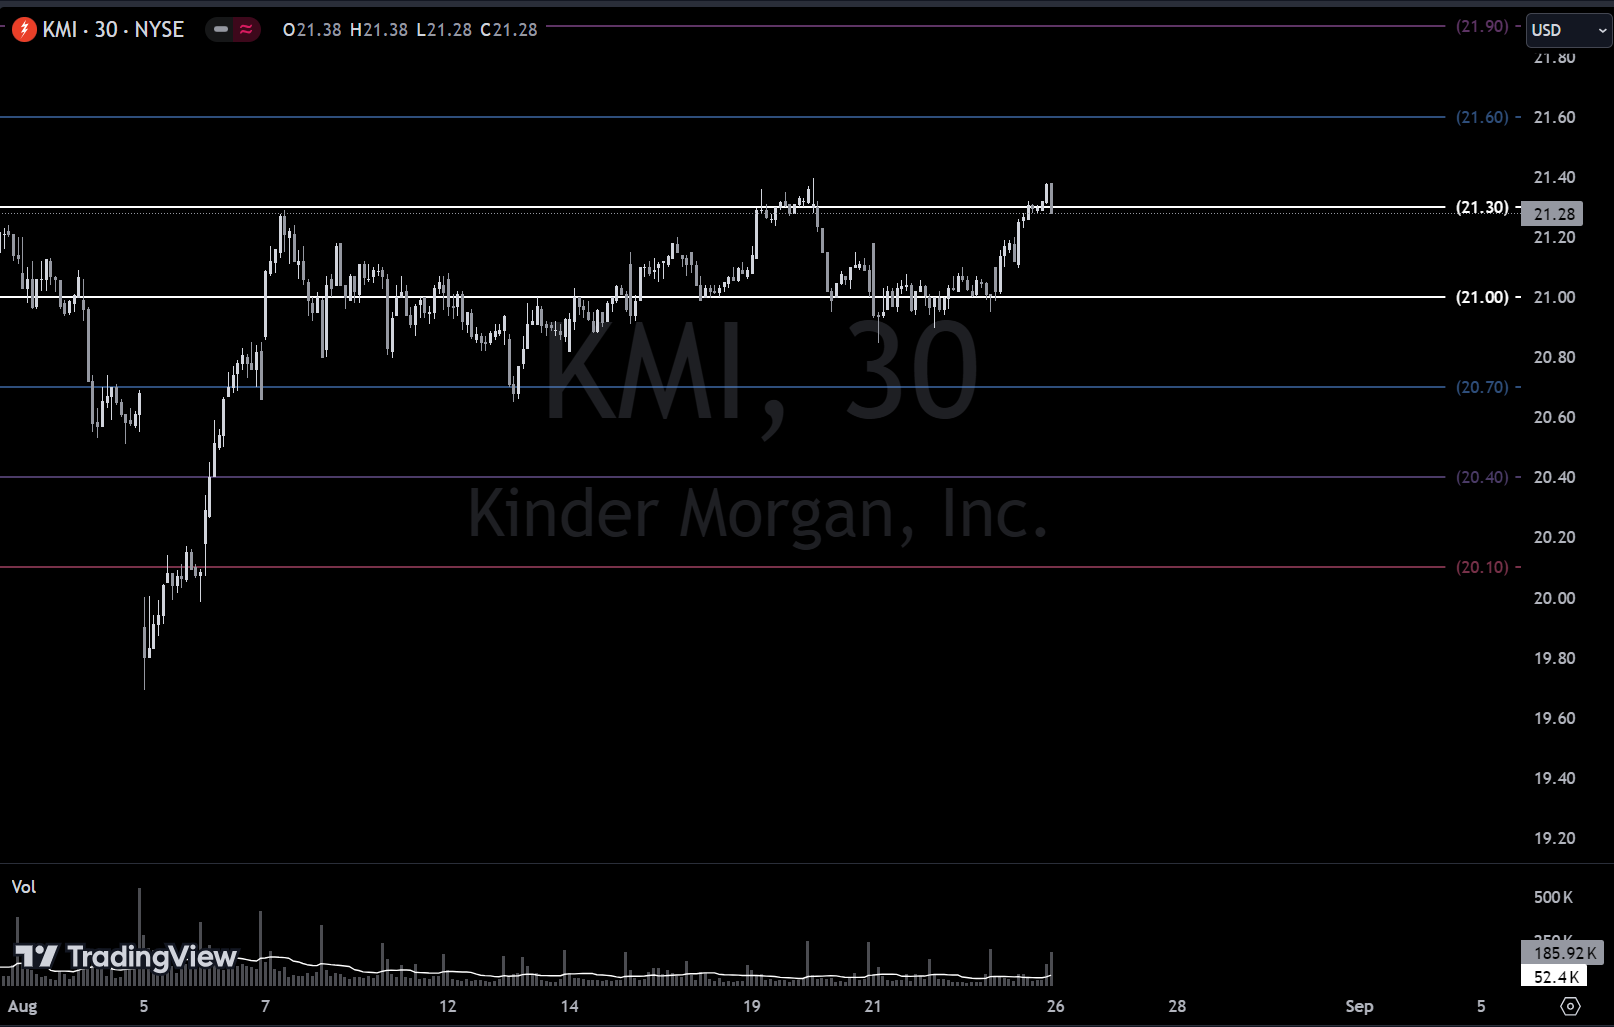
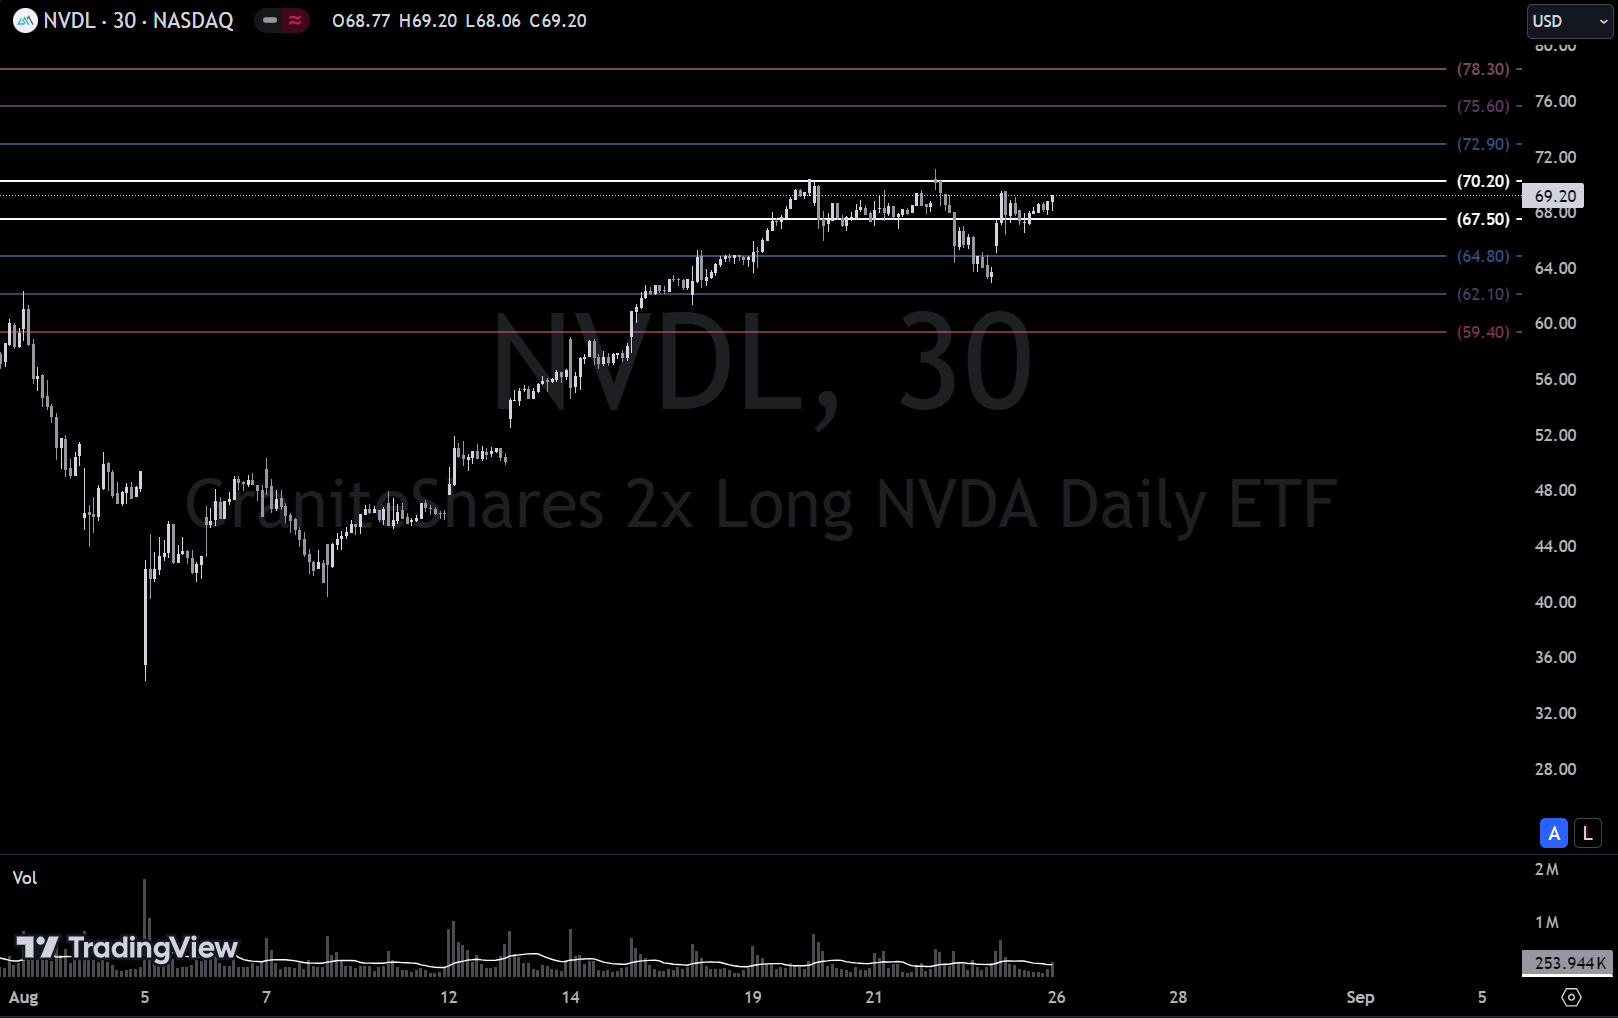
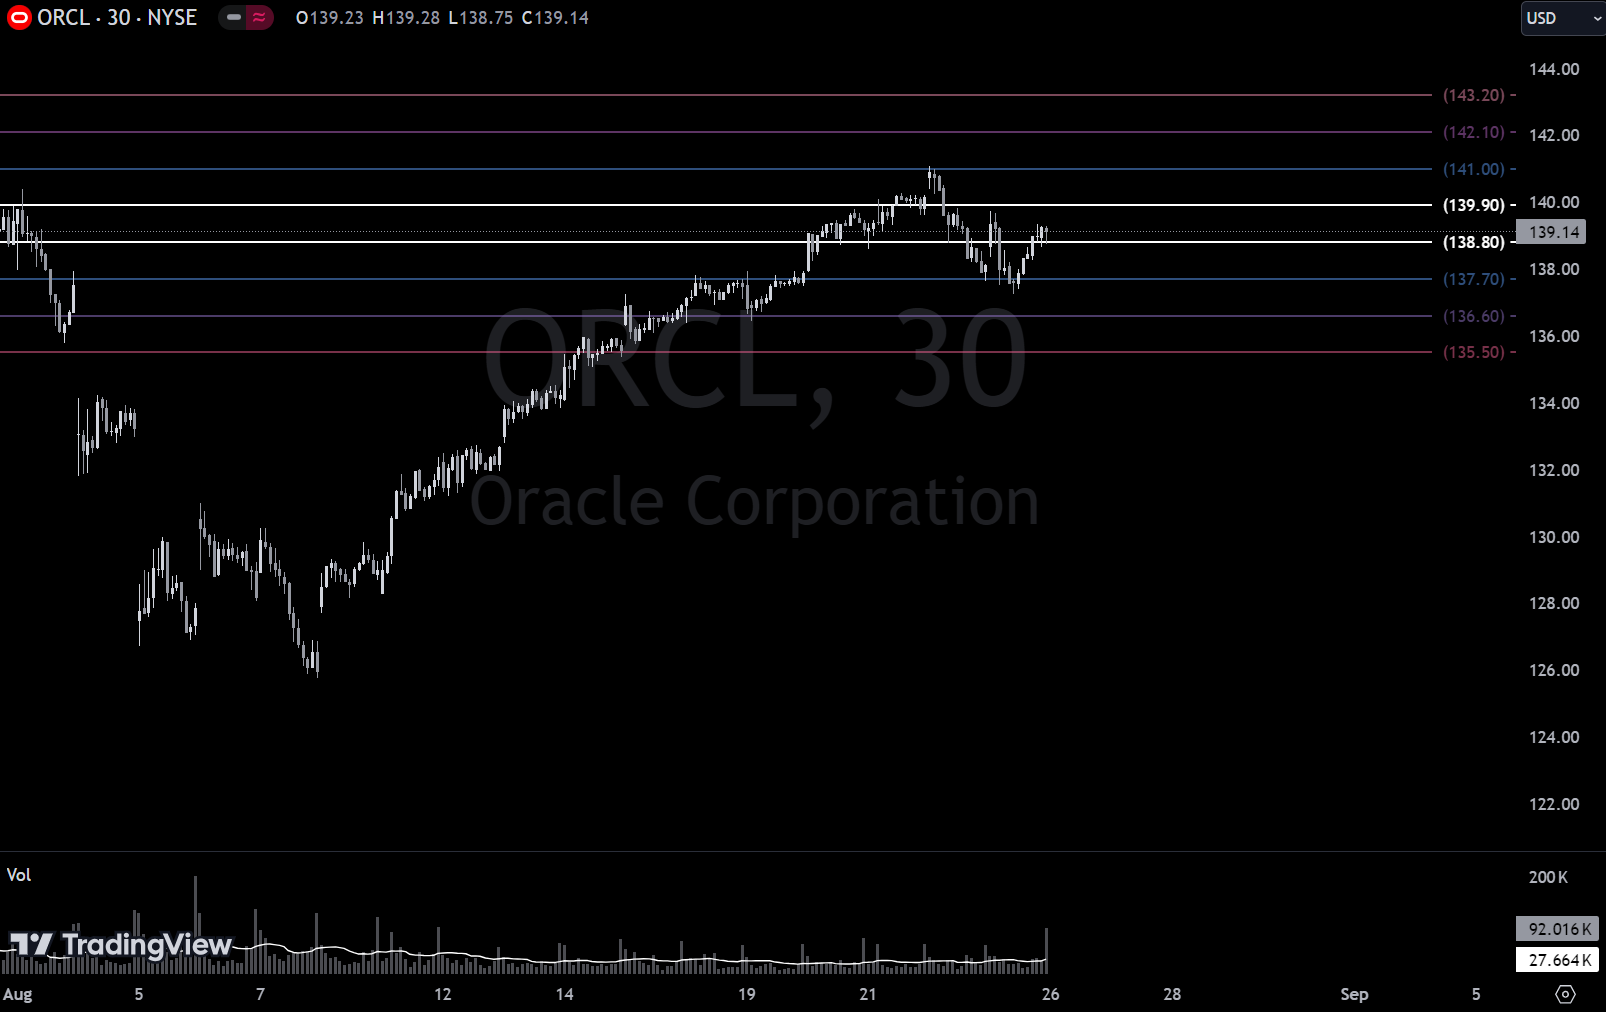
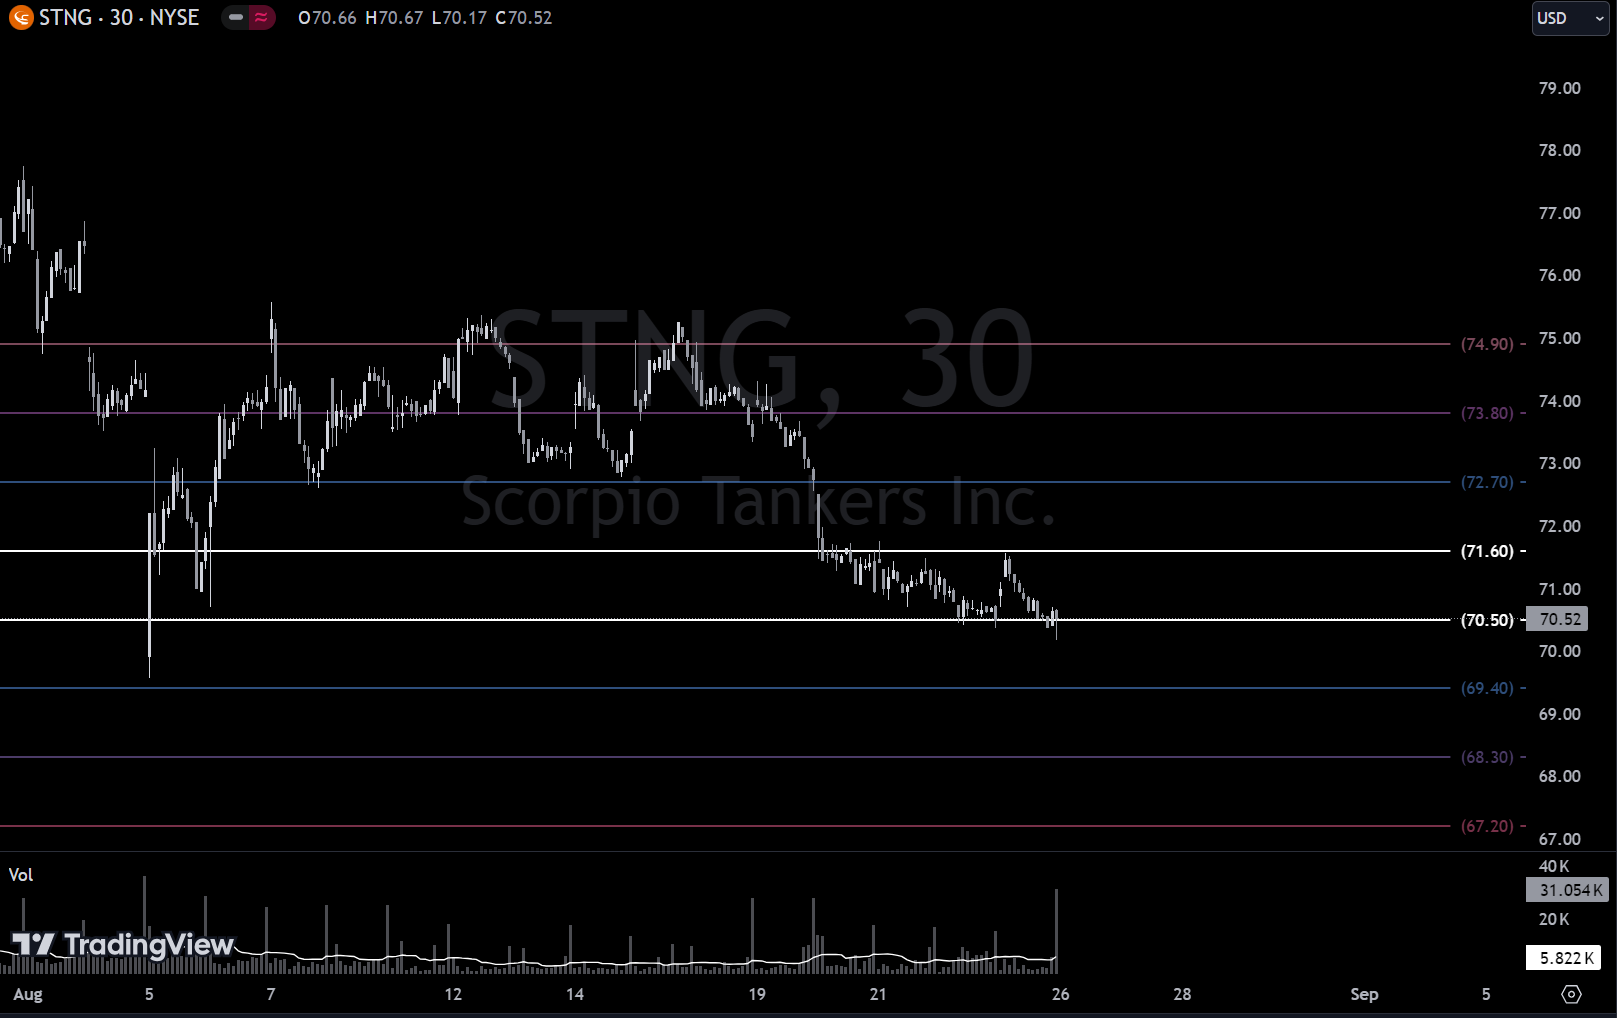
Institutional S/R Levels for Individual Tickers
Please read “Institutional S/R Levels For Major Indices” at the top of this stack to understand the nature and importance of what we’re looking at here visually. Institutions leave footprints that VL can illustrate for you while providing context to assess things like institutional conviction and urgency.
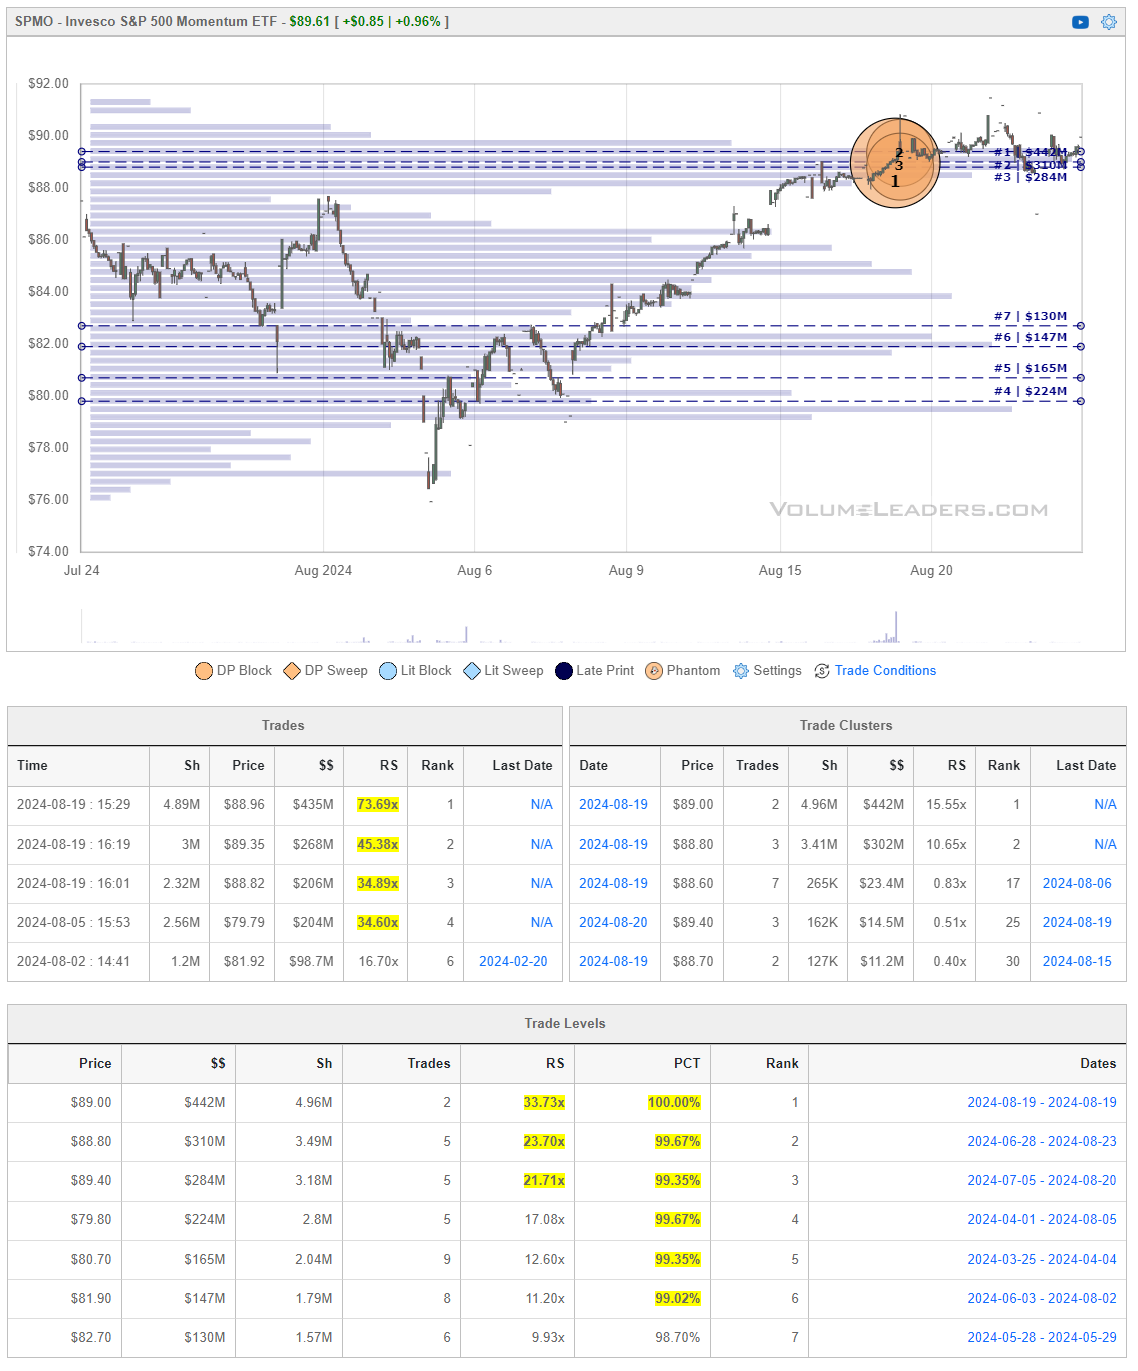
The Invesco S&P 500 Momentum ETF (SPMO) focuses on investing in companies within the S&P 500 that exhibit strong momentum characteristics. Recently, SPMO has shown positive performance, closing at $89.61, reflecting a 0.96% increase. Institutional investors have shown strong interest, particularly on August 19, 2024, where significant trades were made at key price levels including SPMO’s largest trade to-date; this establishes a clear LIS (line-in-the-sand) by which to measure buyer or seller success in coming sessions. This ETF benefits from capitalizing on stocks with strong price momentum, making it attractive during bullish market conditions.
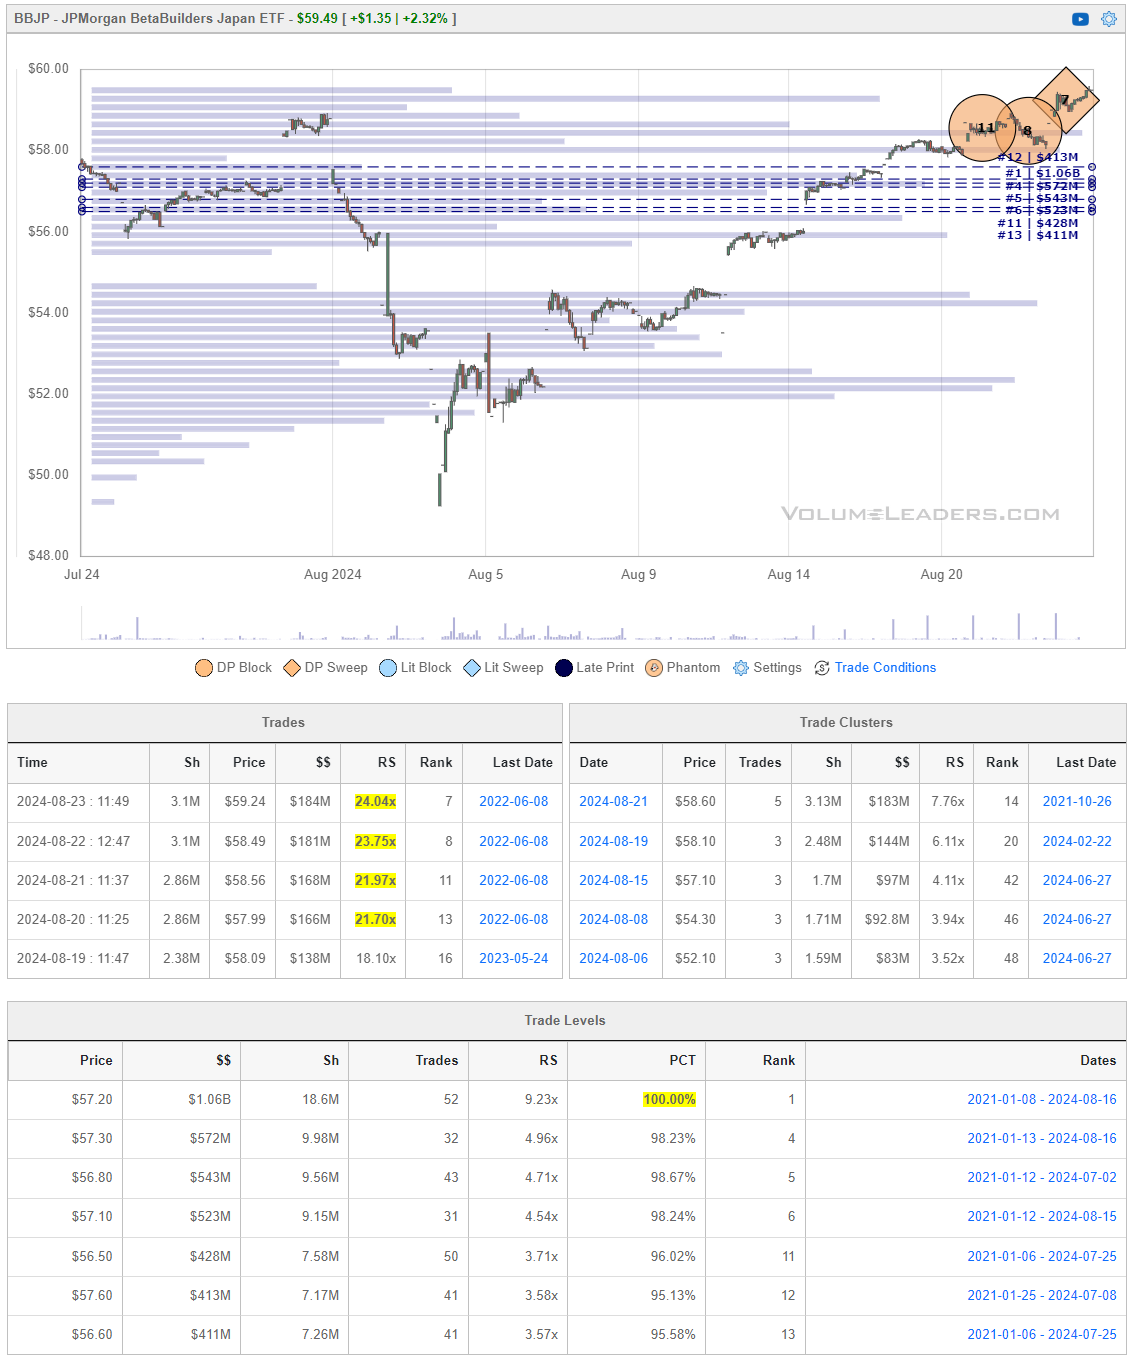
The Invesco MSCI Japan ETF (BBJP) tracks the performance of the MSCI Japan Index, which includes large and mid-cap companies across various sectors in Japan. The ETF aims to provide exposure to the Japanese equity market, benefiting from the growth and performance of the country's economy. BBJP is popular among investors seeking diversification within international markets, specifically in Asia. Its holdings include prominent Japanese companies, and it is a choice for those looking to capitalize on Japan's economic trends and corporate performance. The chart shows immediate acceleration out of the $56-$58 area where we see significant positioning.
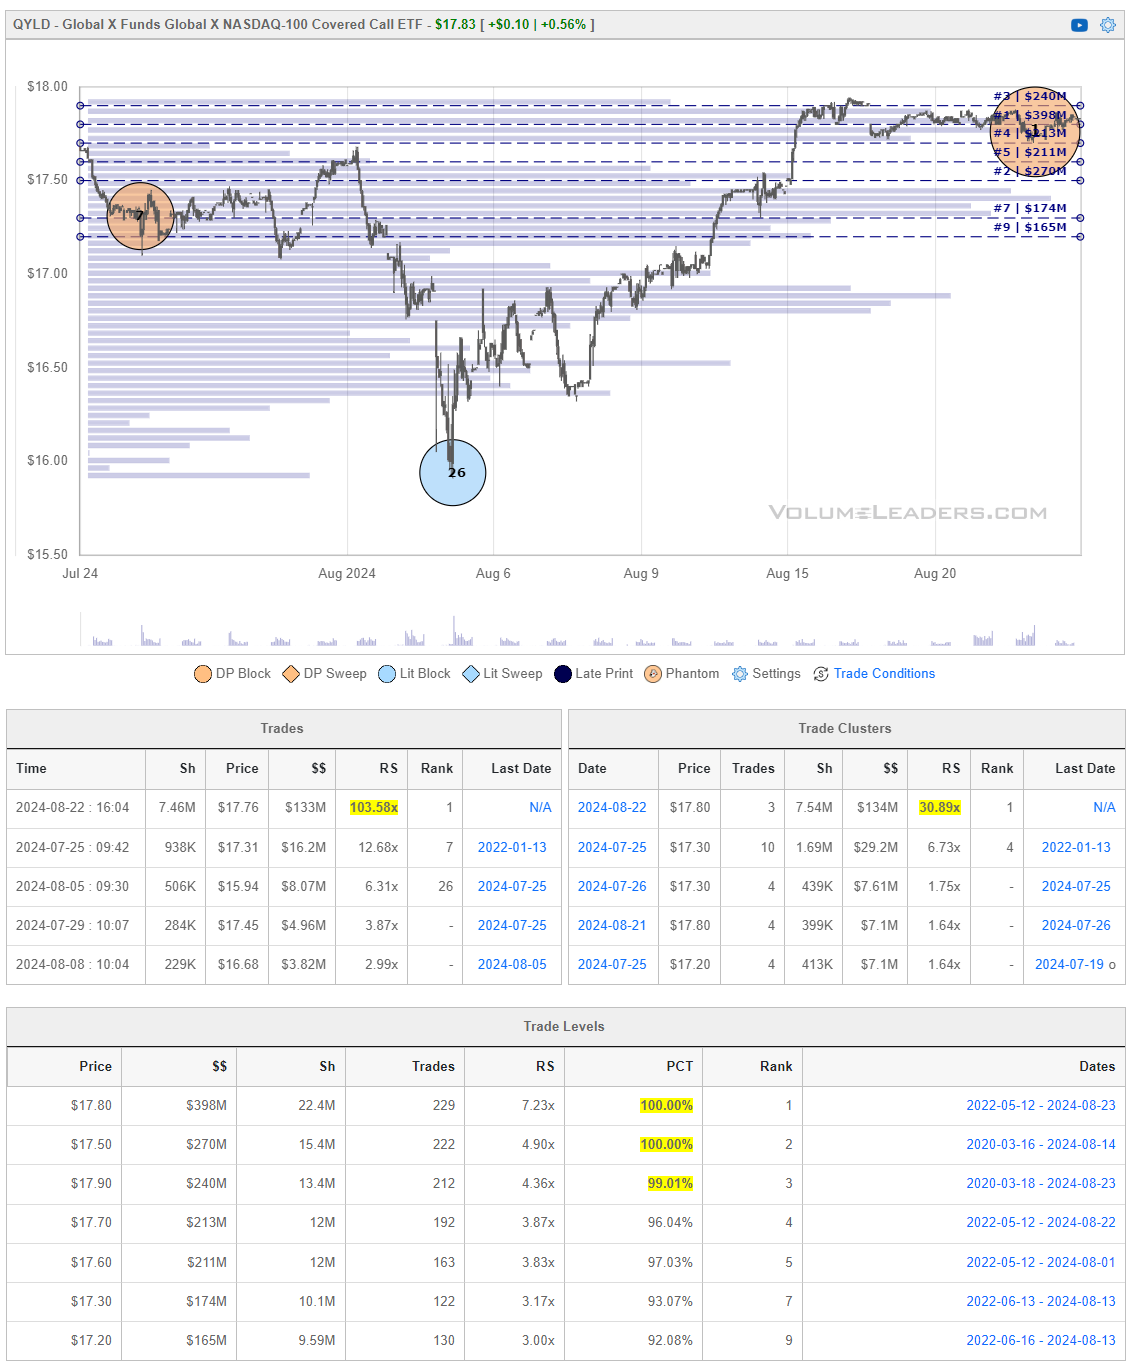
The Global X Nasdaq 100 Covered Call ETF (QYLD) is an exchange-traded fund that seeks to generate income by selling covered call options on the Nasdaq 100 Index. The fund provides exposure to the Nasdaq 100's underlying stocks while using the premiums received from the options to pay out dividends to investors. QYLD is popular among income-focused investors due to its strategy of generating consistent, high monthly distributions. However, the trade-off is that the fund might underperform during strong market rallies because of the cap on upside potential from the covered calls. QYLD’s largest trade just dropped on the 22nd so you’re going to want to keep an eye on this to confirm directional bias while navigating the market this week
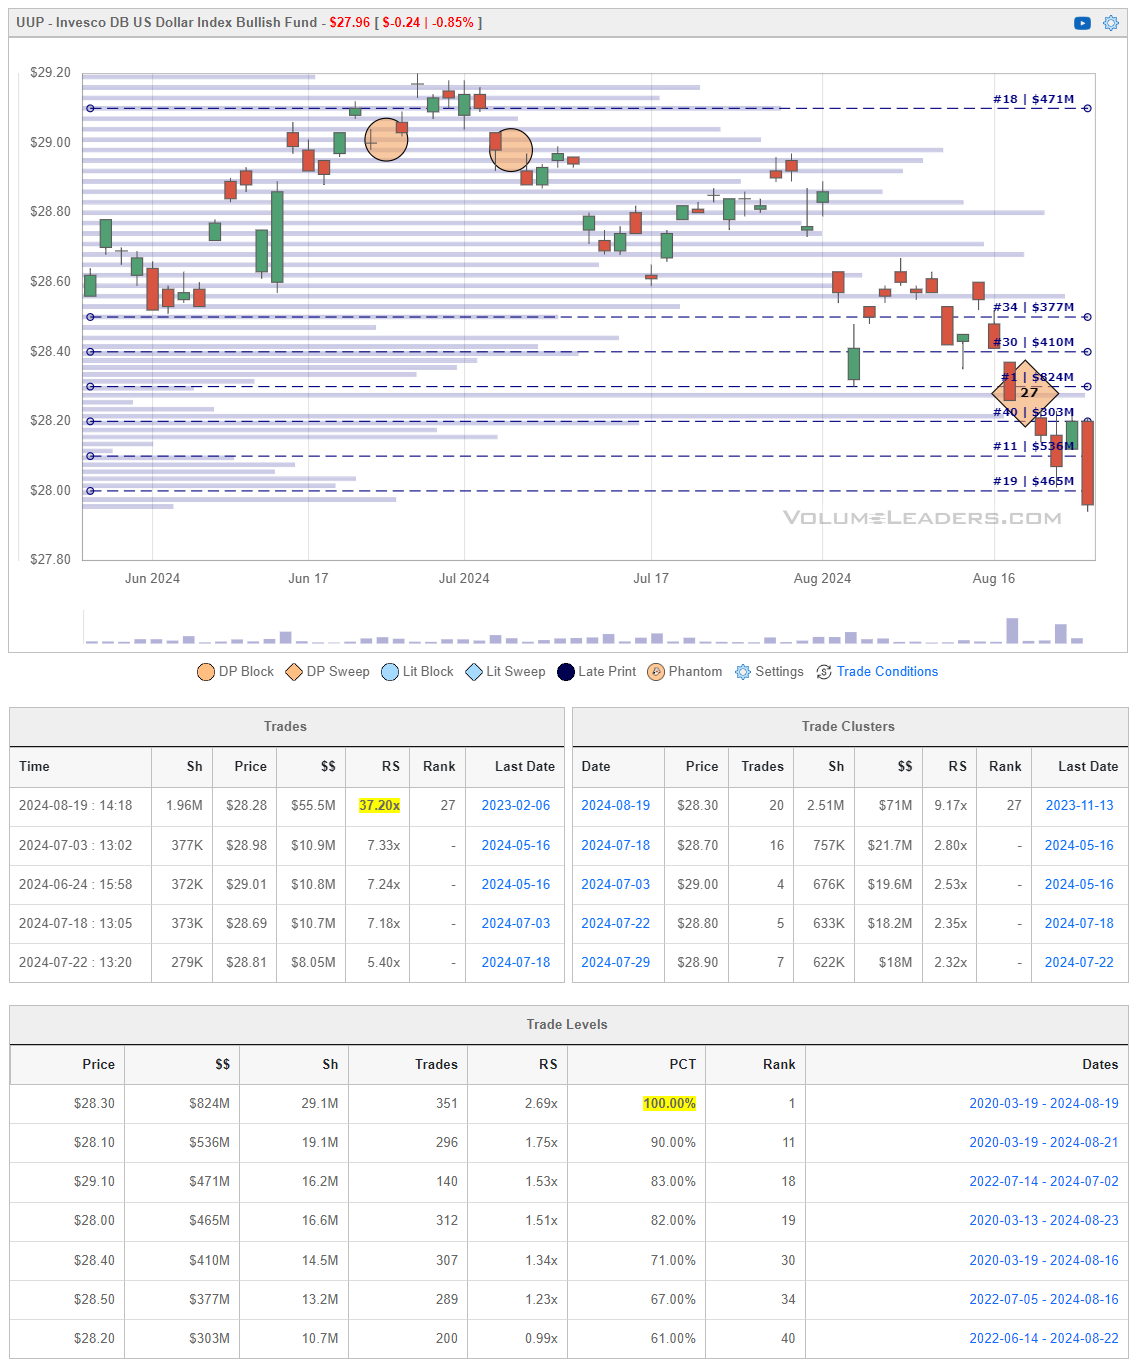
The Invesco DB US Dollar Index Bullish Fund (UUP) aims to track the performance of the U.S. dollar against a basket of six major world currencies: the euro, Japanese yen, British pound, Canadian dollar, Swedish krona, and Swiss franc. It provides investors with exposure to movements in the U.S. dollar relative to these currencies. UUP is often used as a hedge against foreign exchange risk or to speculate on the strength of the U.S. dollar. The fund typically performs well during periods of dollar strength and global economic uncertainty. The dollar has been coming-in since roughly the start of July and that #27 sweep now well-above price is not suggesting relief anytime soon. If you check out your higher timeframe charts, you’ll see this ticker has been holding $27’ish for some time…I think there is a good chance price i seeking to balance against those multi-year lows one more time.
VL Precision Swings
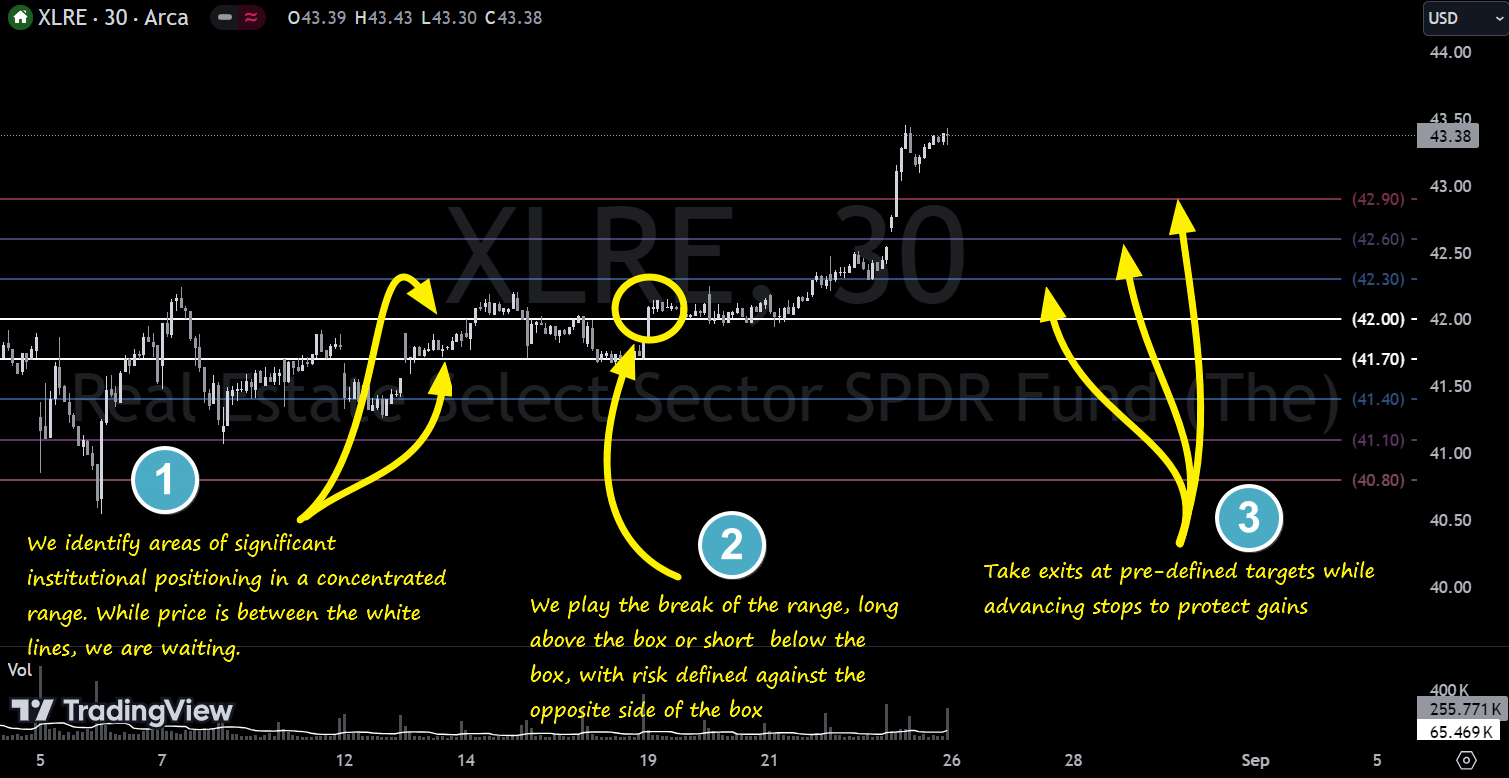
This week we’re featuring additional screened trade ideas from one of our backtested proprietary signals for tactical swings called IBB - Institutional Breakout Boxes. The IBB Setup identifies an area of significant institutional positioning within a tight, concentrated price range, forming what we call a breakout box. This setup captures the potential energy built up as large players accumulate or distribute positions, creating a high-probability opportunity for explosive moves once the price breaks out of this zone. The precision of this setup allows traders to capitalize on the momentum generated by institutional forces, with clearly defined risk and reward parameters.
Note, these are shared for educational and entertainment purposes only and do not constitute financial advice.Here’s an example from last week - XLRE -0.89%↓ - that we shared and played real-time as it went on to smash all targets:
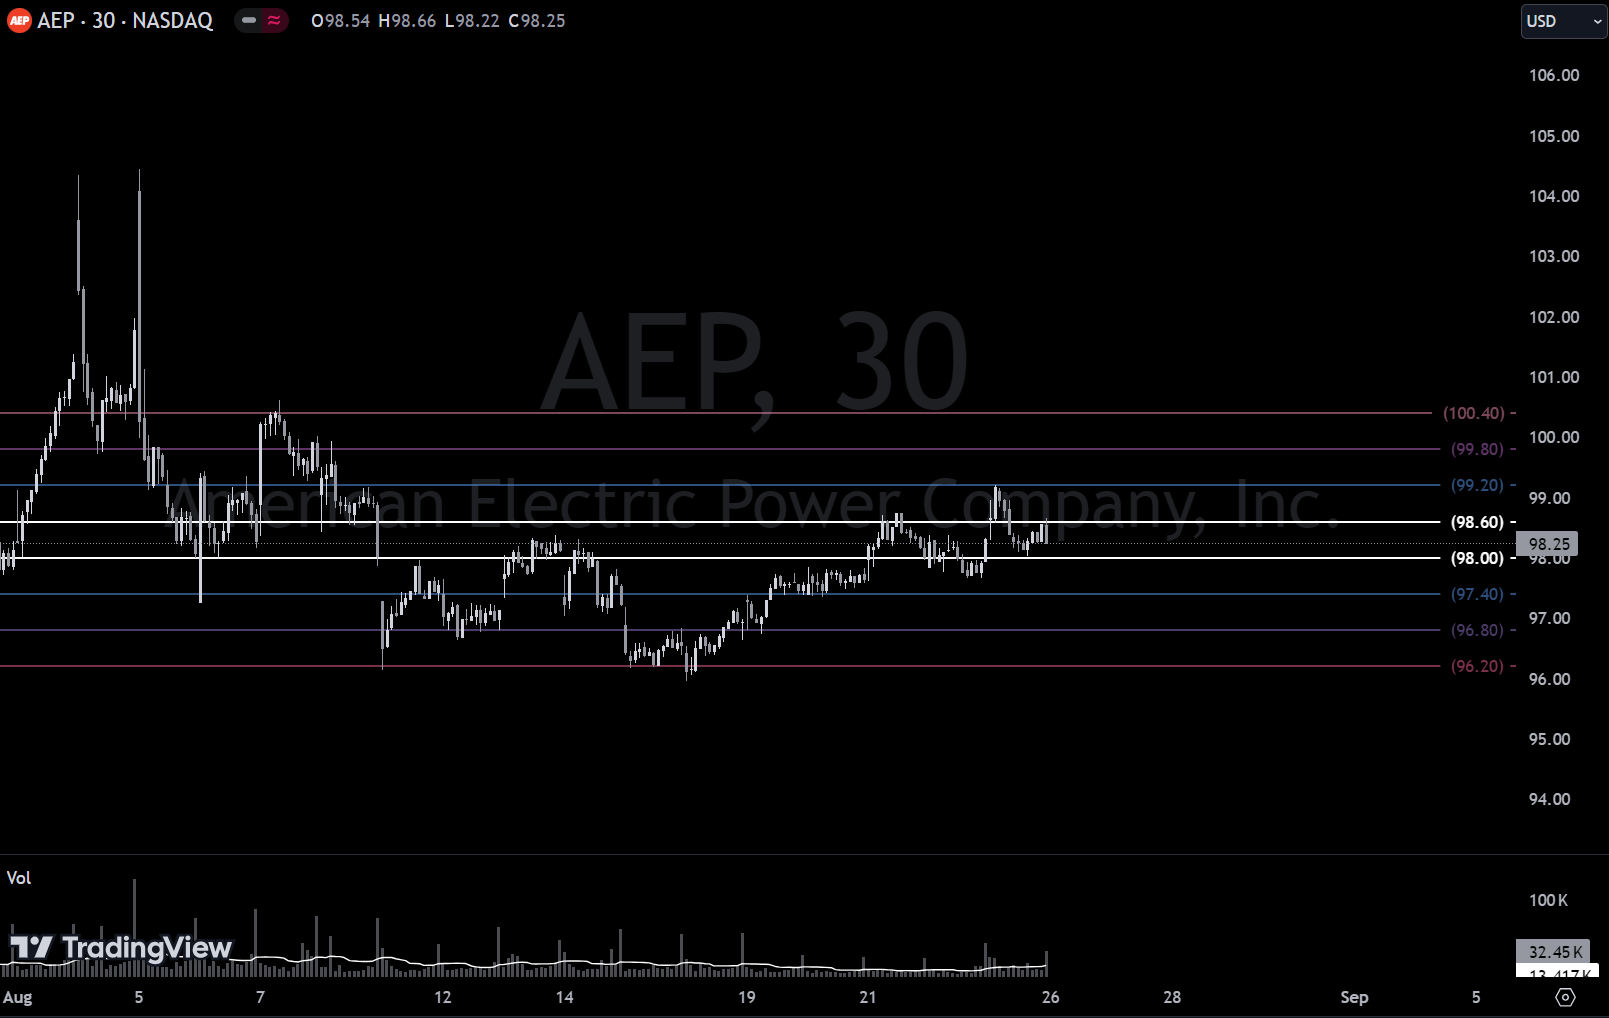
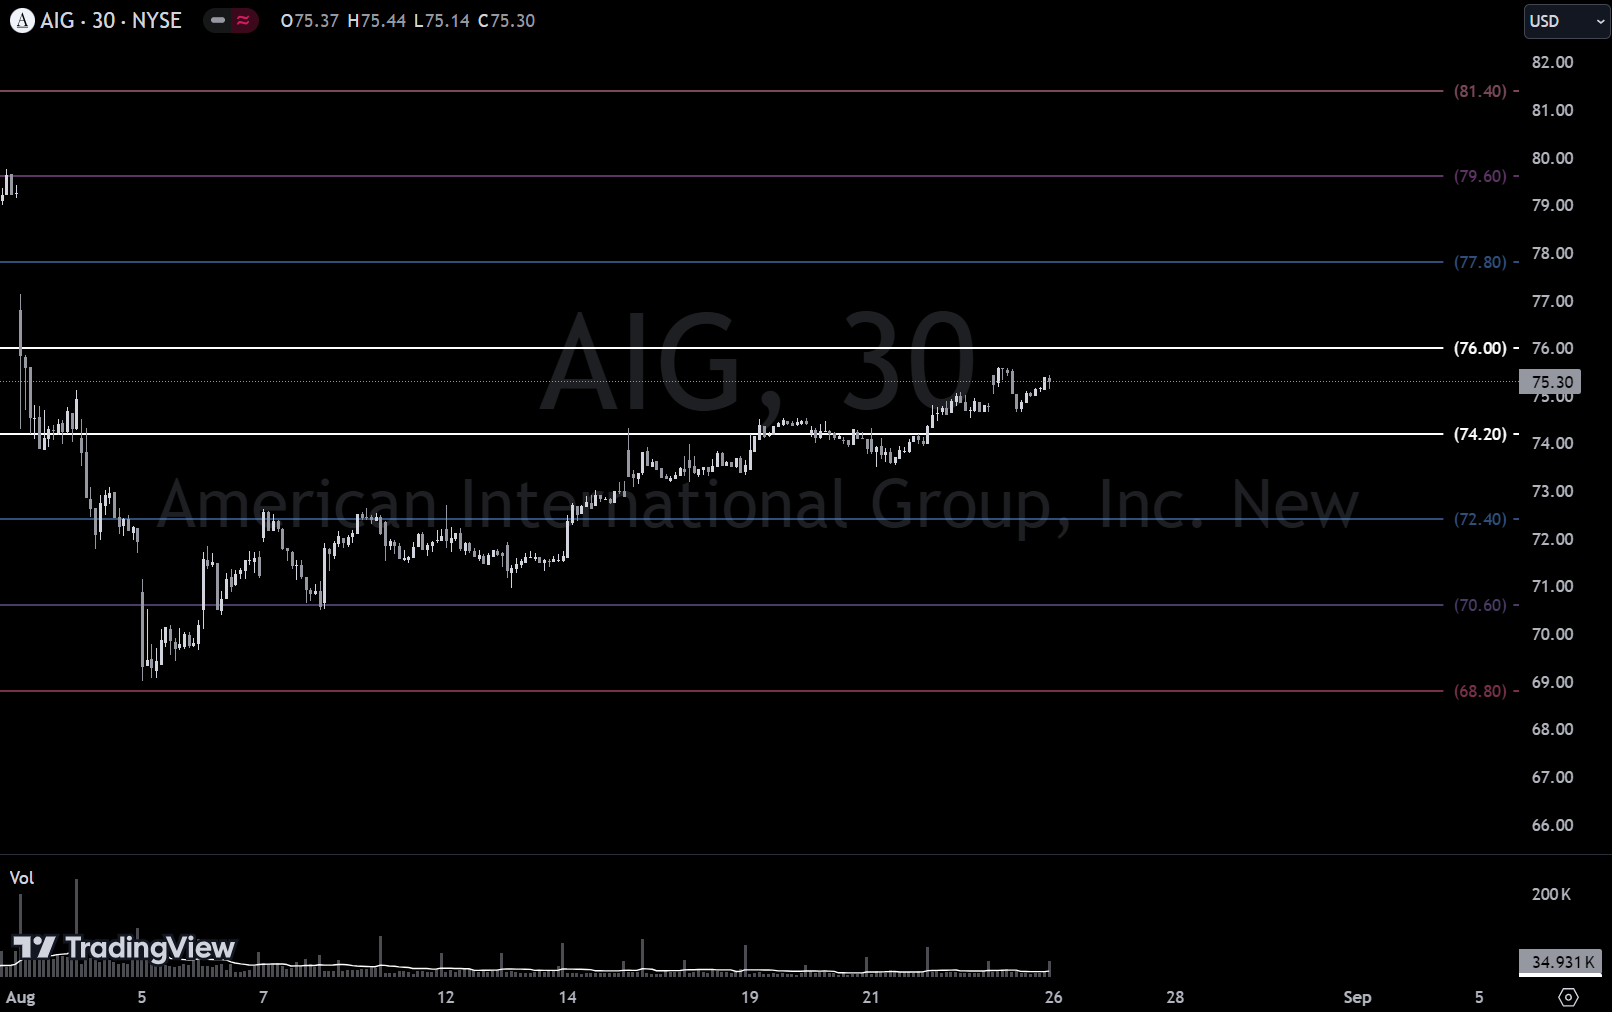
Here are some of the Precision Swings we’re watching this week:

Institutionally-Backed Gainers & Losers
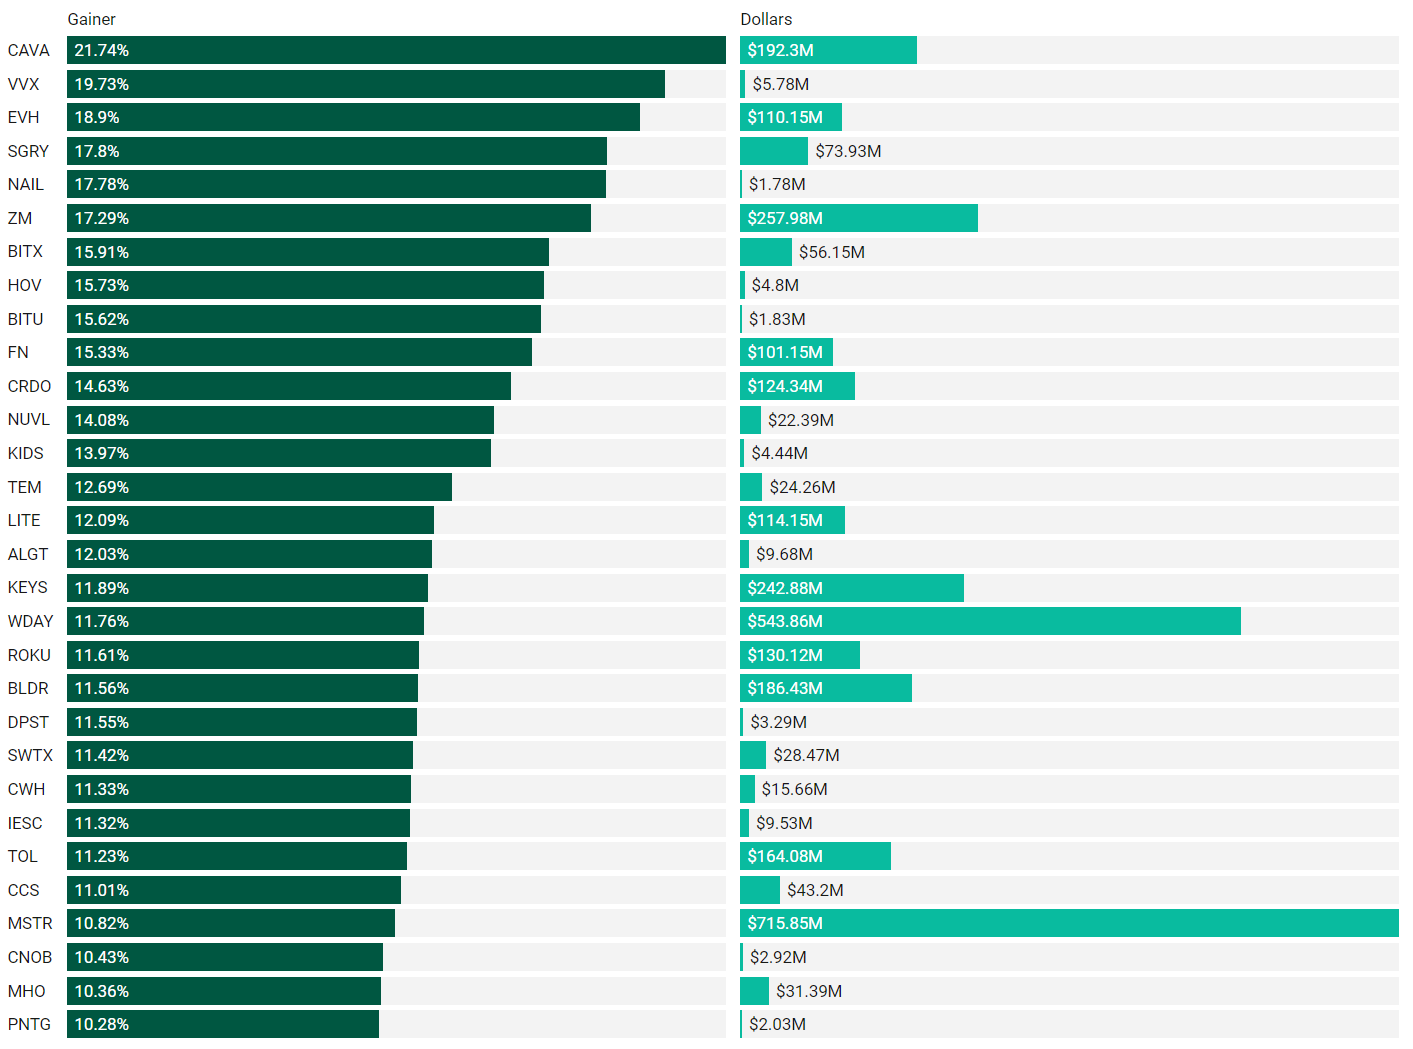
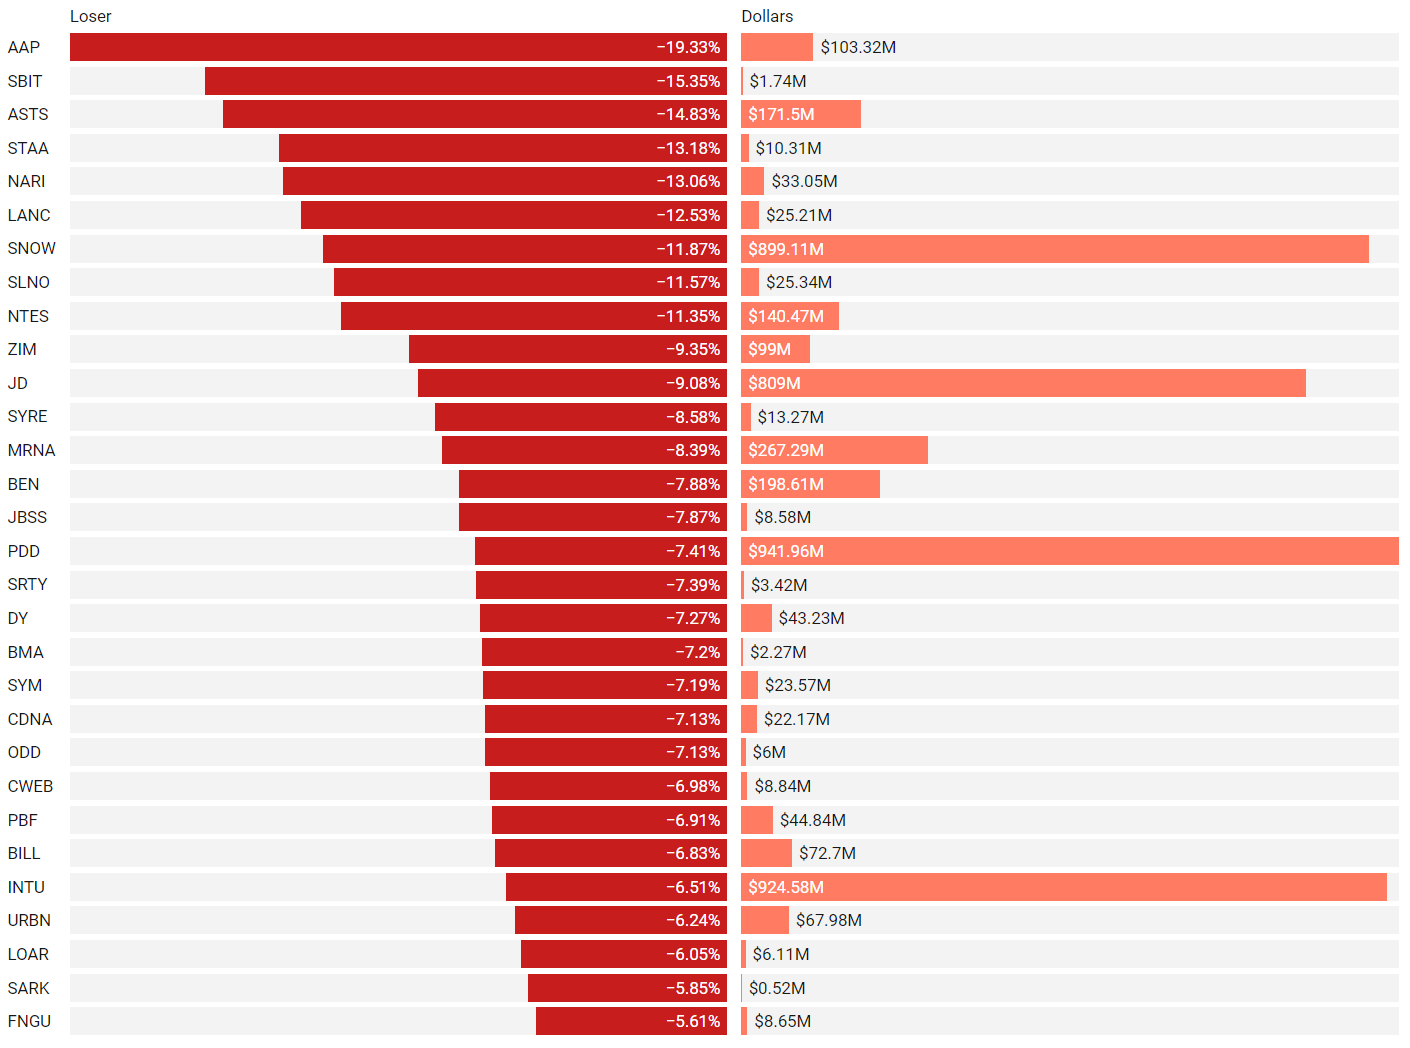
If you’re going to bet on a horse, consider one that is officially endorsed by an institution! These are the top percent gainers (green) and percent losers (red) from this week’s open-to-close that had a trade price greater than $20 and institutional involvement. Continue watching tickers from prior stacks as these frequently turn into multi-leg trades with a lot of movement!
Top Institutionally Backed Gainers
Top Institutionally Backed Losers
Billionaire Boys Club
Tickers that printed a trade worth at least $1B last week get a special shout-out… Welcome to the club. Subs should login to VL to get the exact trade price and relevant institutional levels around the trade - these are massive commitments by institutions that should not be ignored.
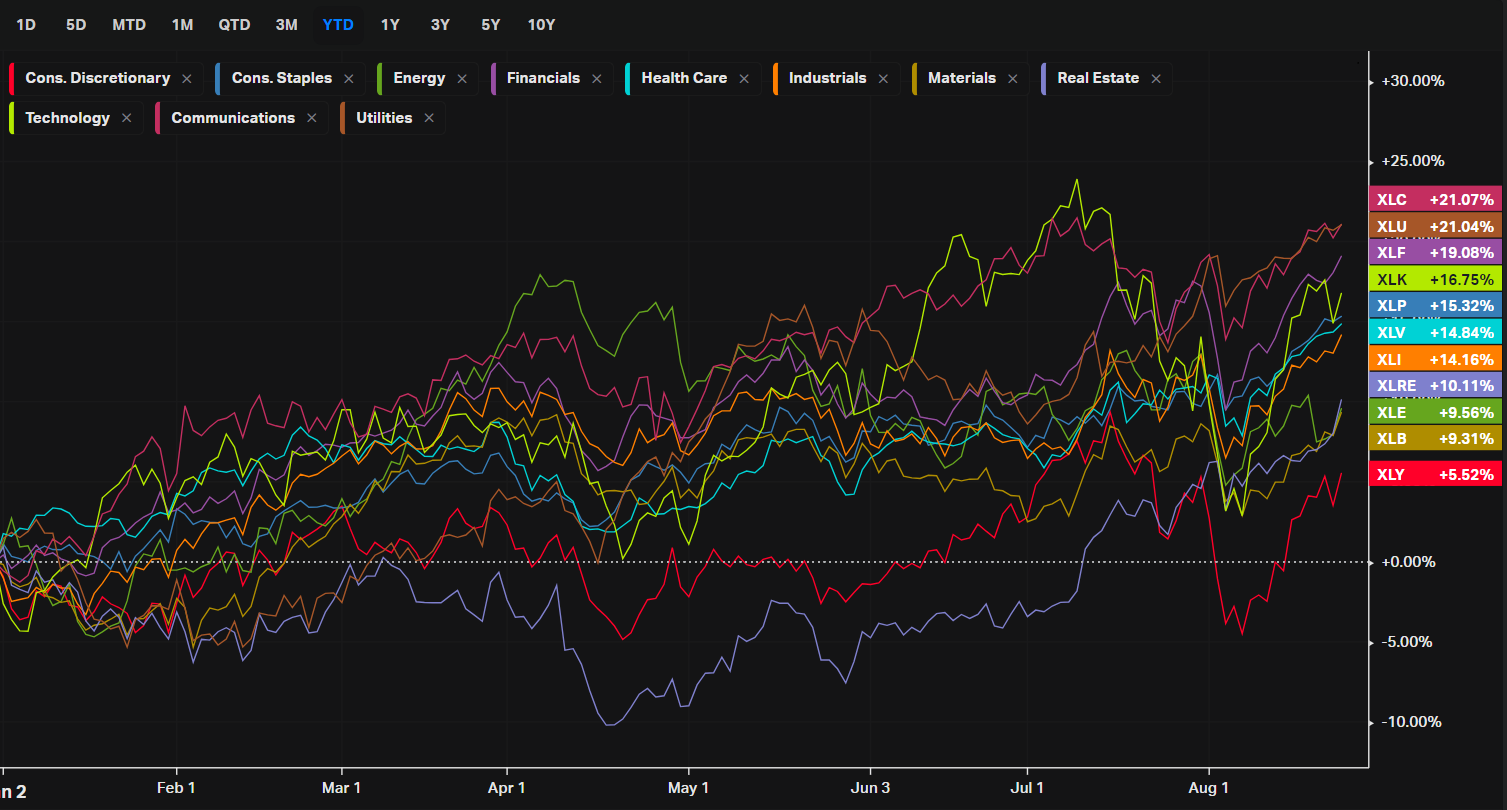
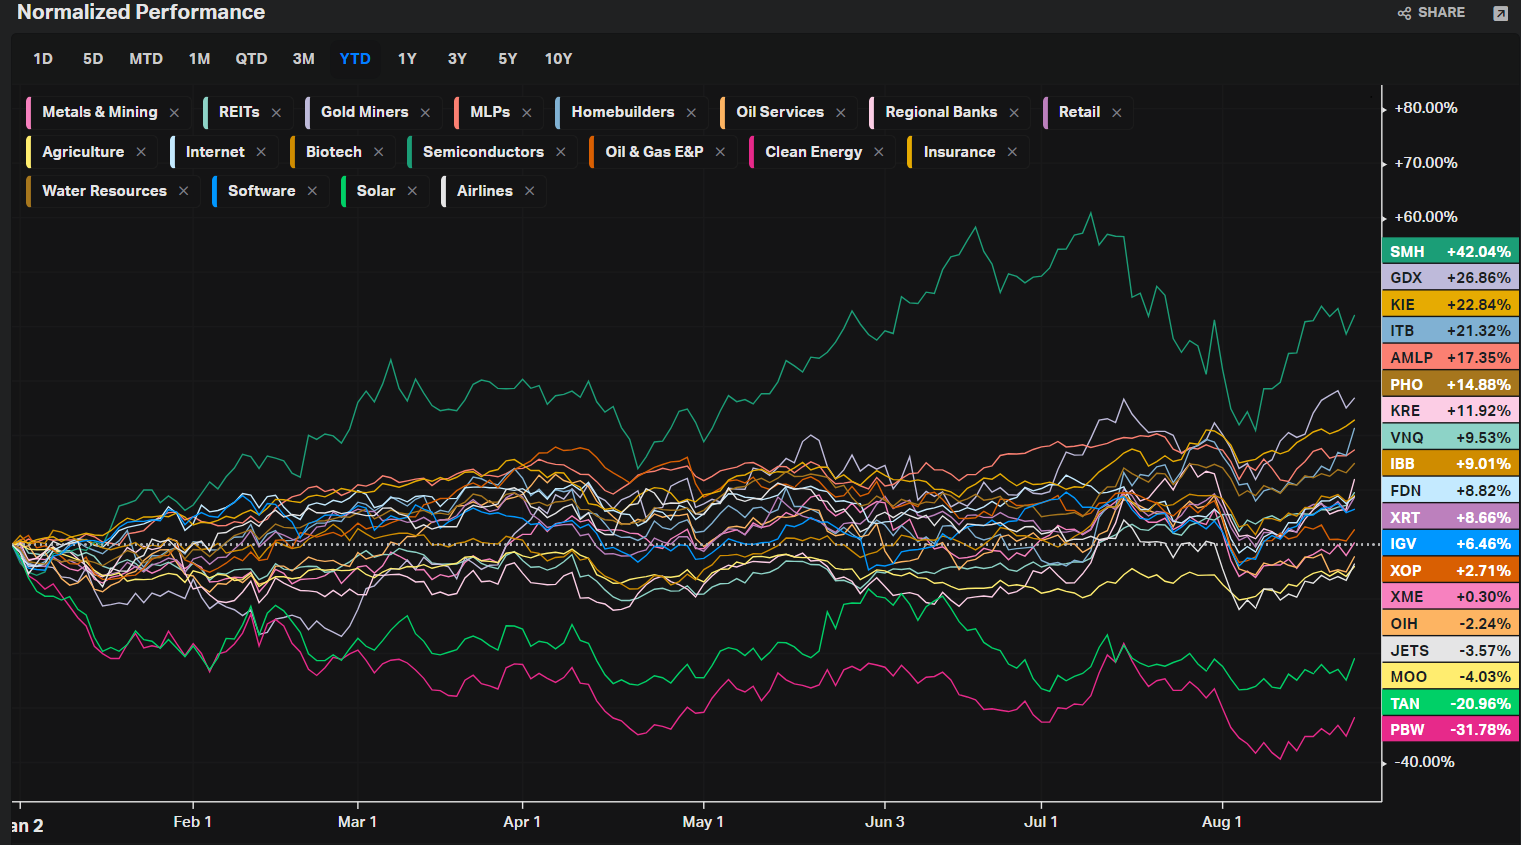
Summary Of Thematic Performance YTD
VL provides a lot of pre-built filters for thematics so that you can quickly dive into specific areas of the market. These performance overviews are provided here only for inspiration. Consider targeting leaders and/or laggards in the best and worst sectors, for example.
We’re now half-way through the year so we’re offering our semi-annual recap of what we’re seeing YTD in each theme. The next detailed wrap-up of thematics will come at the end of the year. If we missed something important, sound-off in the comments!
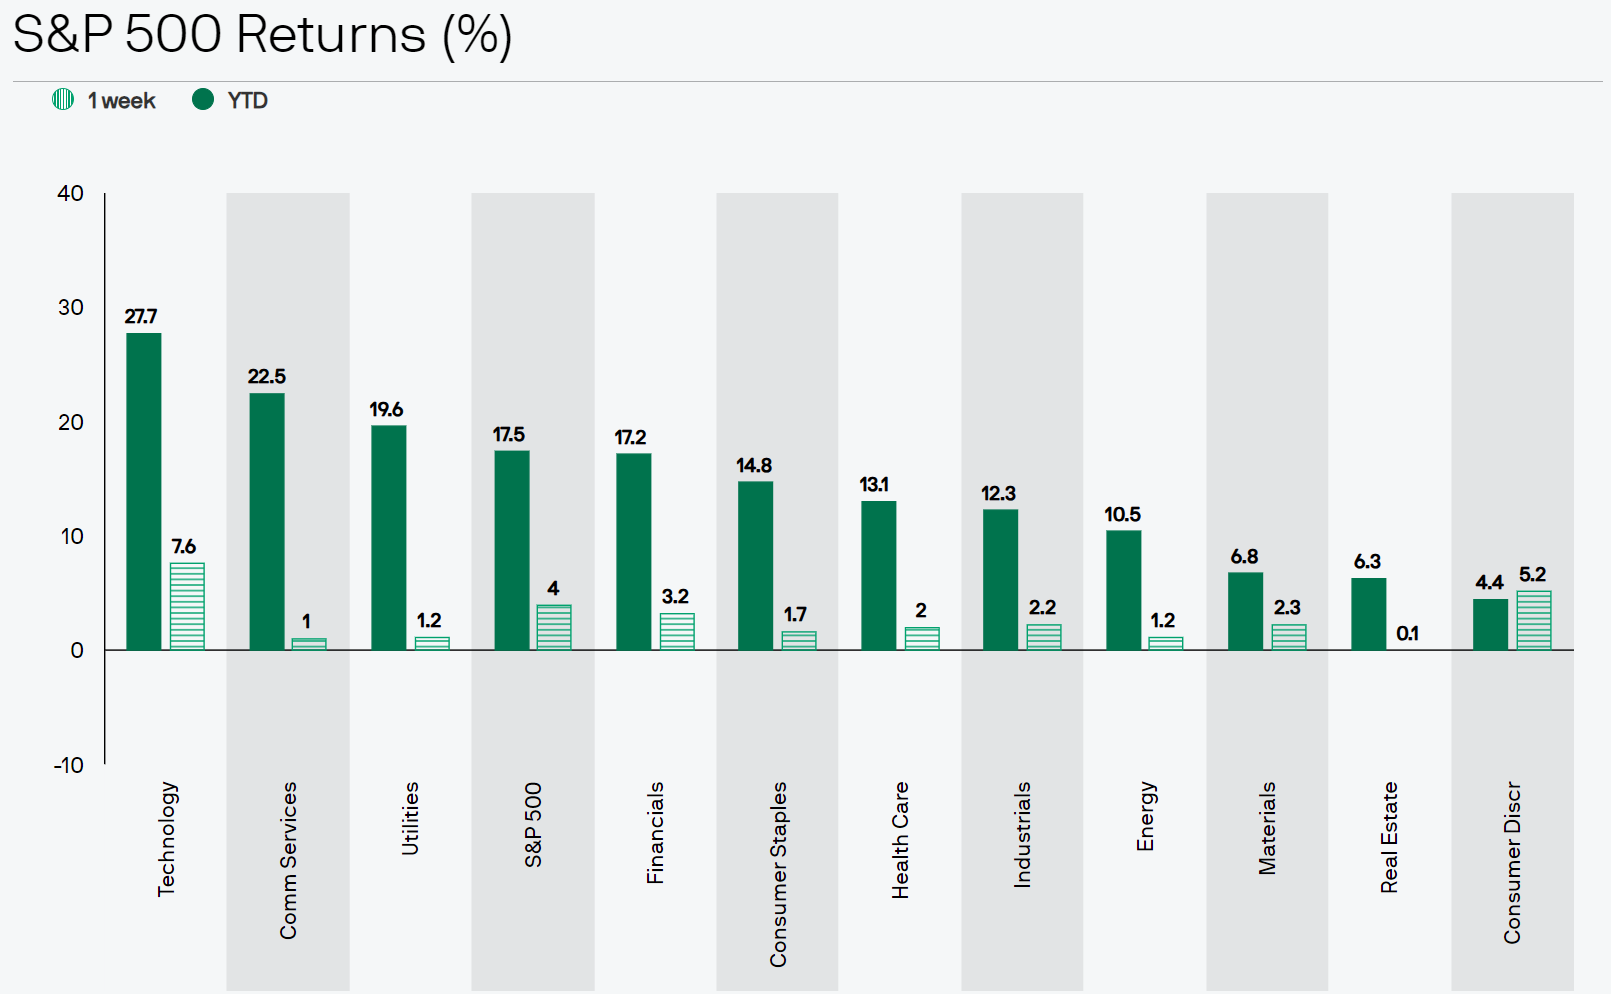
S&P By Sector
S&P By Industry
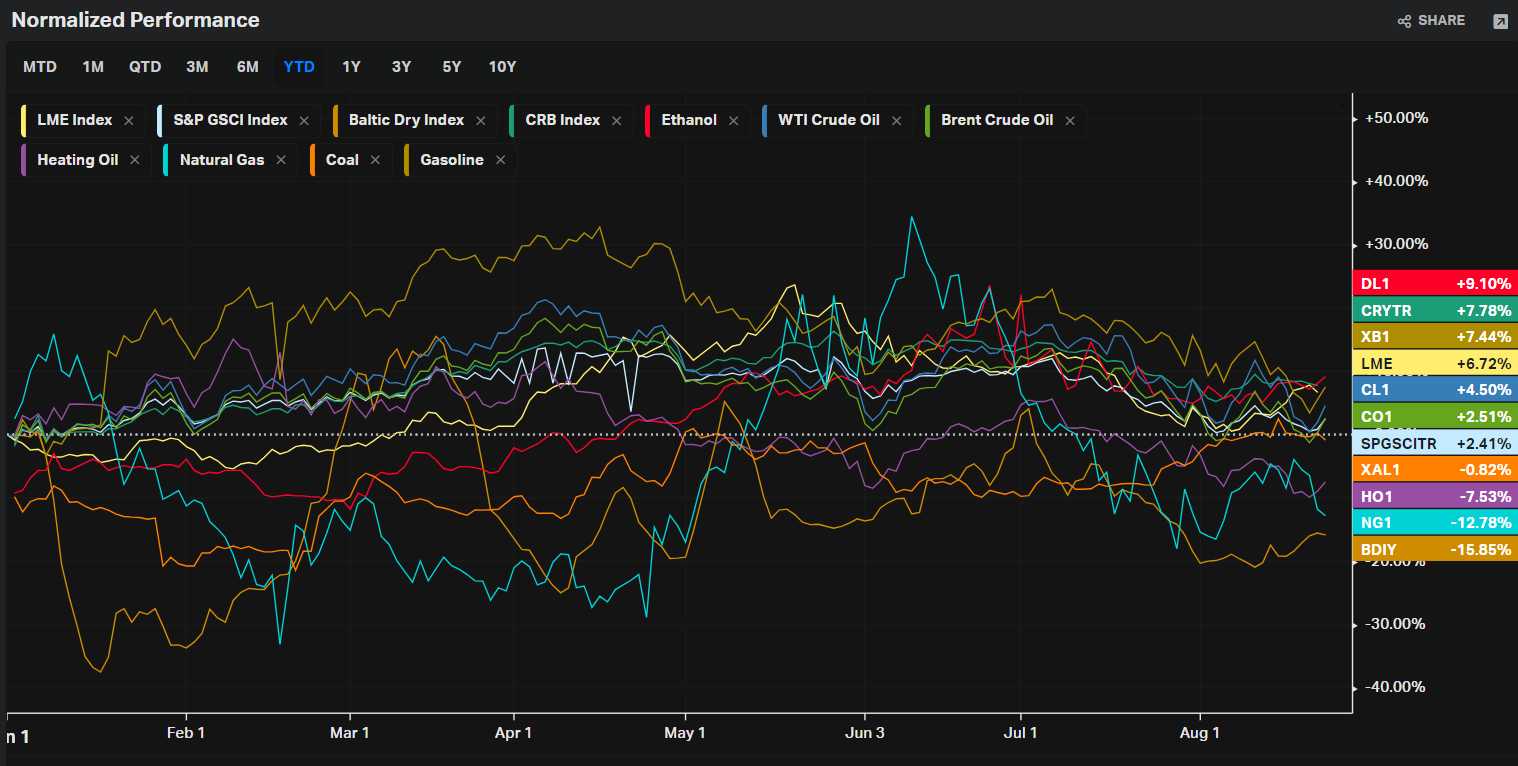
Energy
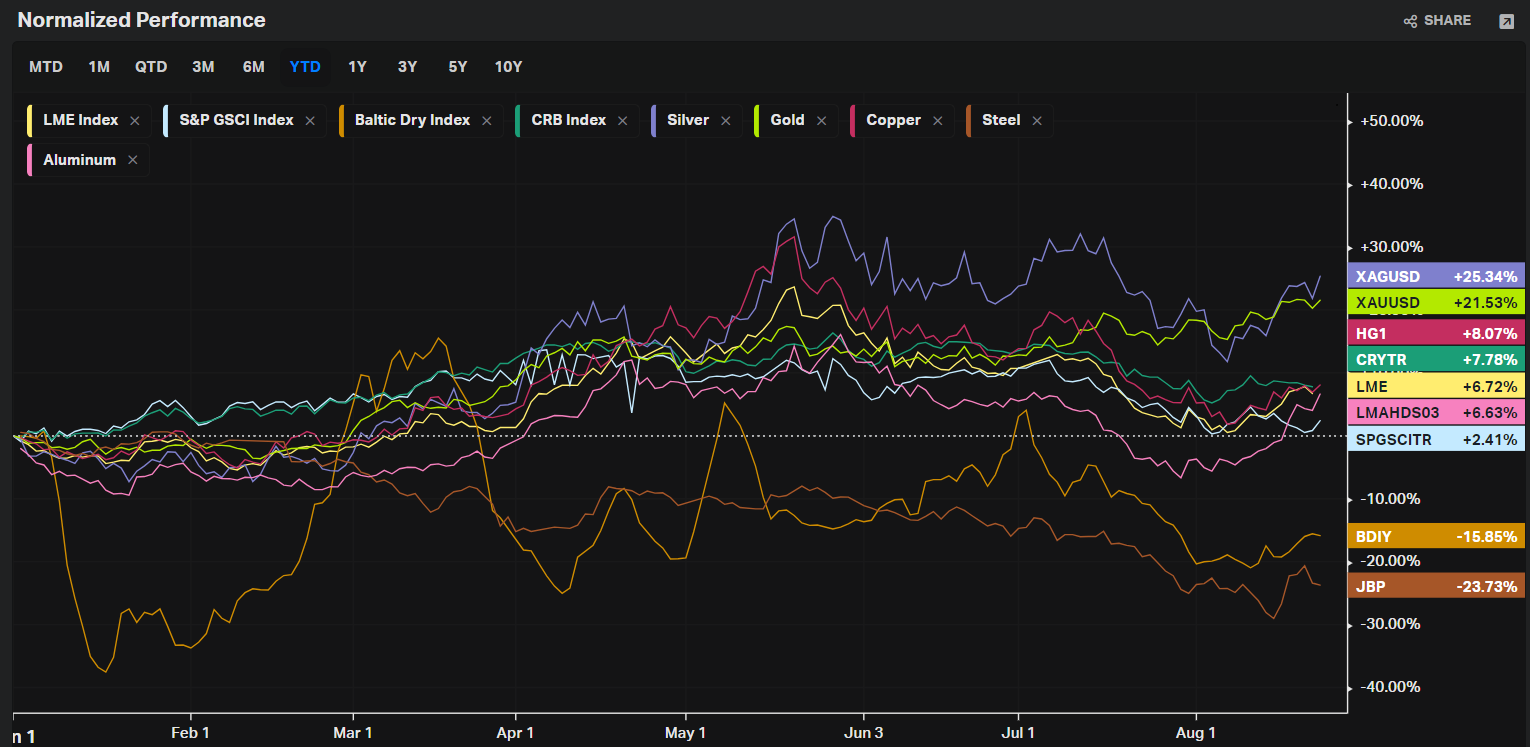
Metals
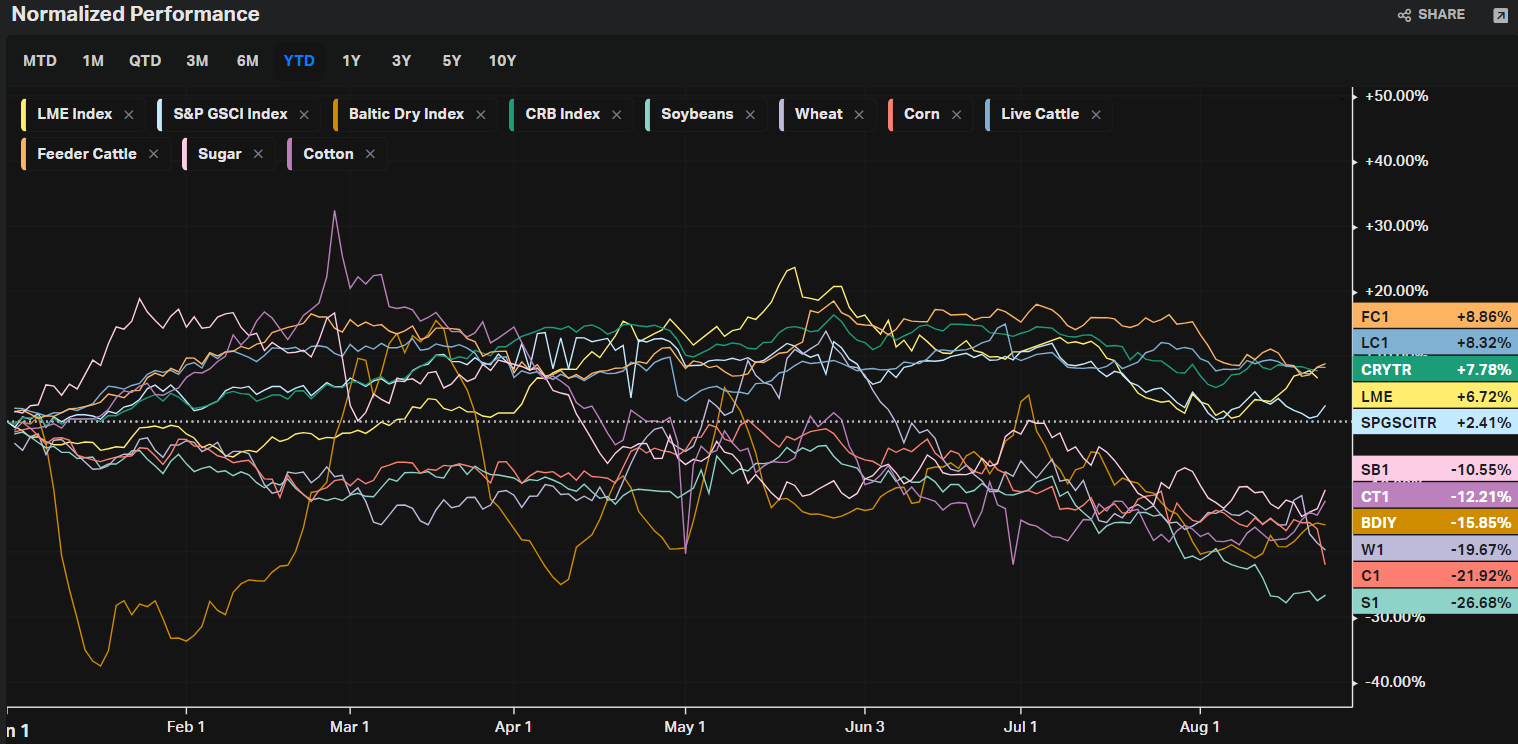
Agriculture
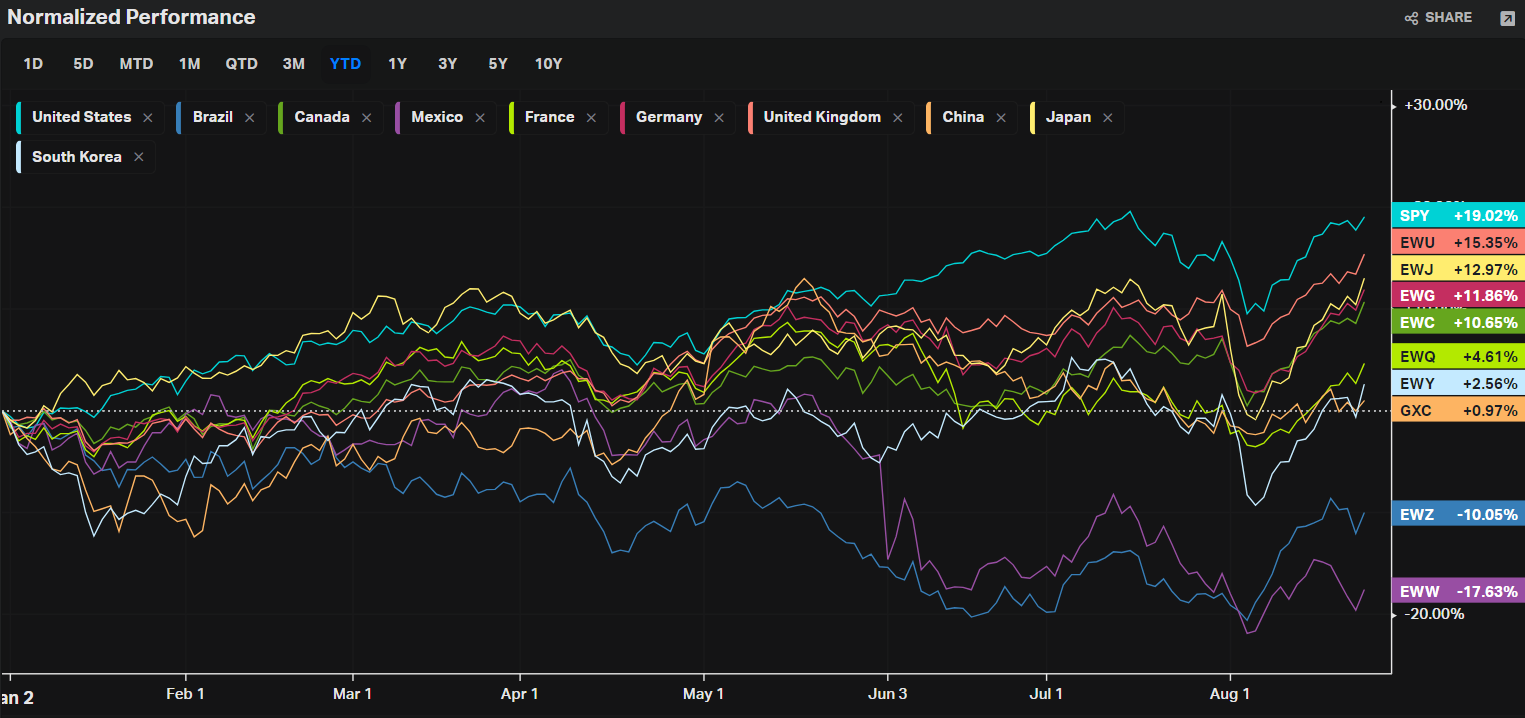
Country ETFs
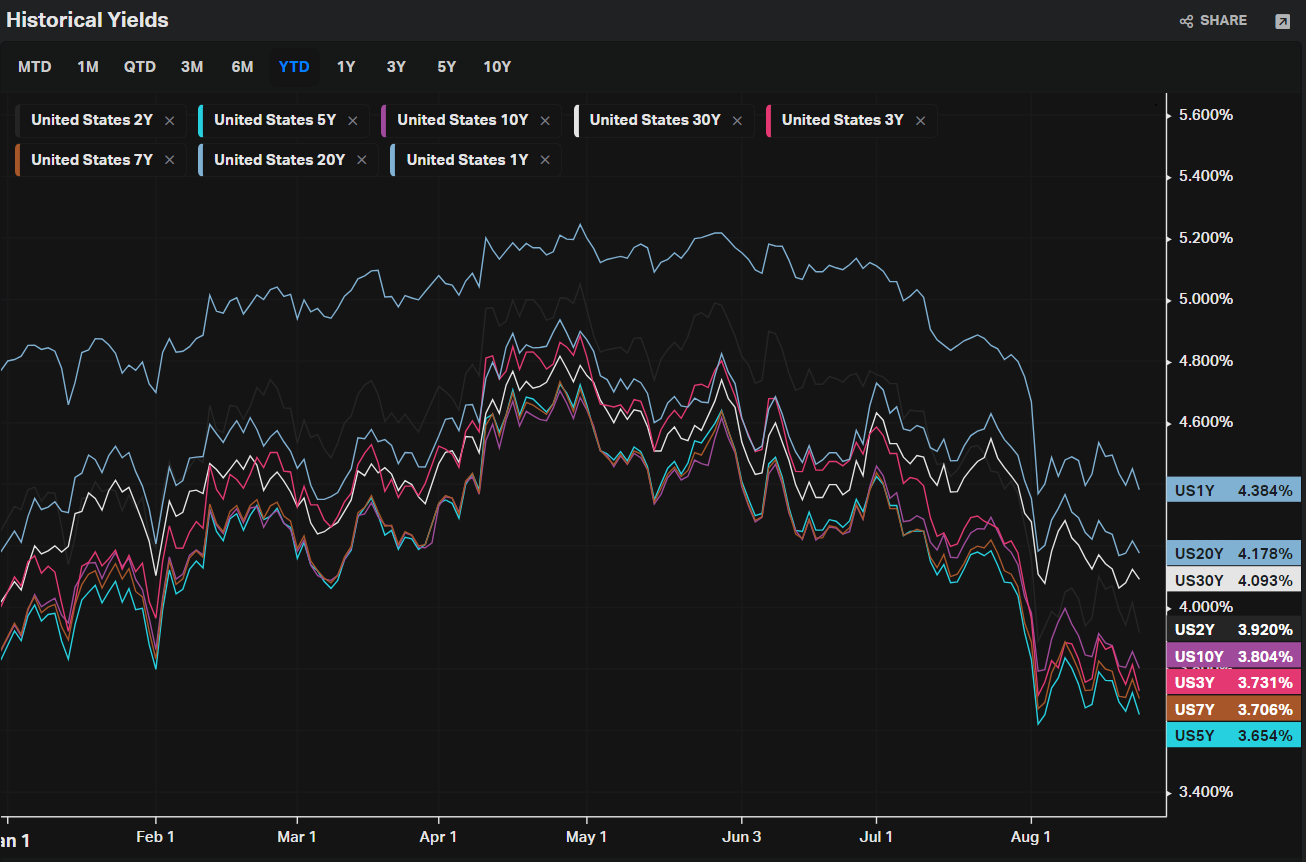
Yields
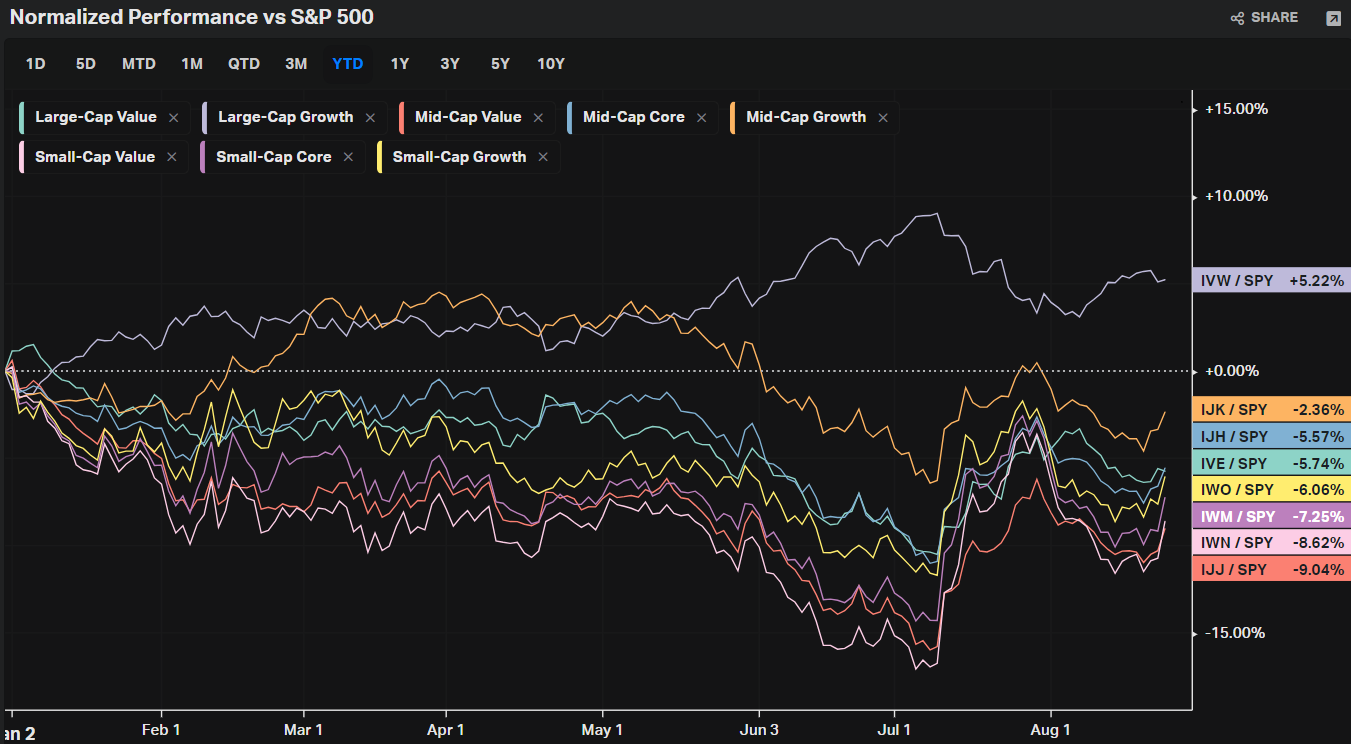
Factors: Size vs Value
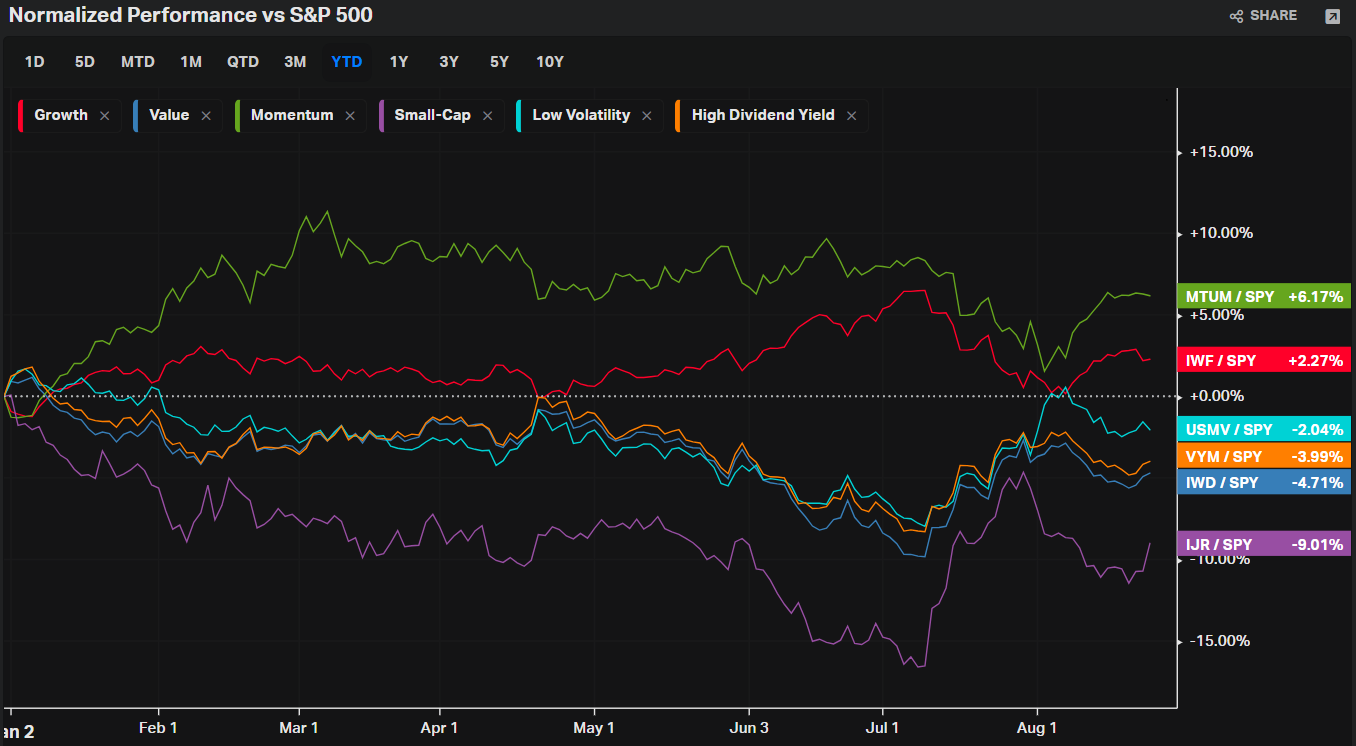
Factors: Style
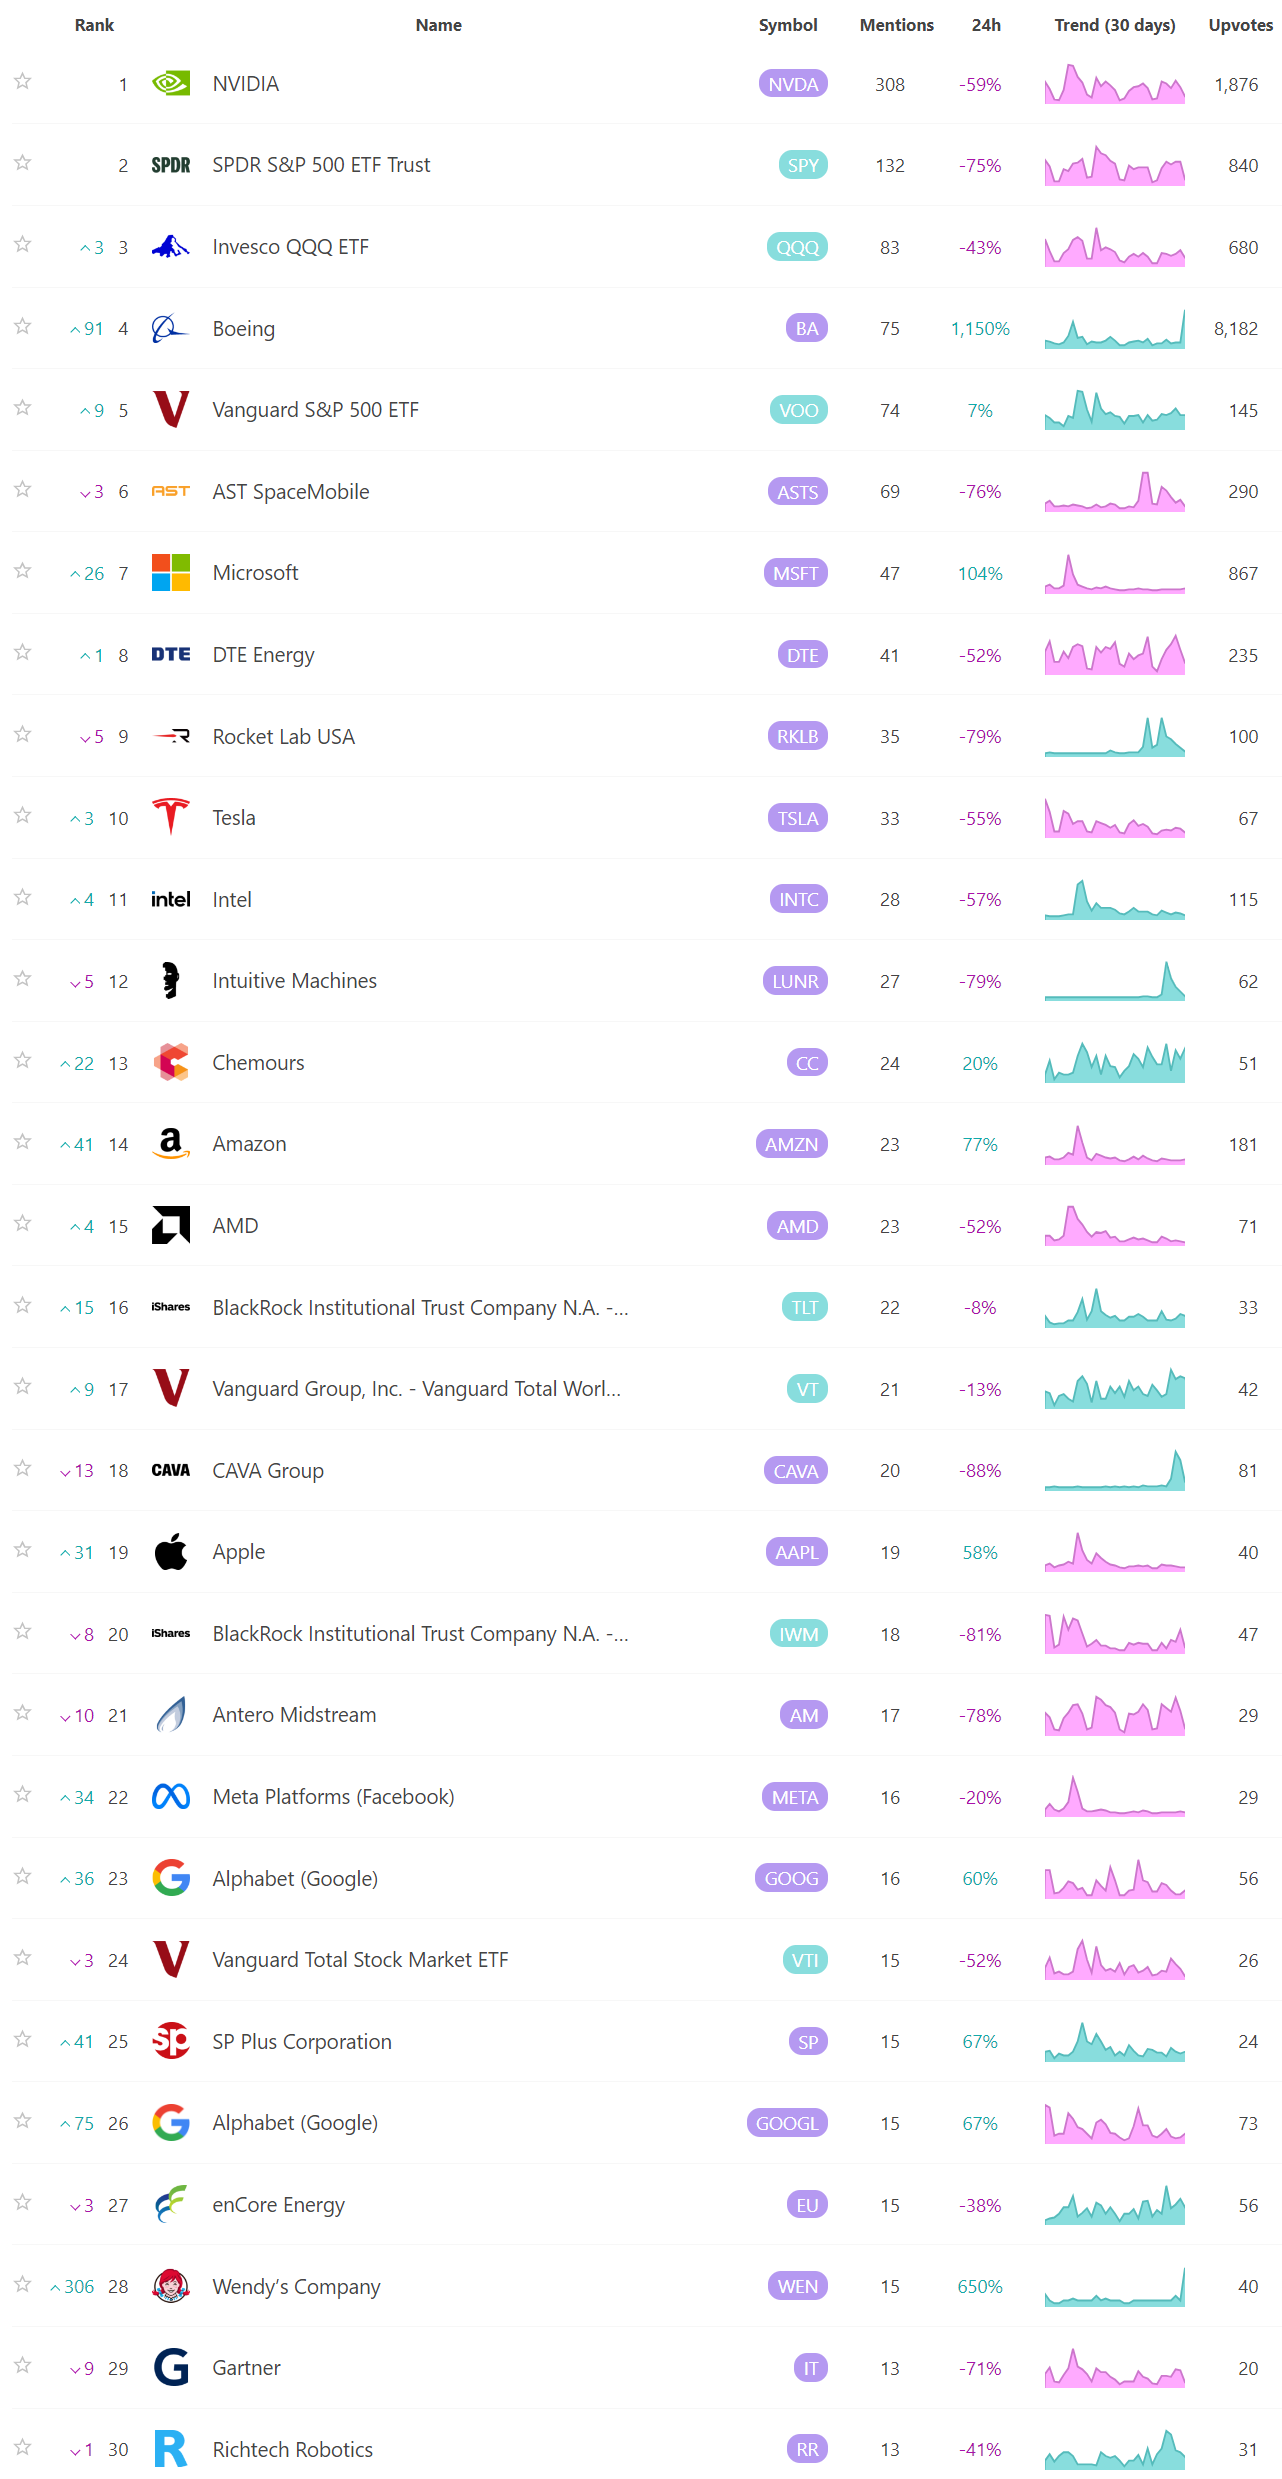
Social Media Favs
Most mentioned/discussed tickers on Reddit from some of the most active Subreddits for trading:
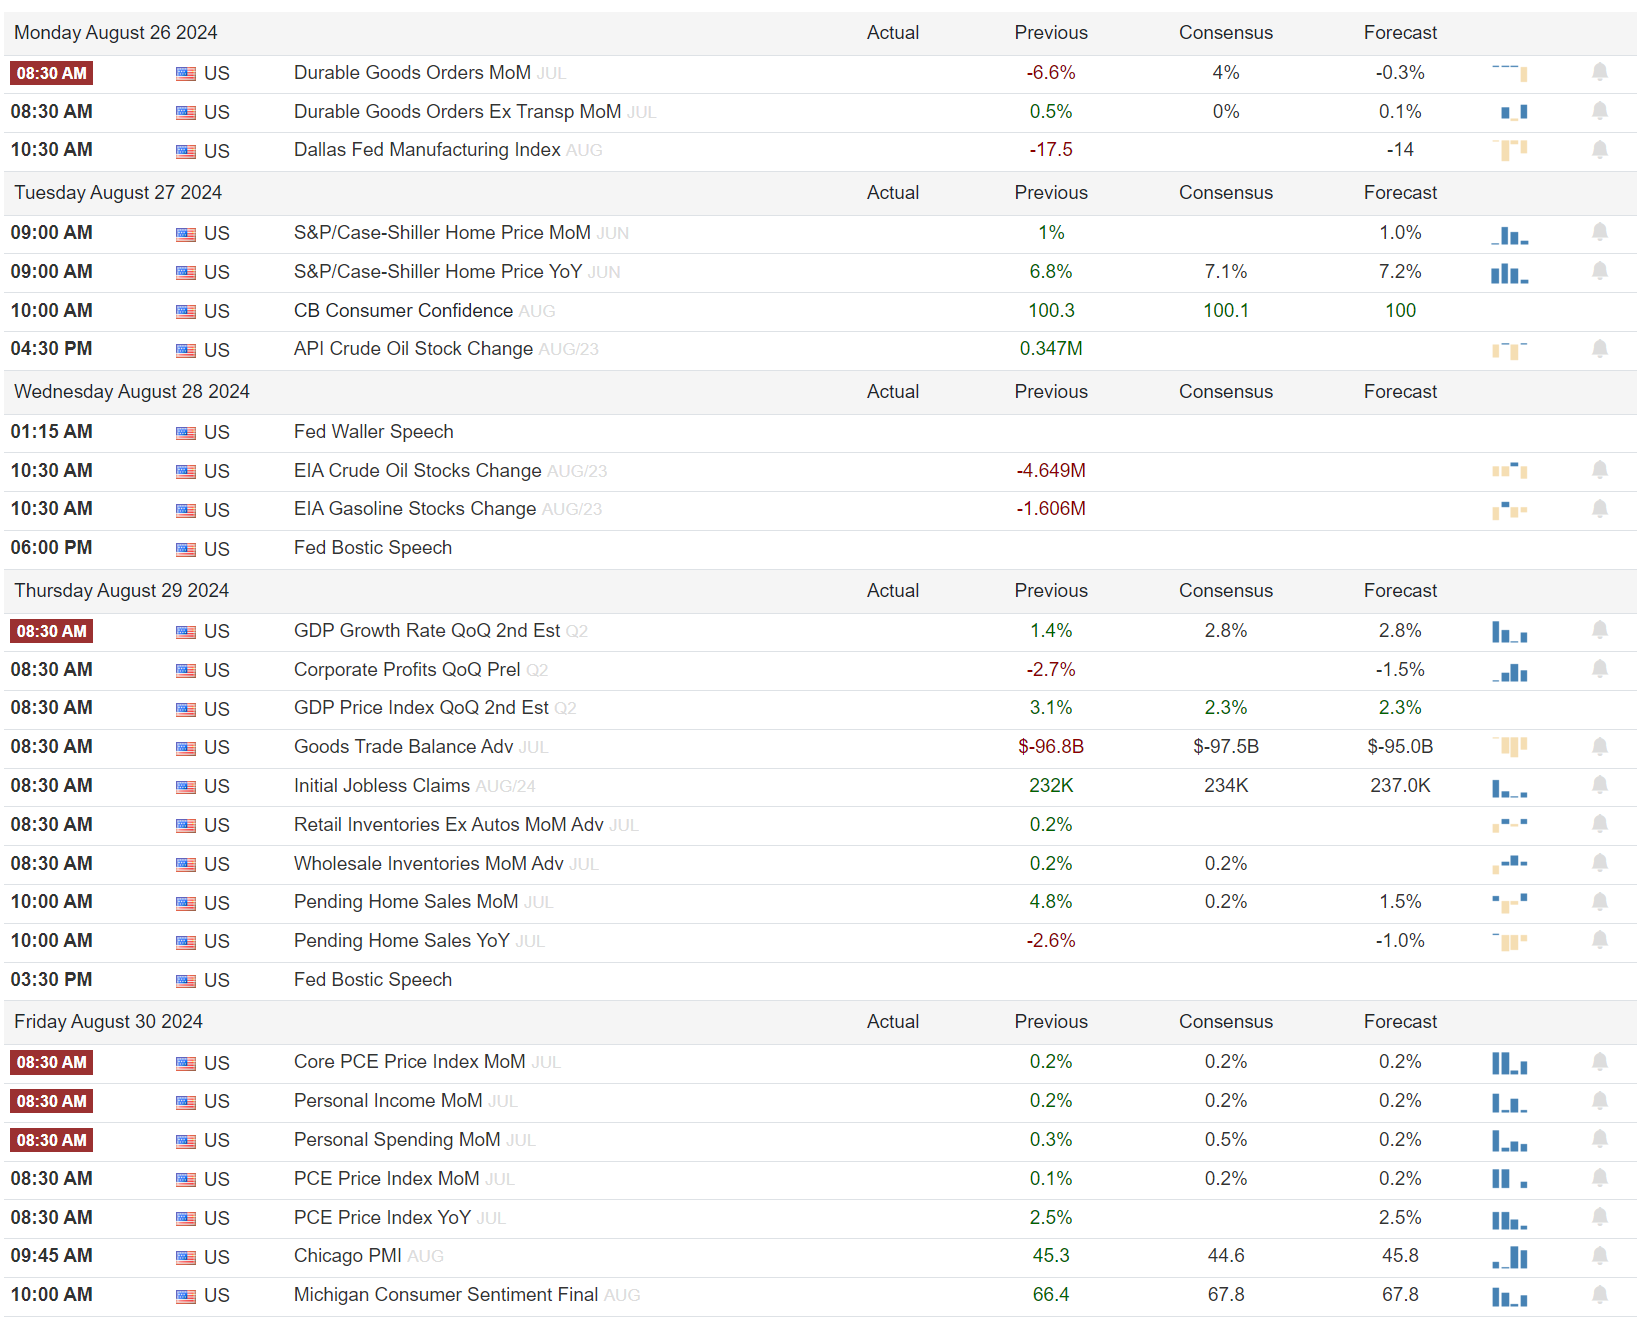
Events On Deck This Week
Here are key events happening this week that have the potential to cause outsized moves in the market or heightened short-term volatility.
Econ
Earnings

A Final Word
Thank you for reading this week's edition of Market Momentum. If you found value in this content, please consider sharing it with a friend or colleague, in a Discord or a Tweet. This small favor helps keep this stack free for you! Please checkout VolumeLeaders.com for your own free trial of the platform that brings you the data powering this stack. Wishing you all a green week ahead filled with many bags ❤️💰.


