
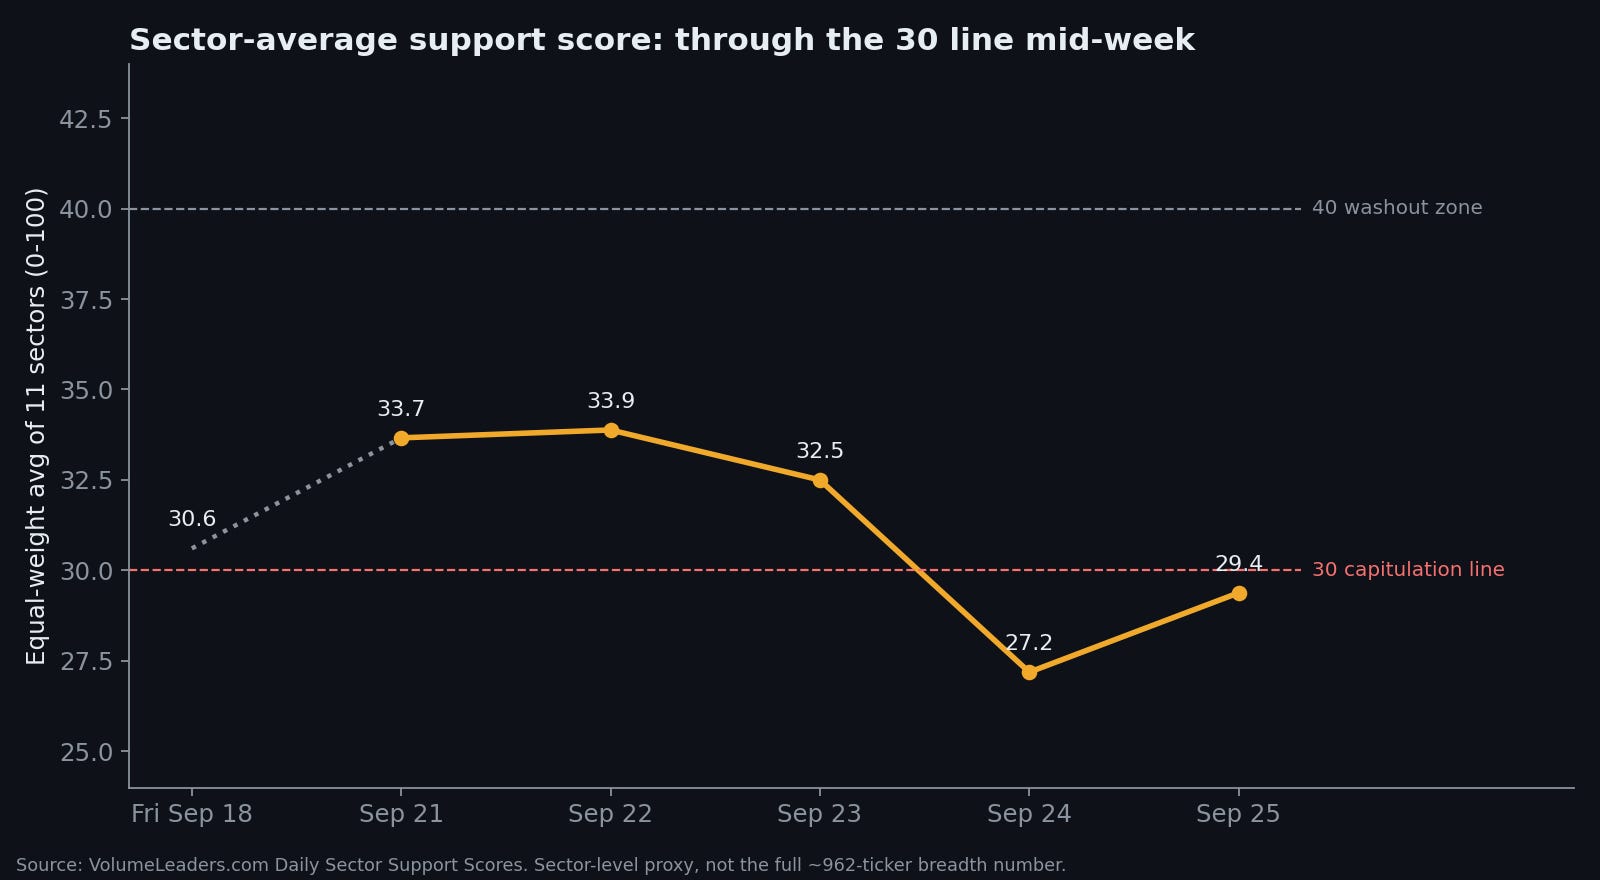
On Thursday, the sector-average support score closed at 27.2.
That’s the first close under 30 in some time. Last week it finished at 30.6, sitting right on the line, and I said that was worth watching. This week it went through. It bounced to 29.4 by Friday, so the week’s net change was a fairly modest -1.2 points. But the path mattered more than the net. Monday opened at 33.7 with a gap higher in the index, Tuesday edged up to 33.9, and then the board spent three days handing all of it back and then some.
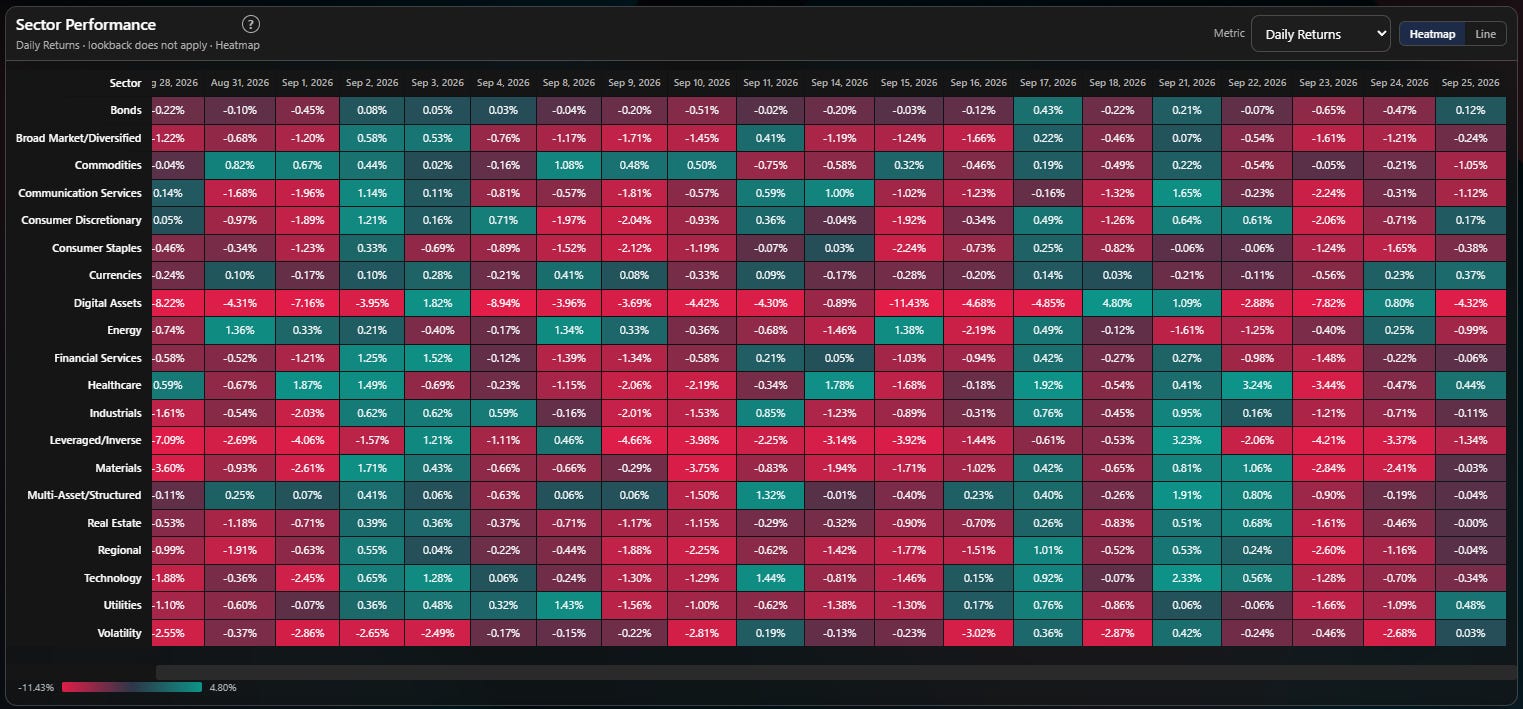
Meanwhile, S&P 500 futures rose about 1.2% on the week. Nasdaq 100 futures rose 3.25%. Russell 2000 futures fell 0.77%.
So the index went up and most of the board went down. Both of those things are true at the same time, and the gap between them is the whole story this week.
What 30 was supposed to mean
A quick refresher for newer readers. Every ticker on VolumeLeaders is tracked for the ten historical price levels where the most volume over the past 30 days has changed hands. The support score is the share of those ten sitting below today’s price. Institutional levels under price suggest support; levels up suggest resistance. Average it across the eleven sectors, equal-weight, and you get the number above. It’s a sector-level proxy for breadth based on actual positioning and institutional dollar commitment.
In the ten-year study (”Does the Support Score Actually Predict Anything?”), 30 was the line I called capitulation. Readings that low have shown up roughly 2 to 7 percent of the time, depending on the sample window. And the low end of this score has been the more useful half of the signal. Readings in that territory have historically been followed by forward S&P returns running roughly 1.5 to 2 times the normal baseline, out to about 40 trading days.
Now the two caveats, because you only get to cite the flattering half if you also cite the other one.
First, that relationship is a post-2018 thing. From 2015 through 2018 it was essentially zero. Since 2019 it’s been consistently present, around -0.20 to -0.25 correlation at longer horizons, but eight years is not forever.
Second, and more important: low readings failed to mark the bottom during actual bear markets. In 2020, the S&P fell about 34% in five weeks, from February 19 to March 23. In 2022, it fell about 25% over nine months, from early January to mid-October. In both, a low support score was a sign that things were bad, not a sign that they were about to get better.
This week has a wrinkle the historical cases I usually point to don’t have. In 2020 and 2022, price was falling alongside breadth. This week, price was rising. The S&P closed Friday at 7743, above its 50-day, 100-day and 200-day moving averages. I’d treat the historical odds as a looser guide than usual here, because the setup isn’t quite the one they were measured on.
Nobody showed up
Here’s the part I keep coming back to.
Capitulation is an event, not a level. It’s the moment when enough people give up at once that the selling exhausts itself. Giving up is loud. It usually shows up as a spike in volume, a jump in fear, a rush for puts.
This week had the level without any of the noise.
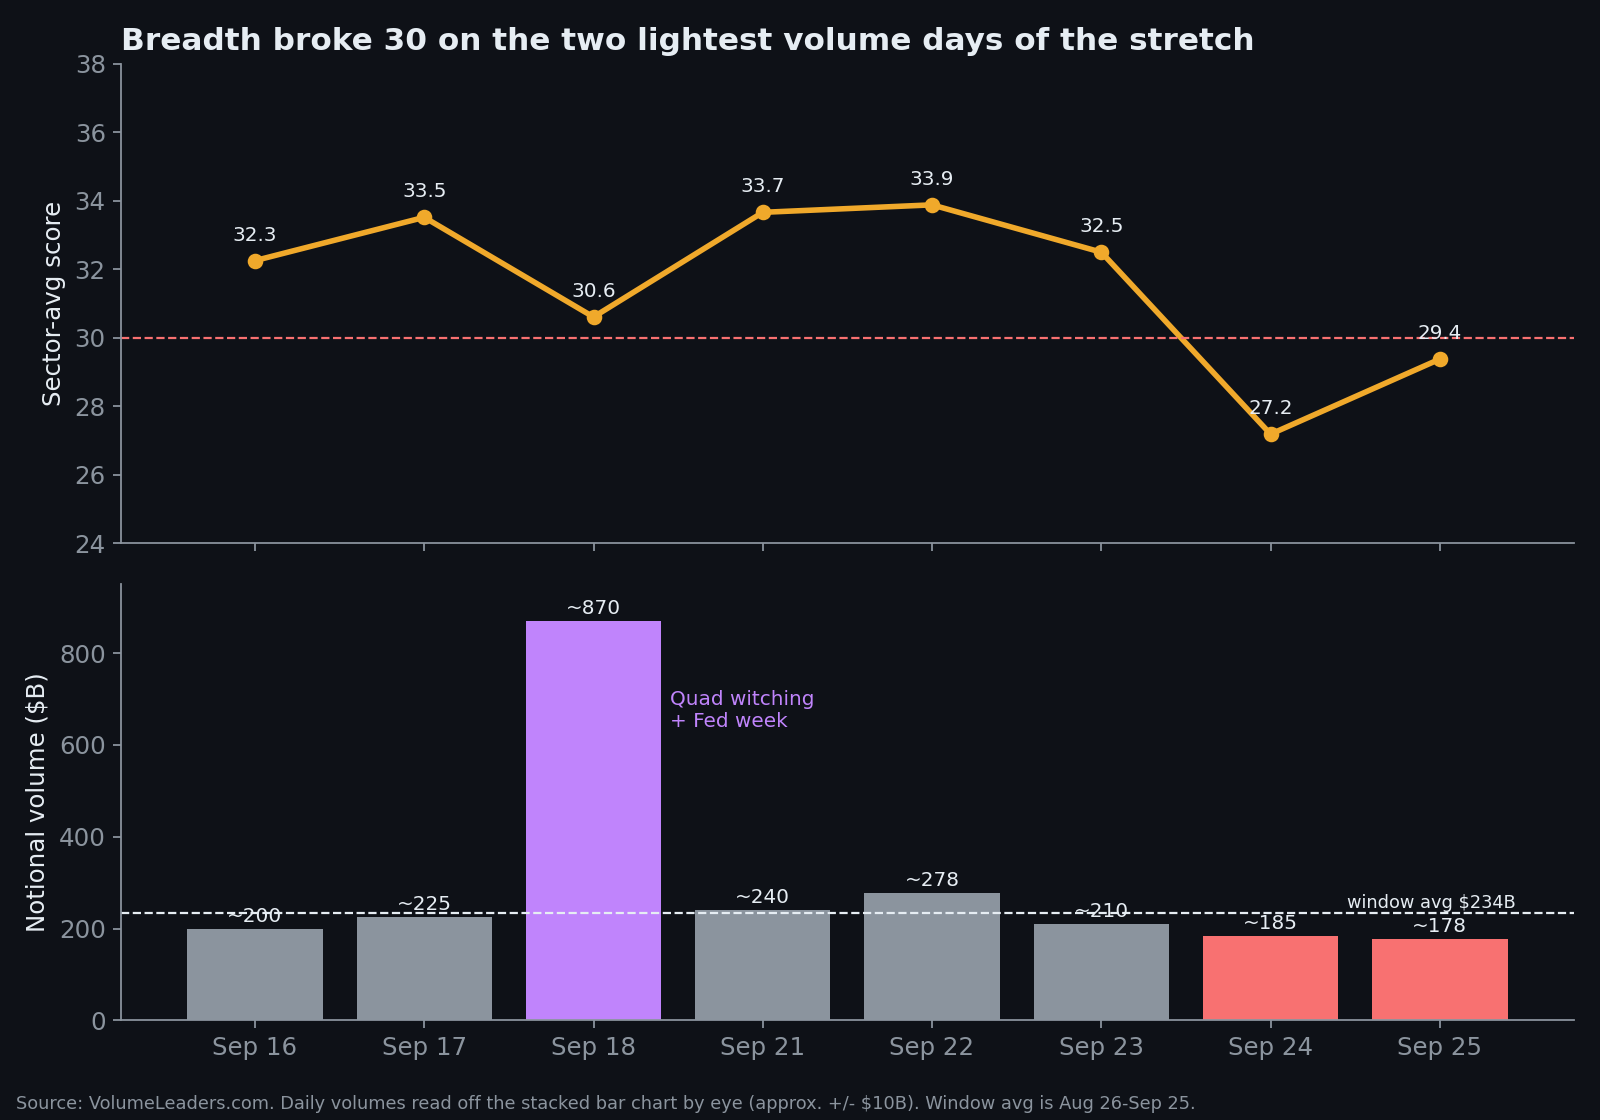
Thursday, the day the score broke through 30, the board traded roughly $185 billion in notional institutional volume. Friday was about $178 billion, the lightest day of the week. Both sit below the 30-day window’s average of $234 billion. The week’s busiest days were Monday and Tuesday, around $240 billion and $278 billion, and those were the days the score was going up.
For scale: the Friday before, September 18, the board traded roughly $870 billion. If that day was a stadium at capacity, Thursday was a weeknight minor-league game, and the scoreboard still changed. That $870 billion needs an asterisk, though. It was quad-witching, the quarterly day when stock options, index options and futures all expire together, and it landed two days after the Fed’s first hike in three years. A lot of that volume was contracts expiring on schedule, which tells you about the calendar more than anyone’s conviction. So I’m not treating the drop-off from $870 billion to $185 billion as a signal. The comparison that matters is Thursday against an ordinary day, and Thursday was lighter than ordinary.
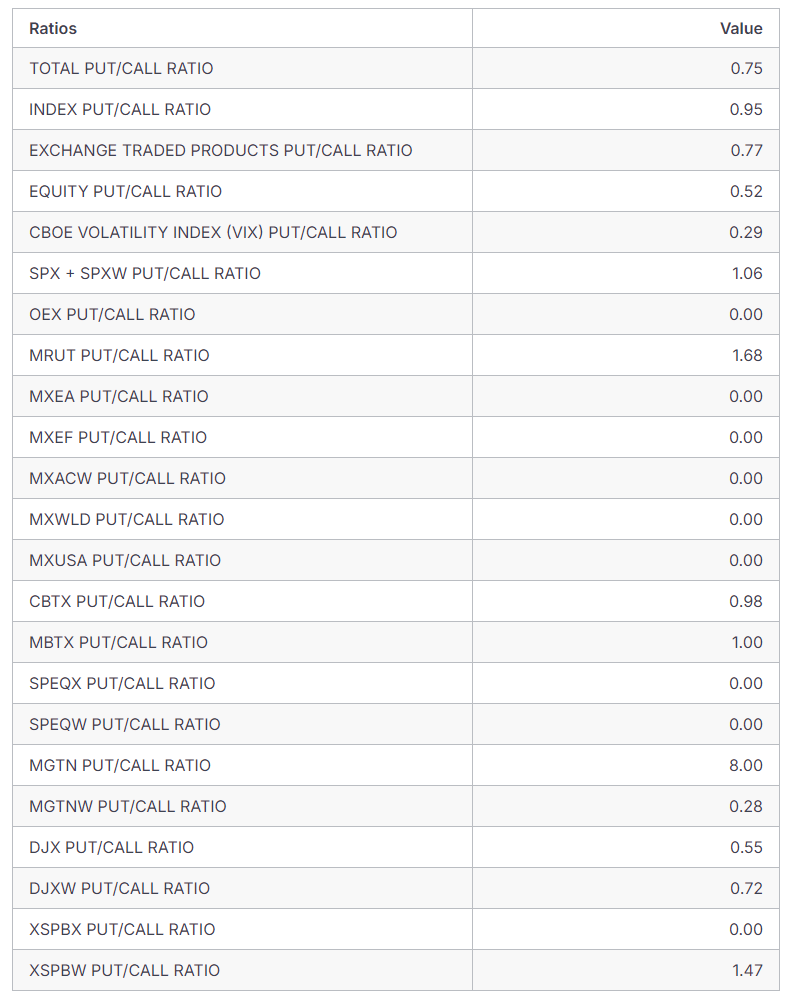
The other fear gauges agreed. Friday’s put-call ratio at 0.75, which can be read as neutral/bullish. VIX futures fell back to basically flat on the week. The people paying for protection weren’t paying much. Institutional macro analysts generally view the VIX at sub-15 levels as structurally underpriced relative to underlying risks, categorizing it as “compellingly cheap” for portfolio insurance.
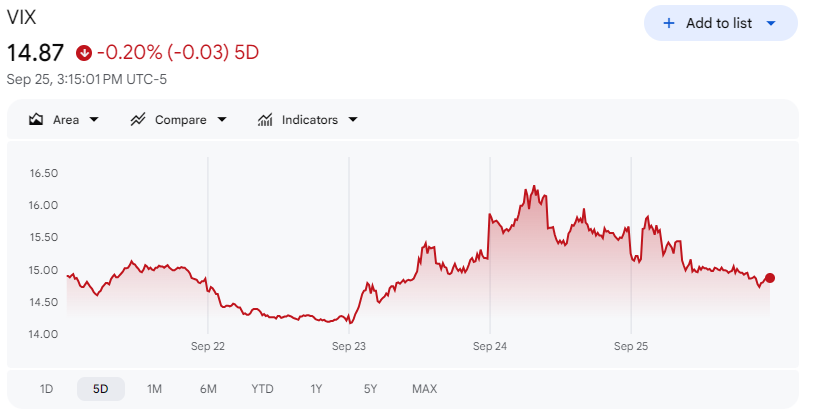
This is the “what people do versus what they say” gap, running in an unusual direction. Usually, the talk is calm and the positioning is scared. This week, the talk and the options market were both calm, and it was the price structure underneath that had quietly deteriorated. Most stocks on this board are now trading below most of the prices where their biggest crowds bought in. Nobody seems alarmed about it.
Two sectors holding up the board
At Friday’s close, two sectors sat at or above 50: Technology at 59.9 and Healthcare at 50.0. Everything else was below 38. Seven of the eleven were below 30.
Take Technology out and the other ten average 26.4. Take Healthcare out too and the remaining nine average 23.7.
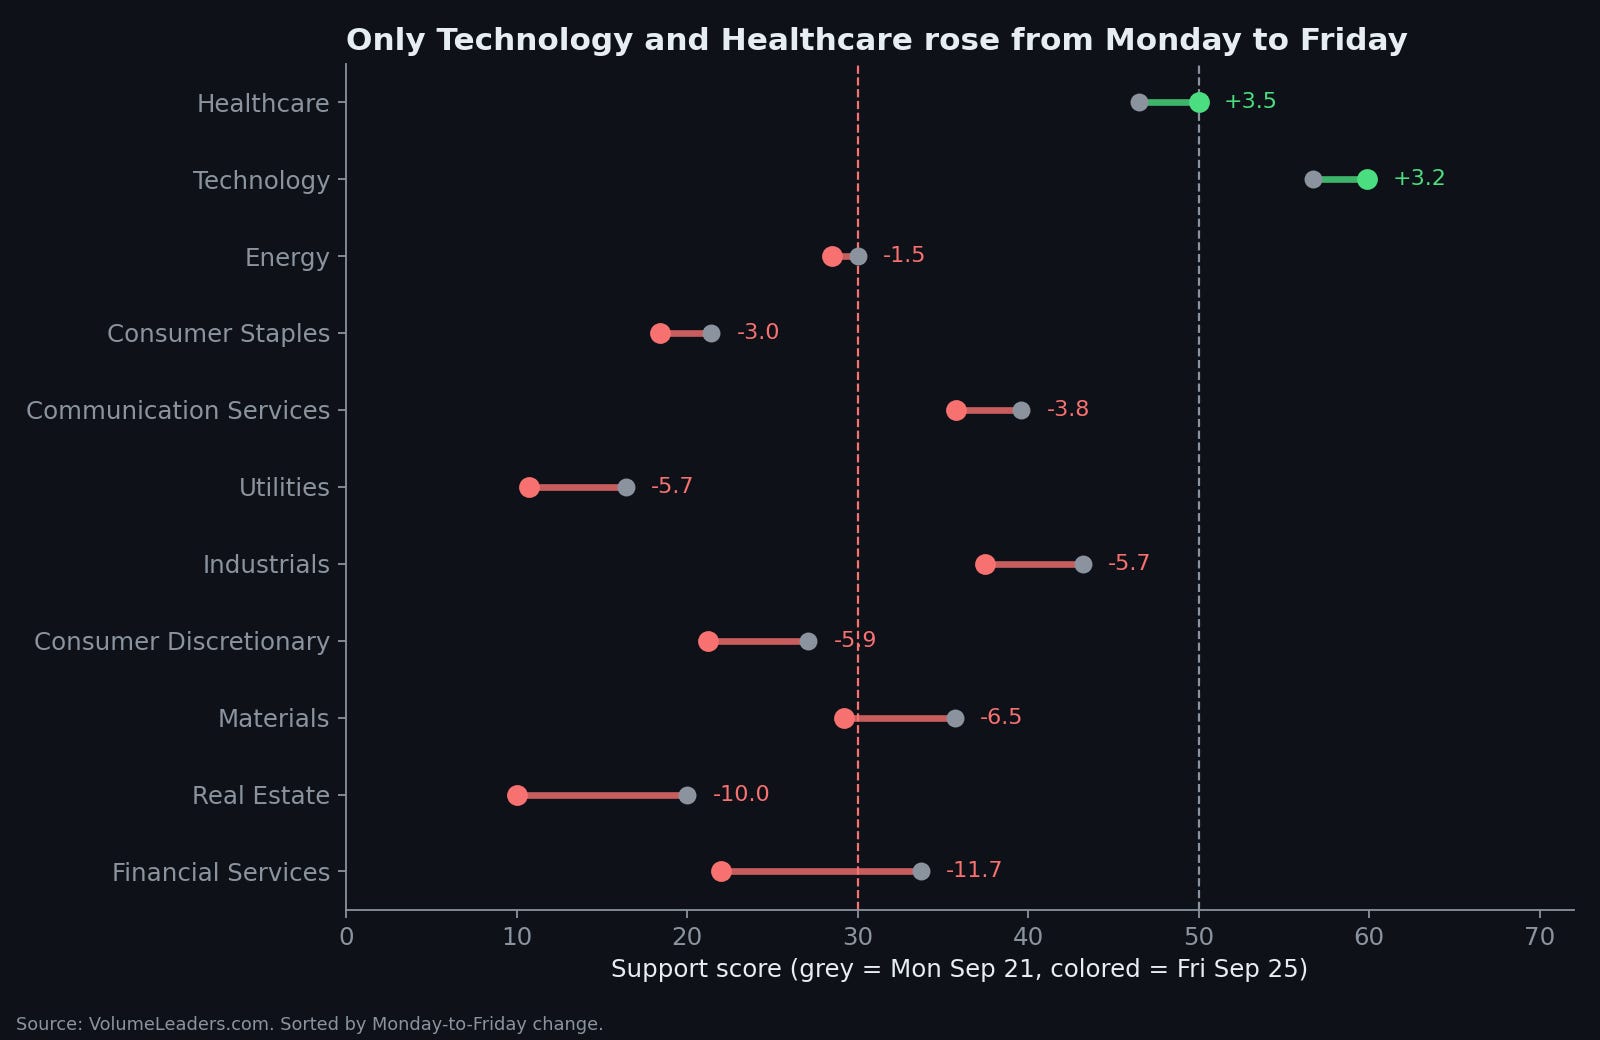
From Monday’s close to Friday’s close, Technology and Healthcare were the only two sectors that rose. The other nine fell. Financial Services dropped the most, from 33.7 to 22.0. Real Estate halved, from 20.0 to 10.0.
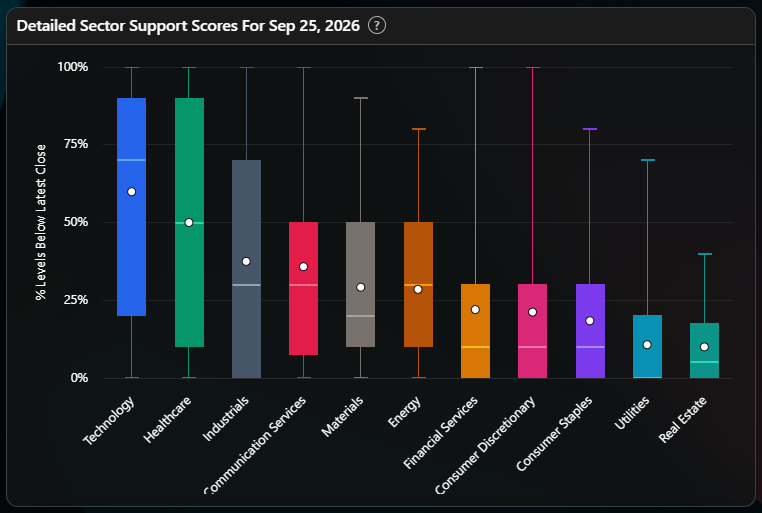
The box plot makes it look even starker. (If you want the full walkthrough on reading it, it’s in [Support Scores Whisker Plot Guide]. Short version: the dot is the average, the line in the box is the typical stock.) In five sectors, Financial Services, Consumer Discretionary, Consumer Staples, Utilities and Real Estate, the median stock sits at 10 or below. That means the typical name in those sectors has at most one of its ten biggest volume levels underneath it. Nine of the ten are overhead. Technology runs the other way: its median is around 70, above its average of about 60, which means most tech names are well supported and a handful of laggards are dragging the average down.
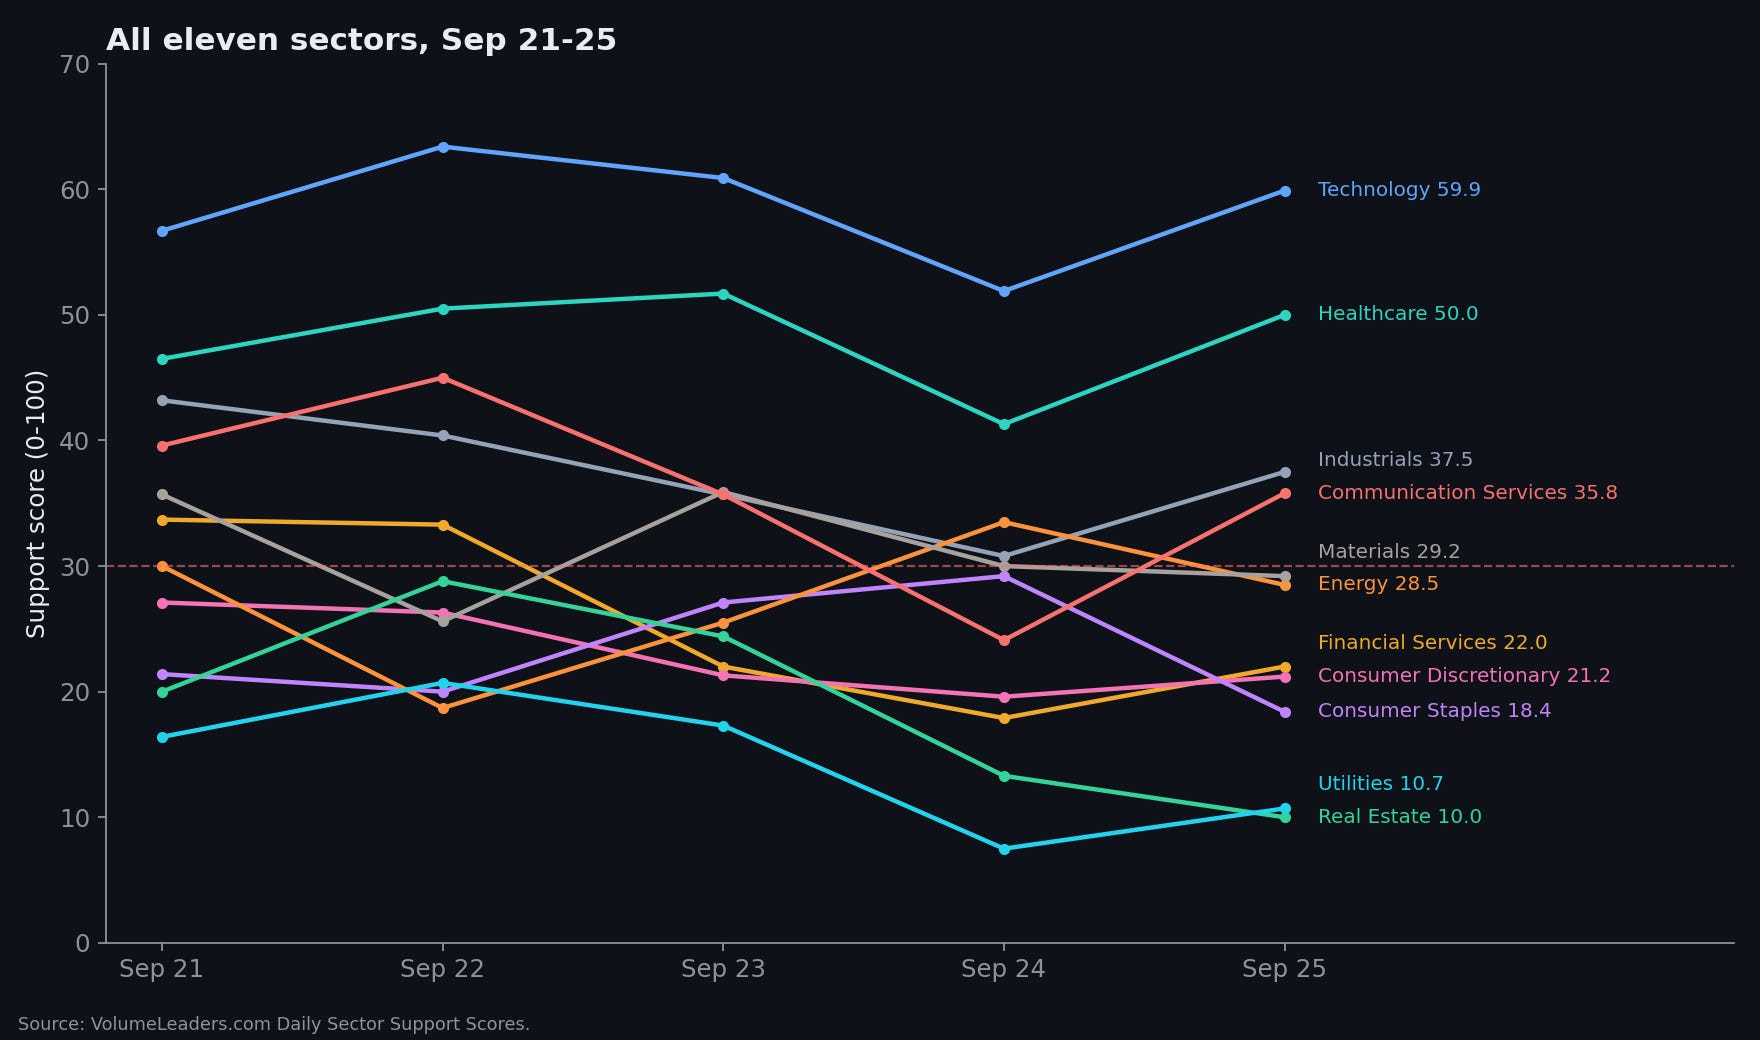
This is how the S&P can rise 1.2% while the board weakens. The index is weighted by company size. The support score gives every sector one vote. When the biggest companies are concentrated in the one sector doing well, a cap-weighted index gets carried and an equal-weight gauge doesn’t.
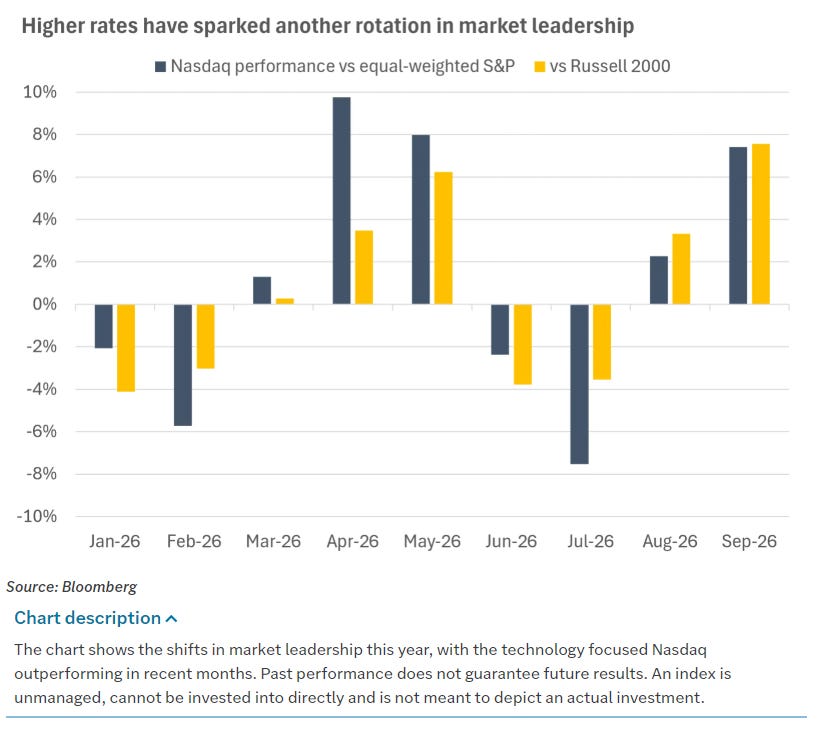
The Nasdaq outperformed the equal-weighted S&P by roughly 7% in September, and the Russell 2000 by about the same. It’s a pretty common read out there that higher rates favor big companies with strong balance sheets over smaller, more indebted ones.
What rates did
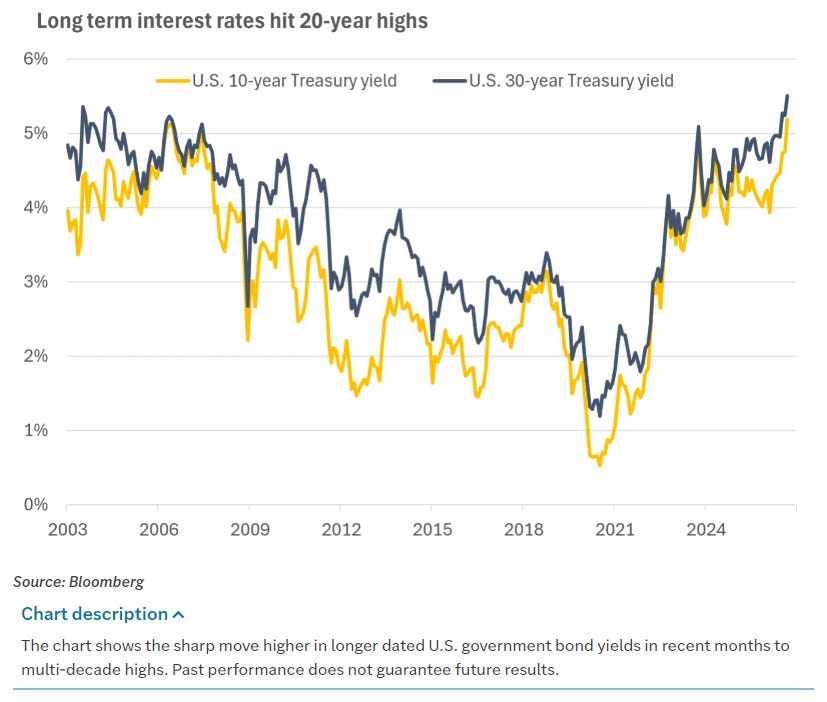
The 10-year Treasury yield finished the week about 20 basis points higher and briefly touched 5.20%, with the 30-year closing just shy of 5.5%. Combative rhetoric between the U.S. and Iran at the U.N. pushed oil up mid-week and sparked a bond selloff, and core PCE inflation is running at 3.3%. The other is growth: a jump in the flash PMIs on Wednesday pointed to faster activity in both manufacturing and services.
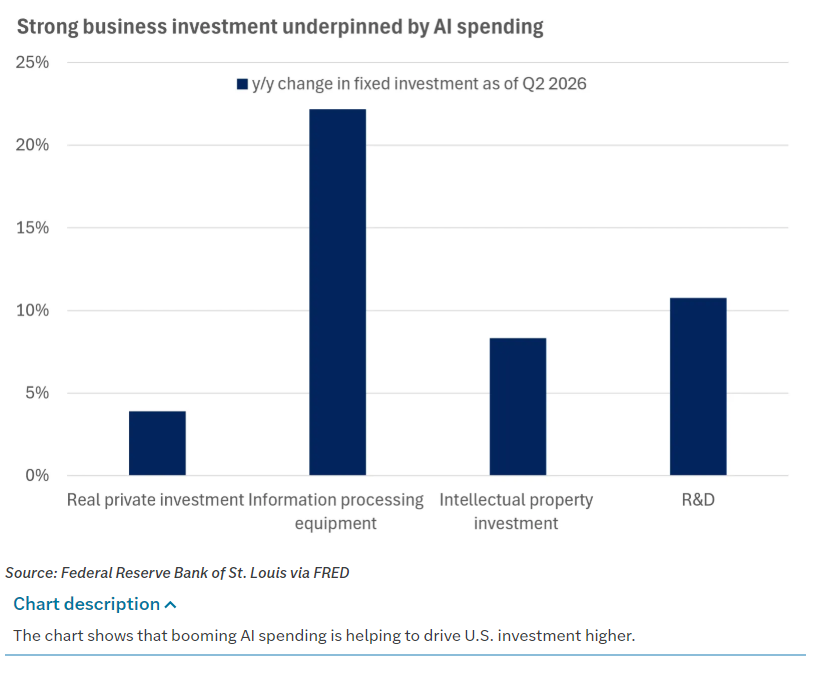
Yields rising on strong growth is a different animal from yields rising on runaway inflation, and analysts are leaning toward growth as the bigger driver.
The sectors that live and die by rates behaved like it. Utilities fell 10.1 points Friday to Friday, to 10.7. Real Estate fell 5.9, to 10.0. Consumer Staples fell 9.5, to 18.4. Those are the three sectors most often owned for their dividends, and when a 10-year Treasury pays north of 5%, a utility’s dividend has to work harder to justify itself. That explanation is clean enough that I’m comfortable leaning on it.
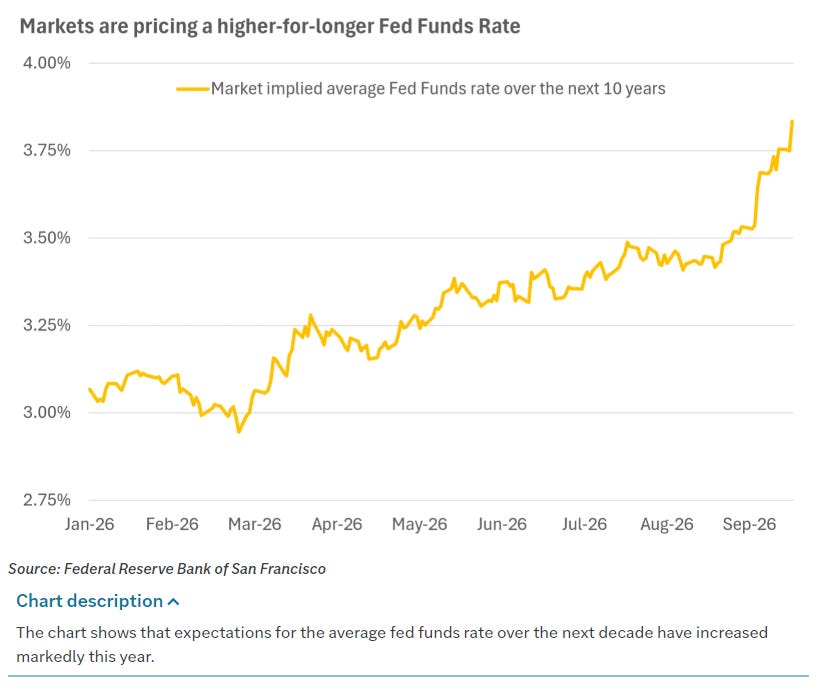
Financial Services is harder. The bond futures suggest the curve steepened this week: the 30-year bond contract fell 2.31% while the 2-year barely moved. A steeper curve has usually helped banks, and I’ve leaned on that explanation in earlier issues. This week Financial Services fell 11.7 points from Monday to Friday anyway, the biggest drop on the board. I don’t have a good explanation from this data. It could be credit worries, or something at the name level that sector screenshots can’t show. I’m leaving it as an open question rather than forcing it into the rates story.
Energy, still whipsawing
Energy’s arc this month has been remarkable. It was at 66.8 on September 16, then lost 36 points in the Fed week. This week it drifted from 30.0 on Monday to 28.5 on Friday, after touching 18.7 on Tuesday.
Oil fell. WTI futures dropped 3.82%, and heating oil futures dropped 7.72%seemingly due to constructive news about a potential phased reopening of the Strait of Hormuz.
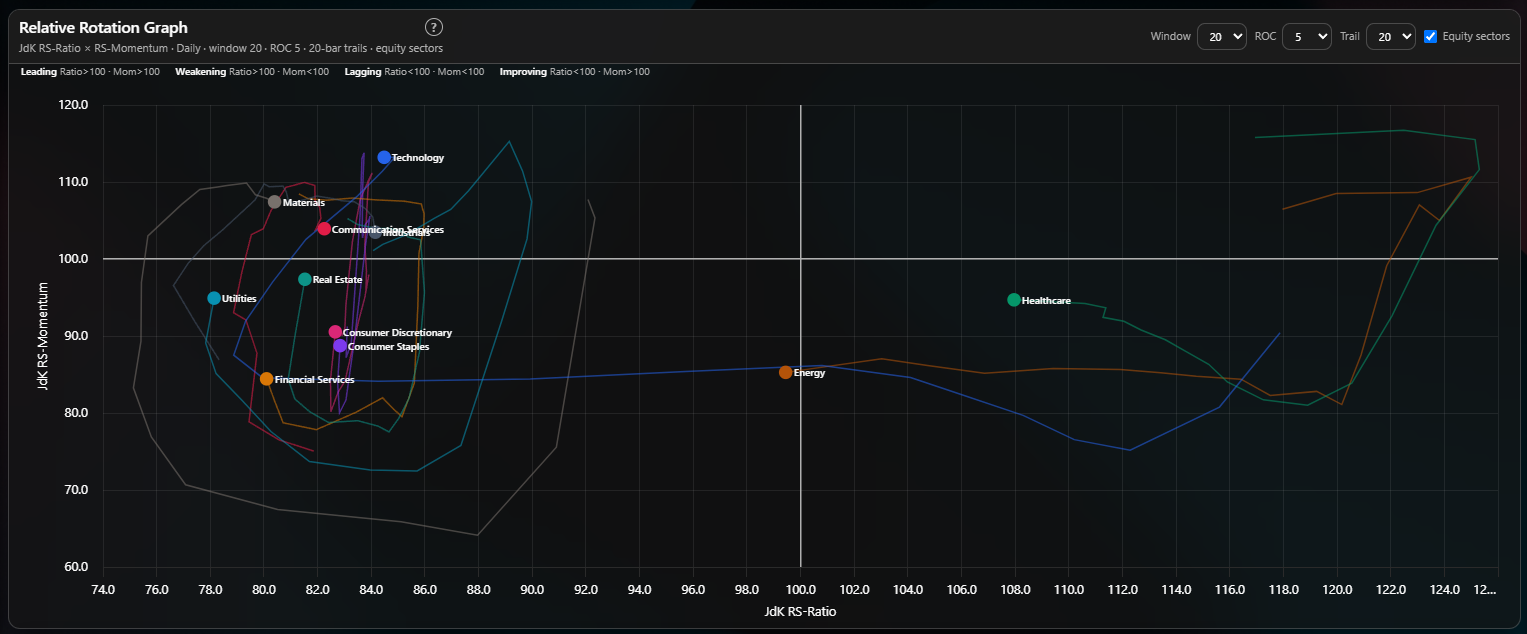
The relative rotation graph shows what that means in relative terms. For weeks, Energy’s trail sat far out on the right side of the chart, in leading territory. It’s now slid all the way back across to just under the 100 line on the relative-strength axis. That’s the first time in this saga it has crossed out of the leading half.
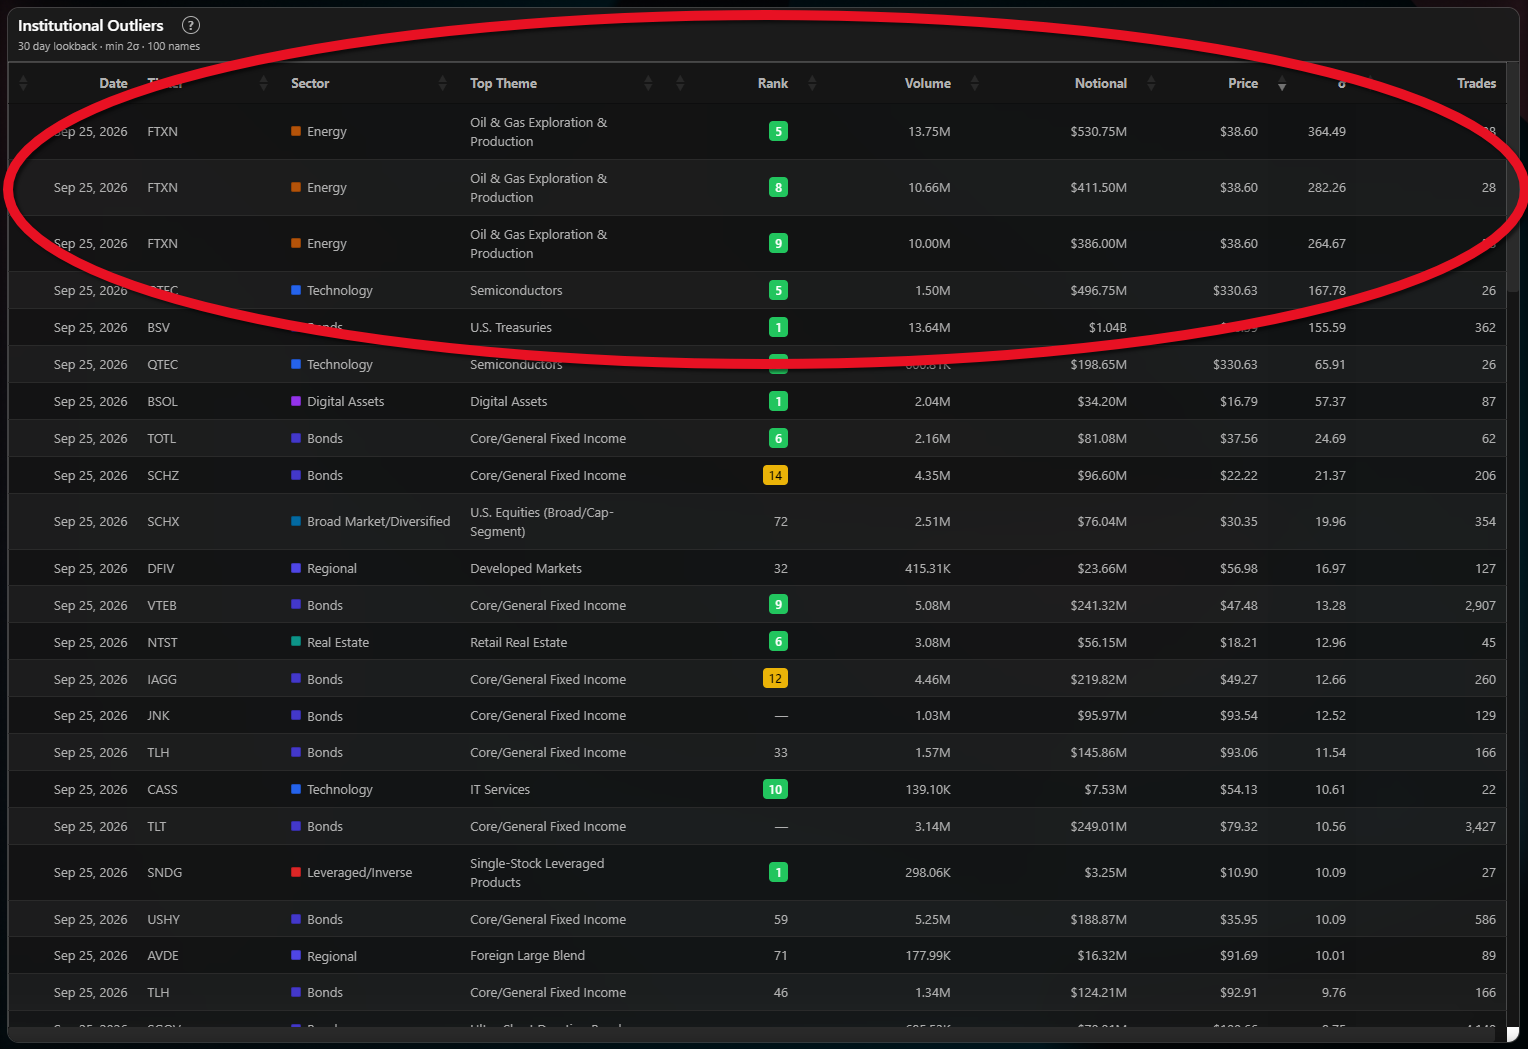
Then there’s Friday’s Institutional Outliers table. The top three entries were all FTXN, the First Trust Nasdaq Oil and Gas ETF. As of September 24, its largest positions were XOM 7.9%, CVX 7.8%, COP 7.7%, MPC 7.4%, EOG 5.4%, VLO 4.2%, and PSX 3.9%. So you still get the majors, but considerably more exposure to refiners and E&Ps than you'd get from a mega-cap-heavy energy index. All three prints traded at exactly $38.60: roughly $531 million, $412 million and $386 million. That’s about $1.3 billion through an energy ETF, in three prints, at one price, on a Friday at size so anomalous relative to its own history that it implies a very strong view on oil, and the table doesn’t say bullish or bearish. Size is not direction. I’m noting it because if you care about which way oil is heading, you might want to mark this one out on your charts.
A small note on the debasement debate
The strong-economy-or-debased-dollar debate tilted one way this week. Gold futures fell 2.34%, silver fell 3.50%, oil fell 3.82%, and the dollar index rose 0.78%. In a debasement trade, you’d expect hard assets up and the dollar down. This week had the opposite. That fits a real-rates story instead. One week doesn’t settle it, but it’s the cleanest read against debasement in a while.
Institutional Positioning At A Glance
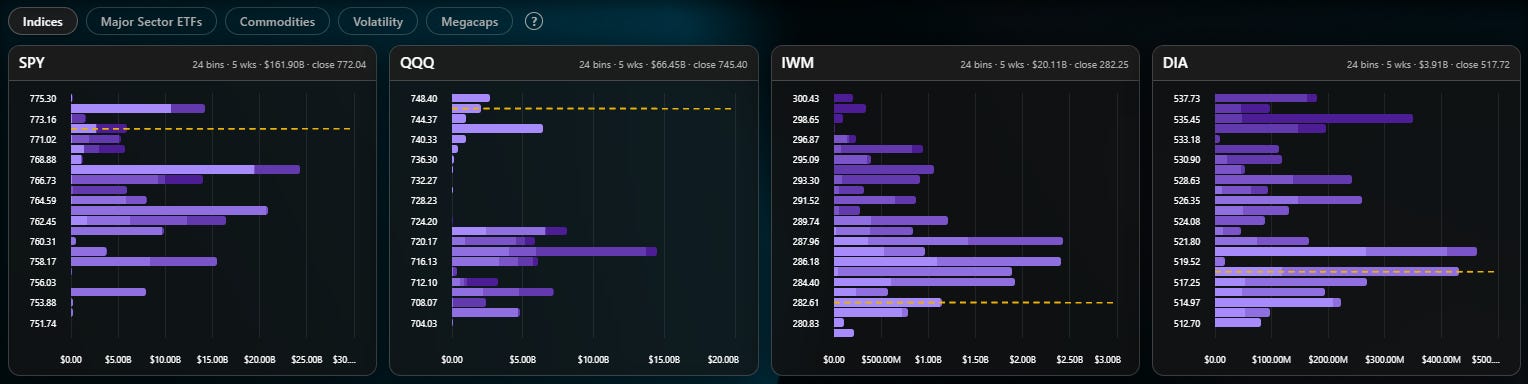
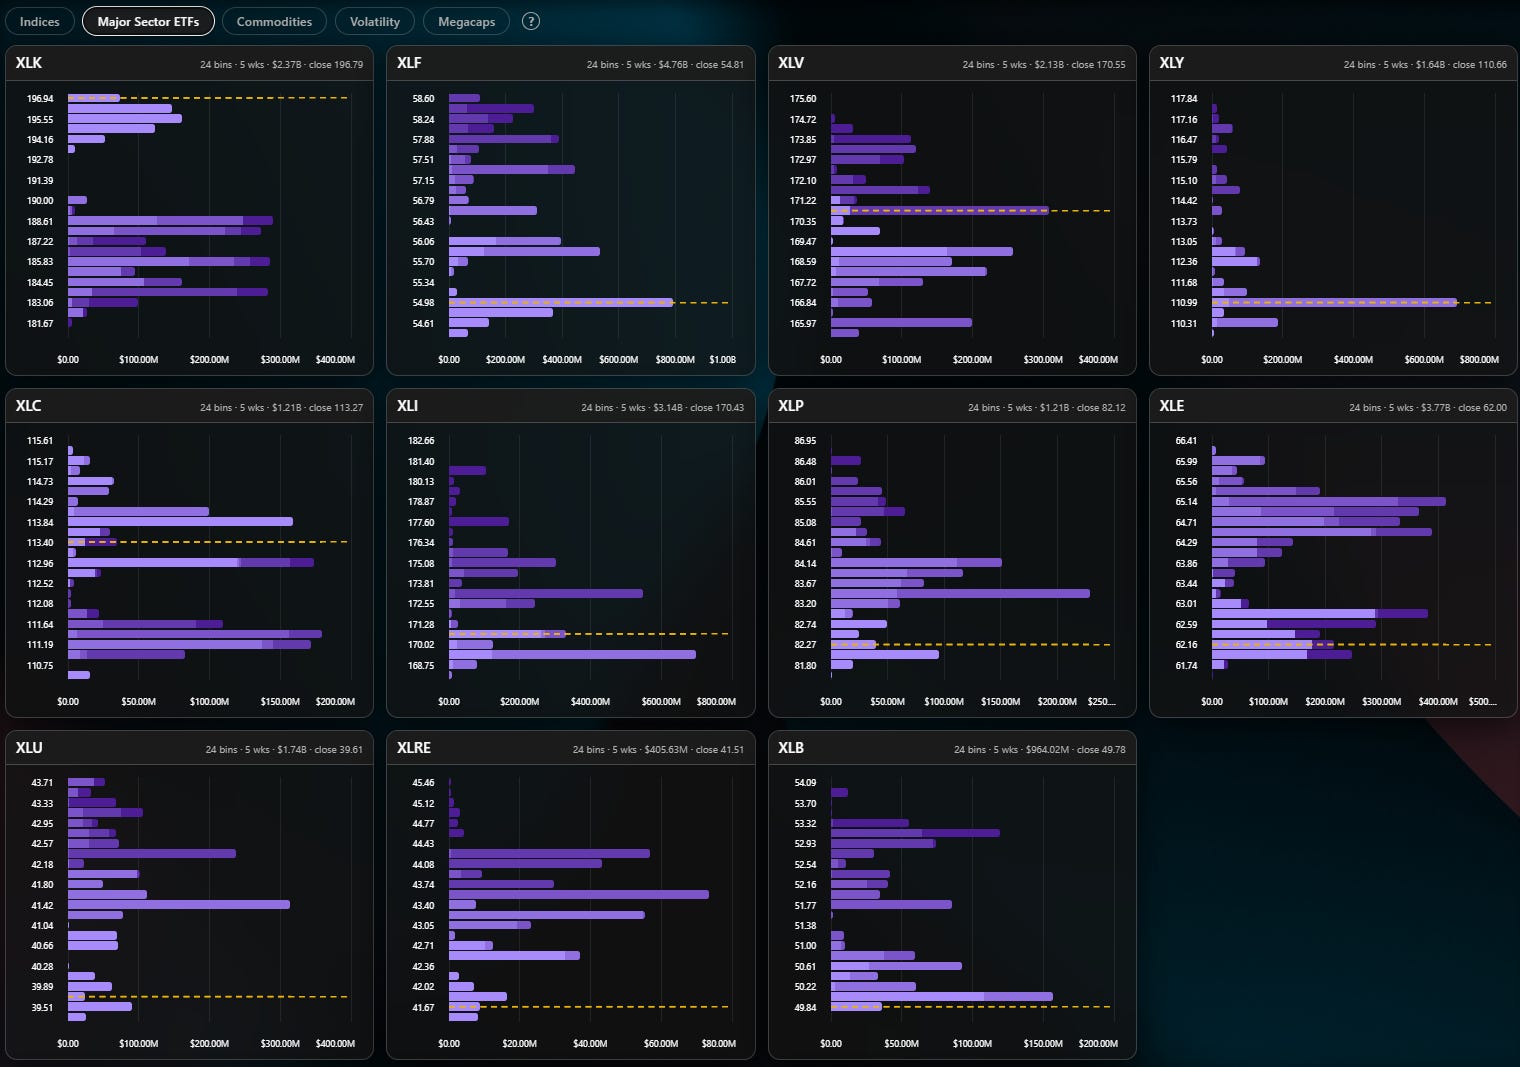
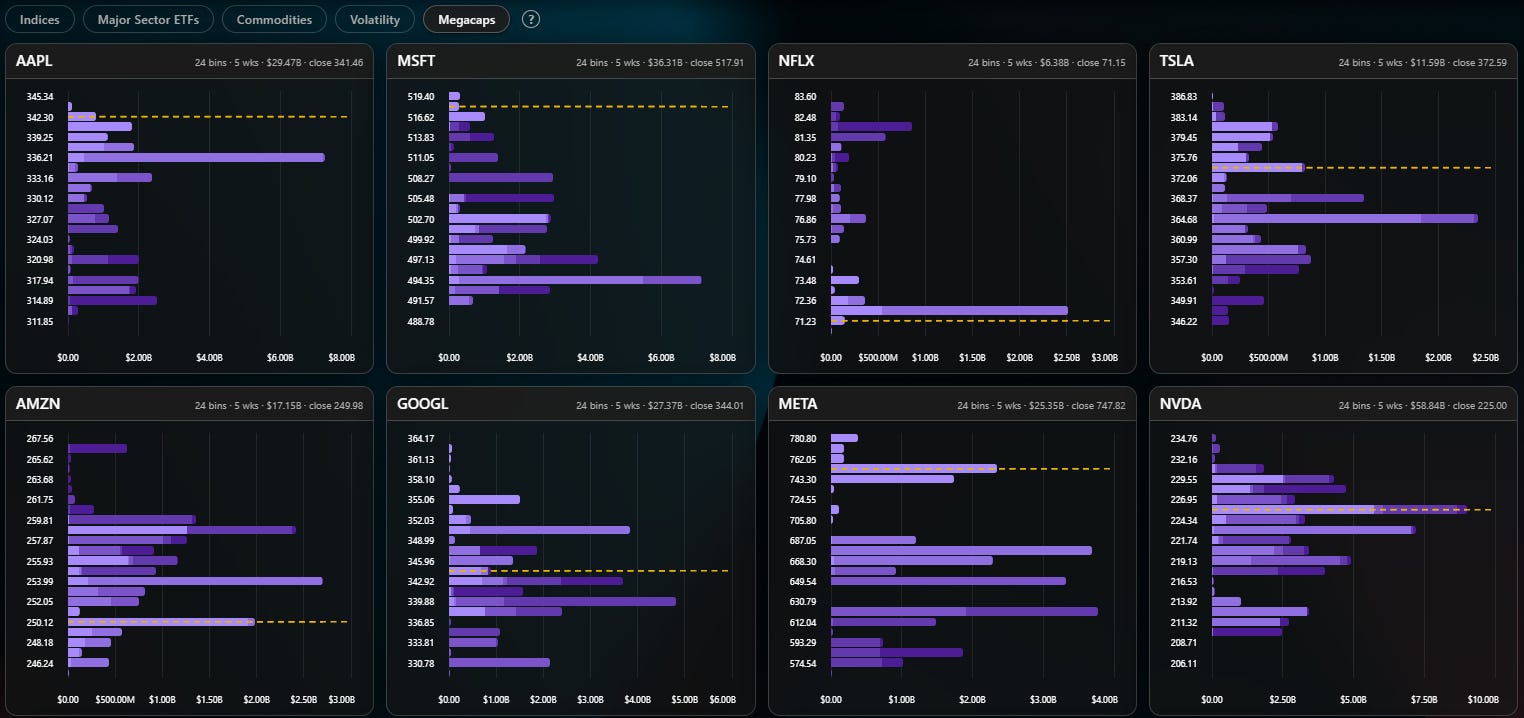
Two readings
Here’s where the data can’t make up its mind:
Reading one: quiet erosion. Breadth broke 30 without a volume spike, without fear, without anyone rushing for protection. If capitulation requires someone to capitulate, nobody has yet. On this reading, the index is being held up by one sector, the rest of the board is sliding without much resistance, and the real washout, if there is one, is still ahead. The historical odds from the study wouldn’t apply yet, because the event they measure hasn’t happened.
Reading two: the selling already happened. The heavy lifting was done in the Fed week, when Energy lost 36 points and the board saw its biggest volume day in this window. This week is what’s left over: sellers who didn’t get out, drifting out on light volume. On this reading, the light volume is the good news. It says nobody’s in a hurry to sell, and a sub-30 score with the index still near highs is exactly the kind of setup where the study’s forward-return odds have tended to be decent.
The thing that settles it is volume on the next leg down. If the score makes a new low below 27.2 on heavy volume, that’s the crowd arriving, and reading one is right about there being more to come, even if that crowd eventually marks the bottom. If the score drifts back above the low 30s on light volume and the index holds, reading two gets stronger.
On deck
Next week has a few things that bear directly on this. Micron reports Wednesday after the close. With Technology the only sector really holding the board up, a memory-chip bellwether is worth watching. August PCE inflation comes Wednesday morning, which feeds directly into the inflation half of the rates story. Nike reports Thursday after the close, a decent read on the consumer, relevant with Consumer Discretionary sitting at 21.2 and a median of 10. And Friday brings September payrolls, with consensus around 100,000 against 162,000 last month.
What this means by your clock
If you trade on days to weeks: the index and the board are telling different stories, and the index is only being carried by one sector. That’s a narrow base. The board itself says most names are already below their heaviest levels, so there’s not much structural support underneath the average stock. Watch volume on down days more closely than price.
If you invest in weeks to months to years: a sub-30 reading has historically been a better-than-average time to shop for discounted stocks, with the important exception of real bear markets. The index isn’t in one. Nothing about one week of breadth data requires doing anything. It’s worth knowing the board is this washed out, and it’s worth knowing that the historical odds, while decent, are a guide rather than a promise. Derivative desks highlight that current VIX pricing offers an inexpensive entry point for tail-risk hedging, with several quantitative models signaling that equity markets may be over-relying on compressed implied volatility. Also worth noting that market participants continue to price higher premiums into medium-term contracts (such as late 2026/early 2027 futures) to account for structural headwinds, upcoming fiscal uncertainties, and pre-earnings corporate buyback blackout periods.
That’s the week. The index had a nice time. Most of the board did not, and very few people noticed.
Talk soon, Bruce
If you’re not a subscriber yet, I’d love to have you. And if you’ve got questions about VolumeLeaders itself, what the data means, how to read the dashboard, anything, just reach out. Happy to answer them directly.
This newsletter is for informational purposes only and is not investment advice. Nothing here is a recommendation to buy or sell any security. Past patterns in this data are not a guarantee of future results, a point this piece has hopefully made concrete rather than just disclaimed.
Thank you for being part of this community and for investing your time in this week’s edition. The quality of this readership — thoughtful, disciplined, engaged — is what makes this work meaningful. I’m grateful to build alongside you. Here’s to a week of clarity, conviction, and well-executed opportunities.
— VolumeLeaders