

Market Momentum: Your Weekly Financial Forecast & Market Prep
Issue 59 / What to expect Sept 1, 2025 thru Sept 5, 2025

NOTE: This weekly periodical is too large for Substack to deliver in its entirety via email - you will only see a portion of this great content if you read from your email client. Click the header/title at the top to read the full article!
In This Issue
Weekly Market-On-Close Report: All the macro moves, market drivers, and must-know narratives—covered in less than five minutes.
Weekly Benchmark Breakdown: Our weekly intelligence report on major indices cuts through the index-level noise to uncover participation, momentum, and structural integrity and tell you whether markets are rising on solid ground or skating on thin breadth. This is where bull markets prove themselves—or quietly start to unravel.
The Latest Investor Sentiment Readings: Track the emotional pulse of the market with our curated dashboard of sentiment indicators. From fear-fueled flight to euphoric overreach, this week's readings reveal whether investors are cautiously creeping in—or stampeding toward the exits.
Institutional Support & Resistance Levels For Major Indices: Exactly where to look for support and resistance this coming week in SPY, QQQ, IWM & DIA
Normalized Performance By Thematics YTD: Which corners of the markets are beating benchmarks, which are overlooked and which ones are over-crowded!
Key Econ Events & Earnings On-Deck For This Coming Week
Market Intelligence Report: Track the real money. This section breaks down where institutions are placing their bets—and pulling their chips. You'll get a sector-by-sector view of flows, highlighting the most active names attracting large-scale buying or selling. We go beyond the headlines and into the tape, surfacing the week’s most notable block trades and sweep orders, both on lit exchanges and hidden dark pools. Whether you're following momentum or fading crowded trades, this is your map to where size is moving and why it matters.

Weekly Market-On-Close Report
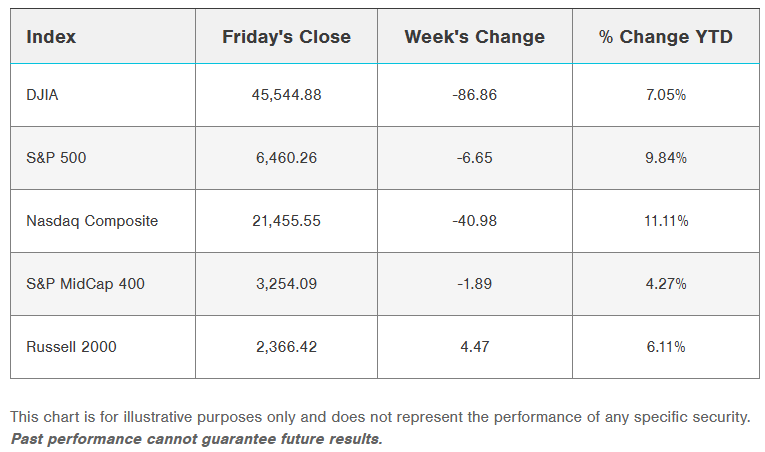
Friday’s close brought the kind of uneasy punctuation mark that tends to linger over a long weekend. The S&P 500 shed -0.64%, the Dow ticked down by a milder -0.20%, and the Nasdaq 100 slumped by -1.22%, the day’s heaviest casualty. Underneath the surface, the E-mini contracts told a similar story: September S&P futures were lower by -0.68%, and Nasdaq futures fell by -1.31%. The culprit wasn’t hard to find. Technology—which had carried so much of this year’s enthusiasm—took the brunt of the damage.
Semiconductors were front and center in that weakness. Marvell Technology collapsed more than -18% after its Q2 data center revenue missed already high expectations. Dell Technologies added to the downdraft with an -8% slide as margins on its AI servers came in tighter than investors had bet on. In both cases, the message was simple: the AI boom is real, but the economics of keeping pace with it are not as linear as headlines suggest. The street is beginning to question how sustainable these capital expenditures are, and whether every dollar of revenue growth in the space is worth the multiples currently attached to it.
The macro data didn’t help sentiment. The August MNI Chicago PMI registered a sharp contraction, falling to 41.5 from 47.1 and badly missing expectations of 46.0. That’s not a trivial miss; it put the region’s manufacturing gauge squarely into recessionary territory. Meanwhile, the University of Michigan’s consumer sentiment index for August was revised down to 58.2 from 58.6, when markets had expected no change. While a small numerical adjustment, the downward revision added weight to the idea that the consumer, who has held up remarkably well, may finally be tiring at the edges.
Inflation data also offered a bitter pill. The core PCE price index, the Fed’s preferred measure, rose +2.9% year over year in July, the largest gain in five months and a touch higher than June’s +2.8%. That reading was exactly on consensus, but it underscored the problem policymakers face: inflation progress has slowed just as growth data shows signs of fatigue. Sticky inflation and wobbling growth rarely coexist peacefully.
And yet, there were counterweights. Personal spending rose +0.5% in July, the strongest in four months, while personal income gained +0.4%. Both matched forecasts, reinforcing the picture of consumers willing to keep their wallets open. Importantly, the University of Michigan’s inflation expectations survey offered a modest reprieve. One-year expectations ticked down to 4.8% from 4.9%, and the 5–10 year outlook eased to 3.5% from 3.9%. That downtick, however small, matters to the Fed’s calculus: it helps frame inflation as a fading rather than entrenched threat.

The Fed itself added more nuance. Governor Christopher Waller, speaking late Thursday, openly endorsed a 25-basis-point cut at September’s FOMC meeting, while projecting further reductions over the following three to six months. His words were unusually direct: “With underlying inflation close to 2%, market-based measures of longer-term inflation expectations firmly anchored, and the chances of an undesirable weakening in the labor market increased, proper risk management means the FOMC should be cutting the policy rate now.” San Francisco Fed President Mary Daly echoed the sentiment, saying it would “soon be time” to recalibrate policy, dismissing tariff-related price increases as likely “one-off.”
Those tariffs, though, are quickly turning into a market theme of their own. President Trump this week threatened fresh levies on advanced technology and semiconductors in retaliation for digital services taxes. That comes on the heels of an expansion of steel and aluminum tariffs to more than 400 consumer items, including motorcycles, auto parts, and furniture components. And it follows August’s decision to double tariffs on Indian imports due to its Russian oil purchases. If implemented in full, average U.S. tariffs could reach 15.2%, up from 13.3% earlier this year and vastly above the 2.3% level of 2024. For multinationals, that math introduces a meaningful drag, and for investors it raises the specter of both higher consumer prices and tighter margins.
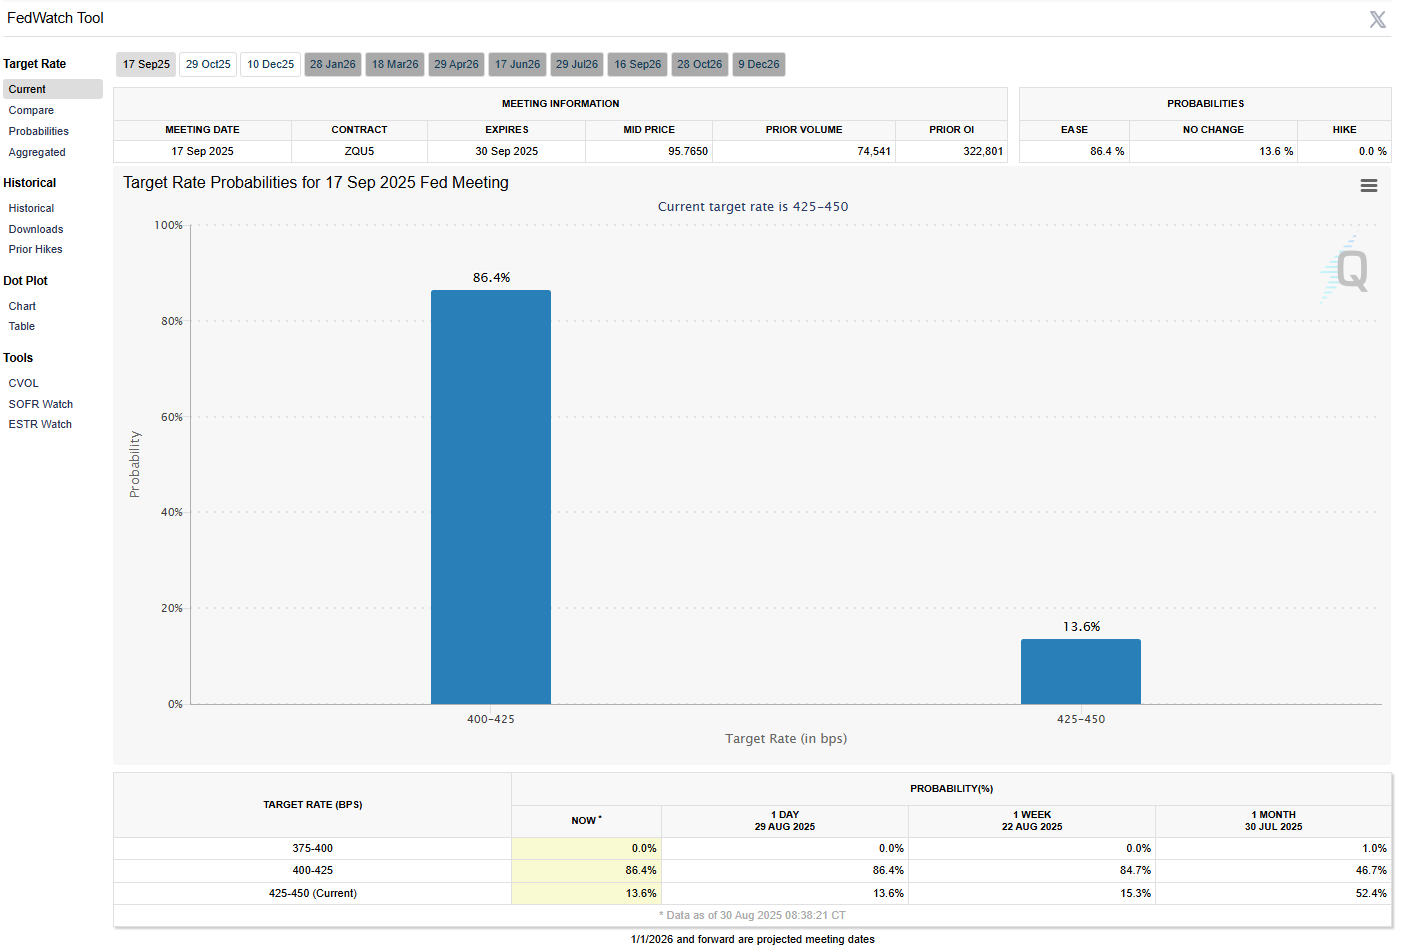
Market expectations for the Fed’s path are clear: futures now price an 88% chance of a September cut, and better than even odds of another in October. That setup creates an interesting contradiction: monetary policy is likely to ease into the teeth of a sticky inflation print. Whether the Fed is cutting because of looming weakness or as a preemptive cushion is a debate the market is still having.
Earnings, meanwhile, have surprised on the upside. Q2 S&P 500 earnings are on track to grow +9.1% year over year, far stronger than the +2.8% expected at the start of the season. With more than 95% of companies reported, 82% have beaten profit estimates. That resilience has underpinned much of the summer rally and partially explains why equity markets, despite this week’s stumbles, remain near all-time highs.
Abroad, the tone was mixed. Europe’s Euro Stoxx 50 fell -0.83% to a two-week low, pressured by higher-than-expected German CPI and weaker retail sales. Japan’s Nikkei slid -0.26%. China was a rare bright spot, with the Shanghai Composite gaining +0.37%, as domestic stimulus chatter continues to buoy sentiment.
Bond markets weren’t immune to the week’s shifting tides. The 10-year Treasury yield rose +2.4 basis points to 4.227% as core PCE’s uptick reverberated. German bund yields followed suit, climbing nearly three basis points after August CPI surprised to the upside. Even so, the dovish tones from Waller and Daly helped limit the selloff, and U.S. yields remain capped compared to earlier summer peaks.
On the corporate front, semiconductors carried the weight of disappointment, but they weren’t alone. Dell’s shortfall dragged the hardware group lower, while Caterpillar warned of tariff headwinds totaling as much as $1.8 billion this year, sending its stock down more than -3%. Ulta Beauty slipped -7% despite decent sales, as management hinted at consumer fatigue. Dollar General warned of higher SG&A costs ahead. On the positive side, Autodesk surged +9% on strong Q2 revenue, Ambarella jumped +16% after smashing EPS forecasts and raising growth guidance, and Affirm vaulted +10% on a big revenue beat. Healthcare insurers were firm, with UnitedHealth, Molina, and Elevance each up solidly, cushioning the Dow.
Cryptocurrency-linked equities added a sour note as Bitcoin dropped more than -3% to a seven-week low. Coinbase and Galaxy Digital both traded lower, underscoring the fragility of sentiment in high-beta corners of the market.
How I’m Synthesizing It (Without Overreaching)
The summer rally has not unraveled, but its complexion is changing. We are transitioning from a phase defined by AI exuberance to one where the sustainability of that theme is being tested. The Marvell and Dell misses illustrate that the buildout is real but not linear, and the market is increasingly sensitive to any signs of deceleration. At the same time, macro data is flashing a familiar tension: inflation is sticky, growth is softening, and the Fed is leaning dovish. Tariffs complicate the picture further by injecting policy risk into supply chains and corporate margins. Put together, it paints a market that is still constructive but facing a more complex set of crosscurrents than the straight-up trajectory of early summer.
What Would Change My Mind (Signals to Watch Next)
Two things matter most in the near term. First, whether inflation expectations continue to drift lower. The University of Michigan’s downtick in long-run expectations offers a reprieve, but that must be sustained for the Fed to cut with confidence. Second, the earnings revision trend. Q2 has been strong, but if guidance weakens into Q3 while input costs rise from tariffs and wages, the market will struggle to justify current multiples. On the technical side, breadth measures will be critical—if the rally fails to broaden beyond mega-cap tech, pullbacks risk turning into something larger.
Bottom Line (and a Positioning Sketch, Not Advice)
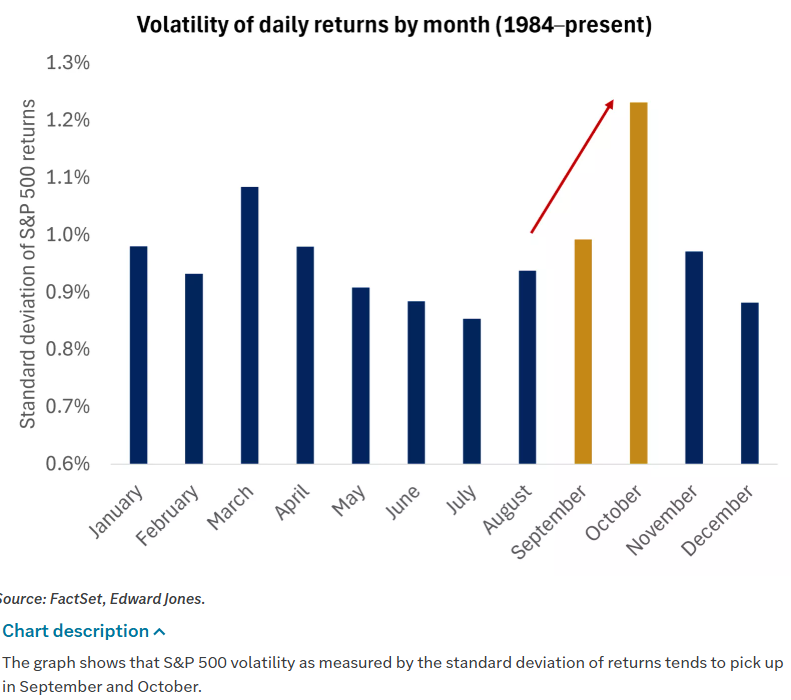
This remains a buy-the-dip market, but with caveats. The tape is shifting from momentum-led to more selective, and that transition is rarely smooth. Traders should respect the possibility of September volatility, particularly with seasonality working against them and policy risk front and center.
For longer-term investors, the resilience of earnings and the Fed’s clear dovish tilt still anchor a constructive outlook, but one that demands selectivity—rotating into sectors with earnings momentum, defensives cushioned by policy easing, and perhaps cyclicals that benefit from lower rates. In other words, the playbook has evolved from chasing what worked in June and July to identifying where the next leadership might quietly be forming.

Weekly Benchmark Breakdown
The index-level story this week was less about raw performance and more about what lay beneath the surface. On the charts, all four of the major benchmarks – the S&P 500, Dow Industrials, Nasdaq 100, and Russell 1000 – showed a powerful rebound into Friday, powered by Powell’s dovish tilt at Jackson Hole. But when we peel back the layers, we see a market that’s diverging in structure: breadth is improving, but leadership remains uneven.
S&P 500 – A Fragile Majority
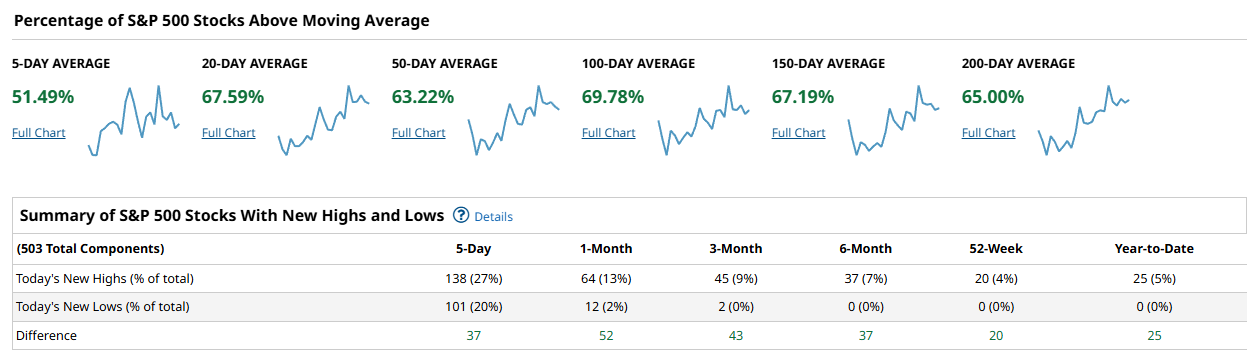
For the broad market, the S&P 500 finished the week with just over 51% of constituents above their 5-day moving average. That’s a slim majority, and it speaks to how lopsided participation has been — but extend the timeframe out and the picture brightens: 67–70% of names now sit above their 100-day and 150-day averages. The takeaway: the index is healthier than it felt during the midweek chop, and the surge in new highs (138 this week, or 27% of the index) versus new lows (101) confirms that buyers are back in control. Still, that margin isn’t wide enough to declare a runaway bull leg. It’s constructive, but fragile.
Industrials – Quiet Leadership
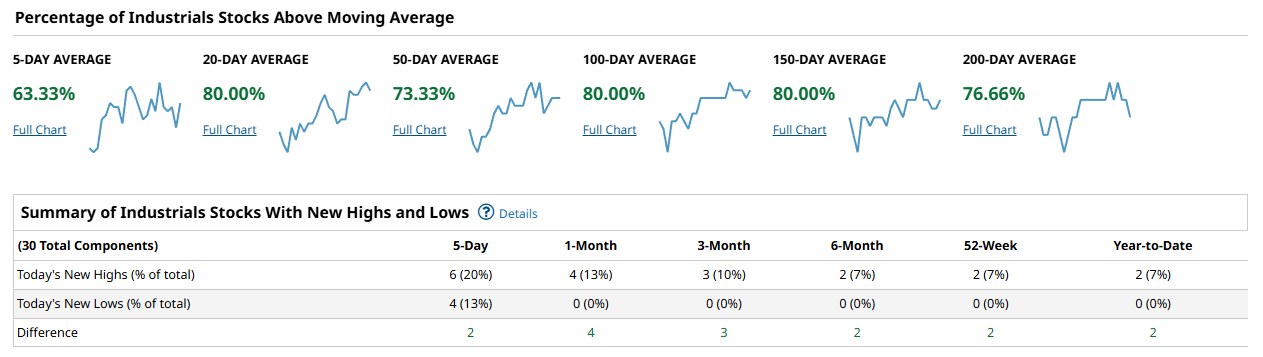
The Industrials sector quietly put up one of the strongest breadth showings: 80% of the group sits above its 100-day average, and new highs outnumbered new lows by a margin of 2-to-1 this week. It’s not a flashy sector, but this kind of broad participation matters. When Industrials outperform, it’s usually a signal that investors are leaning into cyclical exposure and expecting activity to accelerate. The catch: it’s a narrow group, only 30 names, so leadership here has to be paired with confirmation elsewhere to matter at scale.
Nasdaq 100 – Still Carrying a Hangover
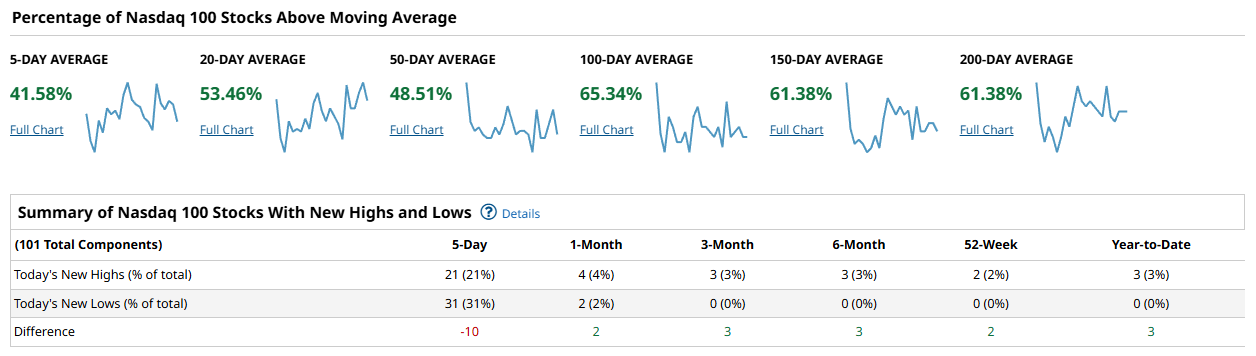
The Nasdaq 100 remains the weak link. Only 41% of names are above their 5-day moving average, and even at the 50-day level, participation is stuck below 50%. In fact, over the past five sessions the index saw more new lows (31) than new highs (21). That’s not a catastrophic breakdown, but it’s a clear sign that mega-cap tech hasn’t fully shaken off profit-taking pressure. Friday’s rally helped, but until breadth catches up, the Nasdaq remains the most vulnerable of the big four.
Russell 1000 – A Telltale Rotation
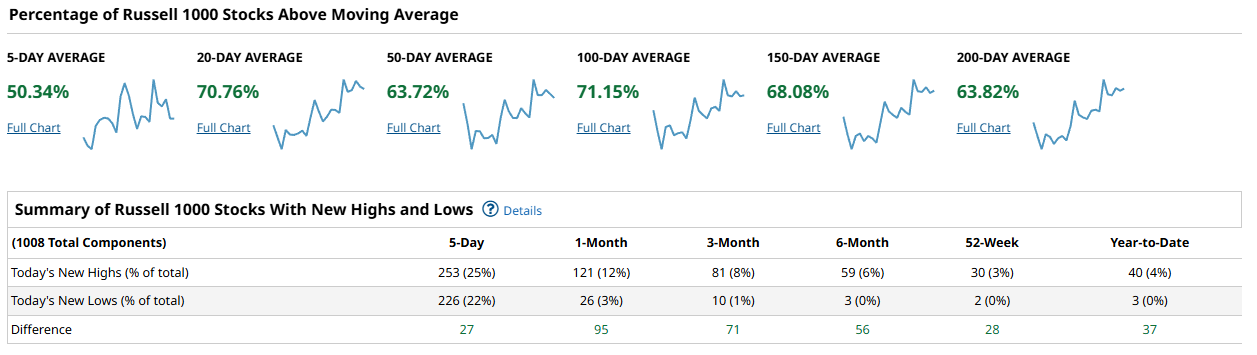
The Russell 1000 told a more balanced story. Participation across timeframes is broadly positive, with 70% of names now above their 20-day average and 71% above their 100-day average. The bigger signal came from the new highs/new lows ratio: 253 names printed fresh 5-day highs versus 226 lows, a spread of +27. It’s a modest cushion, but the important point is that buyers are rotating beyond the same few leaders — a sign of a healthier tape. If this persists, it could spell a more durable foundation for the broader rally, especially if small- and mid-caps join in.
How I’m Putting It All Together
Breadth is improving across most benchmarks, but the distribution of leadership is uneven. The S&P shows constructive participation but not runaway strength; Industrials are offering cyclical confirmation; the Nasdaq remains shaky; and the Russell suggests rotation into a broader set of names. Put together, it’s a market that is trying to base and broaden — not melt-up.
If Nasdaq breadth fails to recover — or worse, deteriorates further — it would call into question whether this rally has real legs. Conversely, if the Russell’s improvement extends into small-cap leadership, that would be a major green light for risk. Watch the new highs/new lows spread closely in the coming sessions; it’s the cleanest real-time check on whether participation is expanding or stalling.
Powell’s dovish lean gave equities a shot of adrenaline, but the internals are still mending. A cautious constructive stance is warranted: bullish momentum is visible in Industrials and the Russell, but the Nasdaq needs to stabilize before the rally can be considered robust. For now, dips in cyclicals and breadth-supported sectors look buyable, while tech deserves a shorter leash.
US Investor Sentiment Report
Insider Trading
Insider trading occurs when a company’s leaders or major shareholders trade stock based on non-public information. Tracking these trades can reveal insider expectations about the company’s future. For example, large purchases before an earnings report or drug trial results might indicate confidence in upcoming good news.
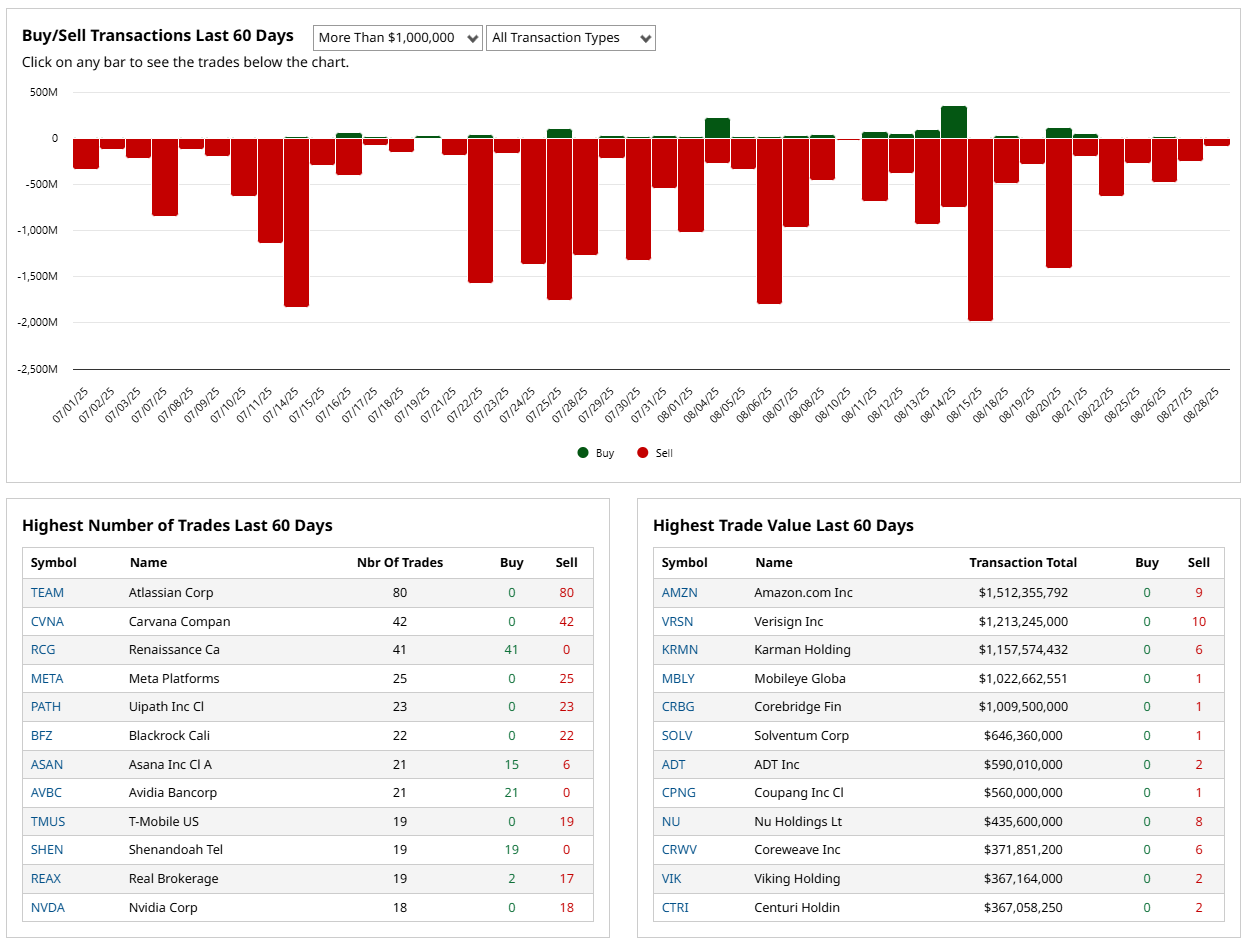
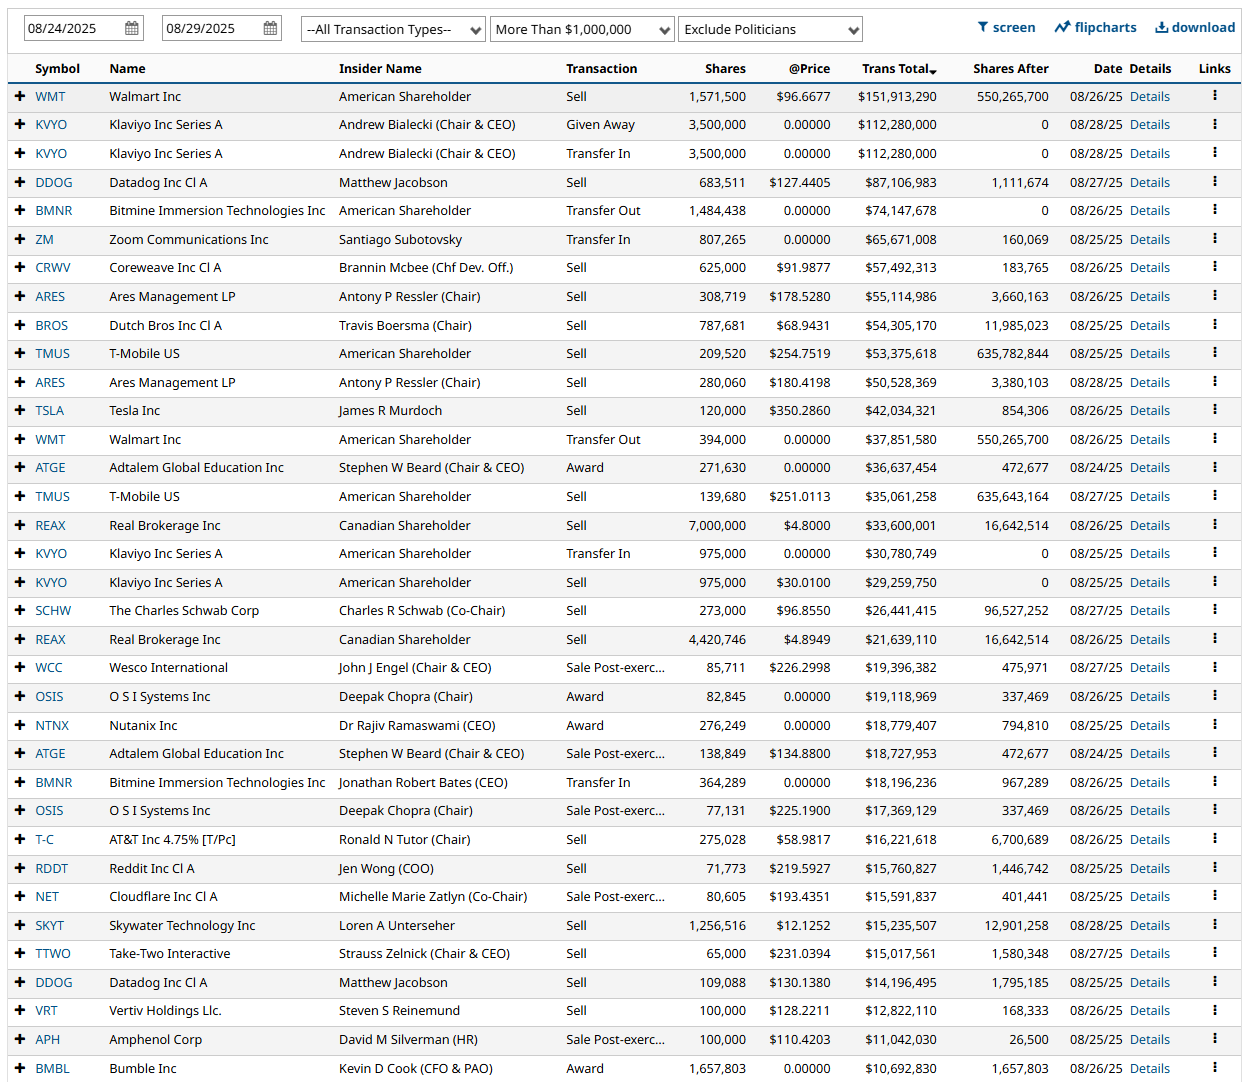
Insiders have been steady net sellers. Over the past two months, the tape has been dominated by red bars — waves of billion-dollar disposals punctuated by only token buying. Atlassian, Meta, and Carvana all saw heavy selling with no offsetting purchases, while Amazon insiders alone unloaded more than $1.5 billion. Even in the latest week, Walmart, Tesla, and Ares Management boards were reducing stakes.
The message is straightforward: those closest to the balance sheets are taking advantage of the rally to lighten up. Whether it’s tax planning or a valuation call, insider activity has a distinctly defensive tone — one worth noting as the broader market chases Powell’s dovish pivot.
%Bull-Bear Spread
The %Bull-Bear Spread measures the gap between bullish and bearish investor sentiment, often from surveys like AAII. It’s a contrarian indicator—extreme optimism may signal a coming pullback, while extreme pessimism can hint at a potential rally. Large positive or negative spreads often mark market turning points.
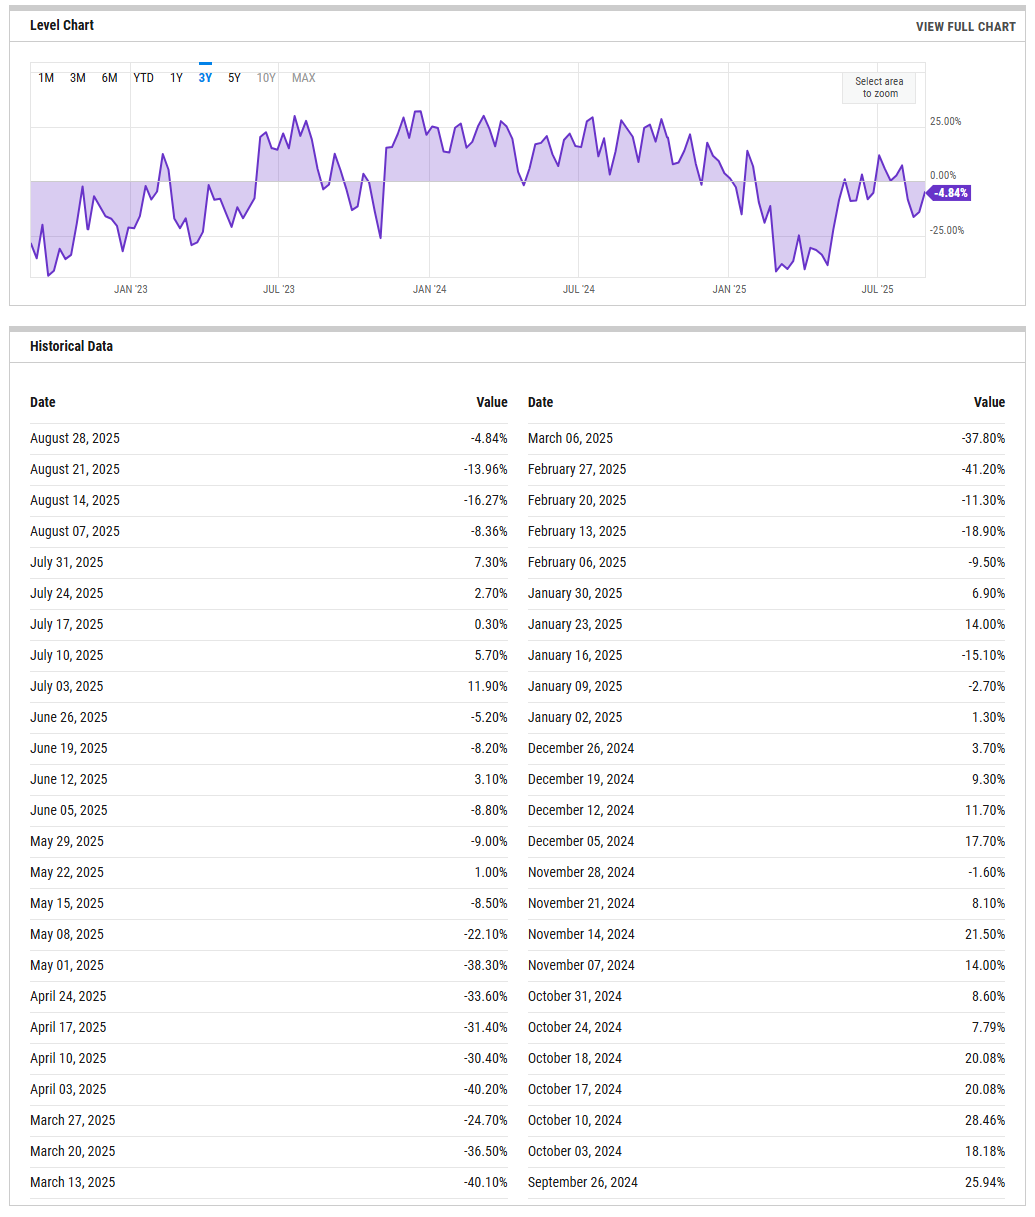
The bull–bear spread is still sitting in negative territory at –4.8%, marking a modest retreat from the less bearish readings of mid-July but well off the panic extremes seen earlier this year (–30% to –40%). In plain terms, sentiment is cautious but no longer washed out.
That positioning matters: when spreads were deeply negative in March and April, equities were carving out durable lows. Now, with Powell opening the door to rate cuts, the risk is that the contrarian juice is largely spent. Bears are backing off, but bulls haven’t seized control either — a middle ground that usually leaves markets more sensitive to incoming data and headline risk.
NAAIM Exposure Index
The NAAIM Exposure Index (National Association of Active Investment Managers Exposure Index) measures the average exposure to U.S. equity markets as reported by its member firms. These are typically active money managers who provide their equity exposure levels weekly. The index offers insight into how much these managers are investing in equities at any given time, ranging from being fully short (-100%) to leveraged long (up to +200%).
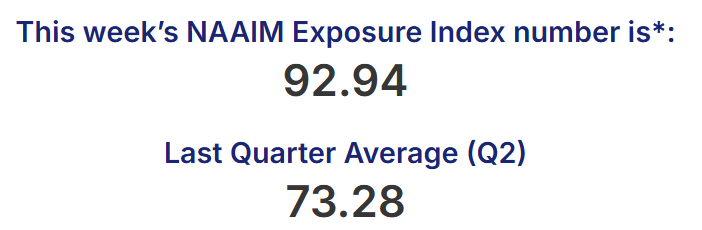
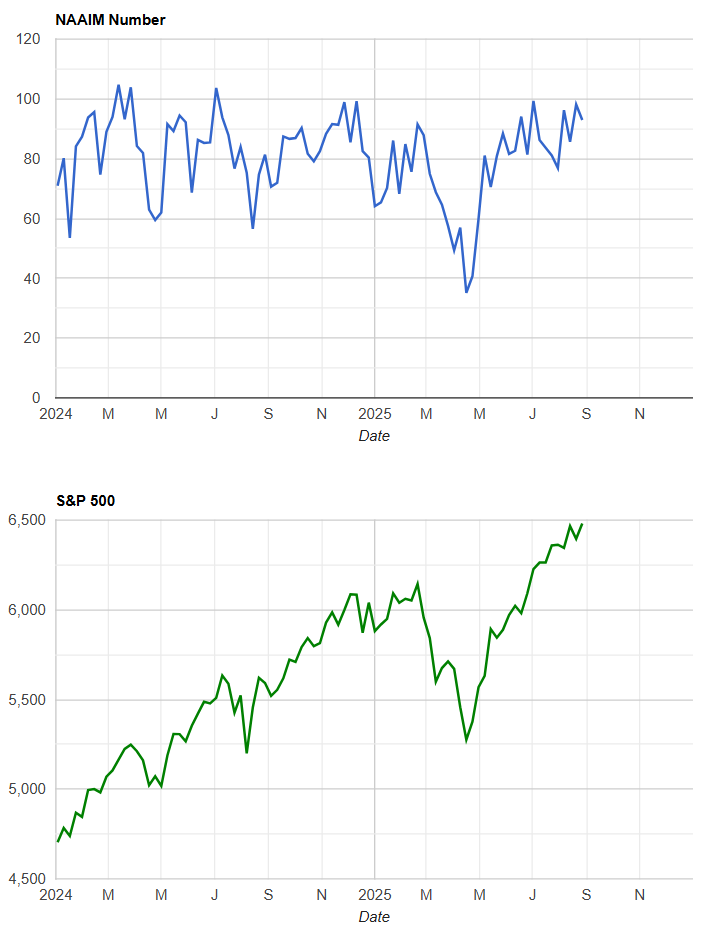
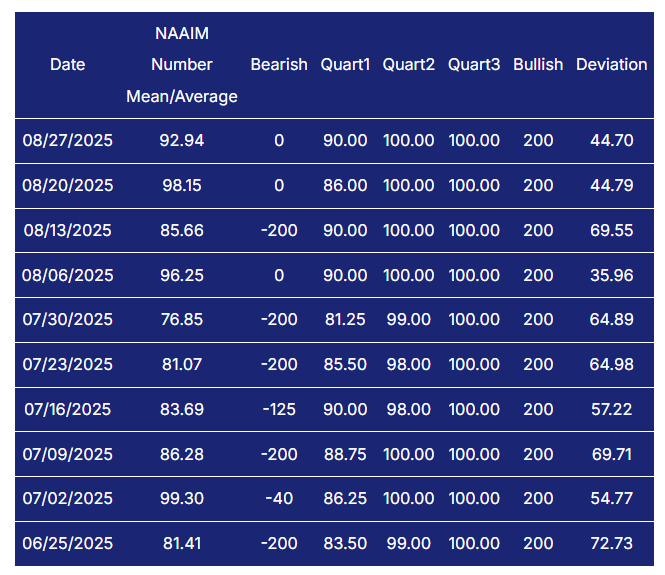
The NAAIM Exposure Index surged to 92.9 this week, up from a quarterly average of 73.3, and sitting just shy of the year’s prior highs. That means active managers are running portfolios at nearly full exposure to equities.
The last three weeks tell the story: positioning spiked to 98.2 on August 20, eased slightly, and then ramped back toward the ceiling. That’s not timid buying — it’s conviction. Importantly, the dispersion of responses (from heavily bearish to max long) has narrowed, which suggests the field is crowded on the bullish side.
Technicians know this backdrop cuts both ways. High NAAIM readings often accompany strong uptrends — which we clearly have — but they also reduce the margin for error. With the S&P 500 grinding to new highs, Powell dangling a rate cut, and breadth improving under the surface, managers have piled in. The contrarian take: when exposure runs this hot, any disappointment in data next month could force de-risking.
CBOE Total Put/Call Ratio
CBOE's total put/call ratio includes index options and equity options. It's a popular indicator for market sentiment. A high put/call ratio suggests that the market is overly bearish and stocks might rebound. A low put/call ratio suggests that market exuberance could result in a sharp fall.
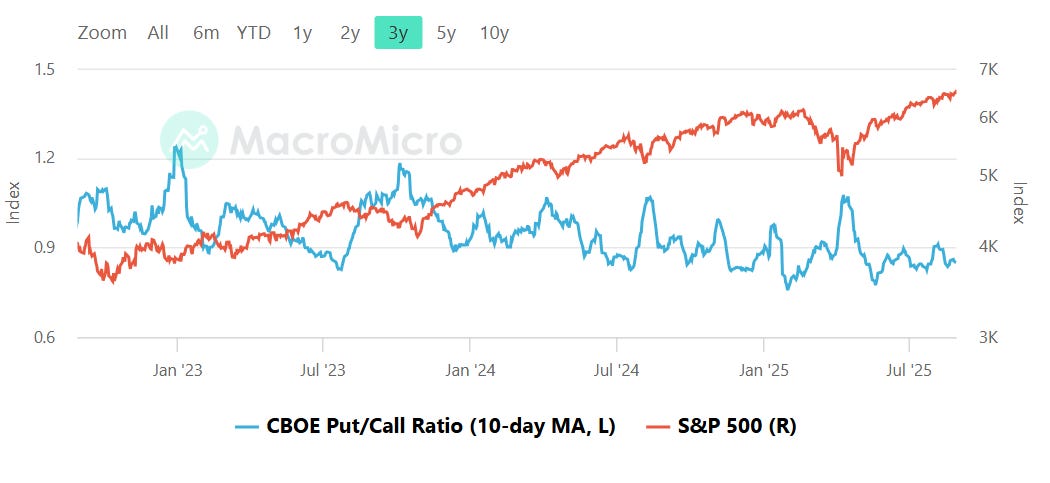
The CBOE put/call ratio (10-day MA) continues to hug the low end of its three-year range, sitting well below 1.0 even after brief upticks earlier this summer. That tells us hedging demand remains muted while speculative call buying dominates — classic late-stage bull market behavior.
Overlaying it with the S&P 500 makes the message clearer: whenever the ratio drifts this low for a sustained stretch, it typically coincides with elevated equity prices and crowded optimism. The last time we saw a similar setup was mid-2021 and again in late-2023 — both periods preceded either a sharp pullback or at least a sideways digestion phase.
Right now, the takeaway is less about imminent collapse and more about recognizing sentiment excess. With Powell opening the door to cuts, managers running nearly full long exposure (NAAIM ~93), and insider selling ticking higher, the low put/call ratio is another sign that positioning is stretched. It doesn’t kill the trend, but it narrows the runway for upside without a reset.
Equity vs Bond Volatility
The Merrill Lynch Option Volatility Estimate [MOVE] Index from BofAML and the CBOE Volatility Index [VIX] respectively represent market volatility of U.S. Treasury futures and the S&P 500 index. They typically move in tandem but when they diverge, an opportunity can emerge from one having to “catch-up” to the other.
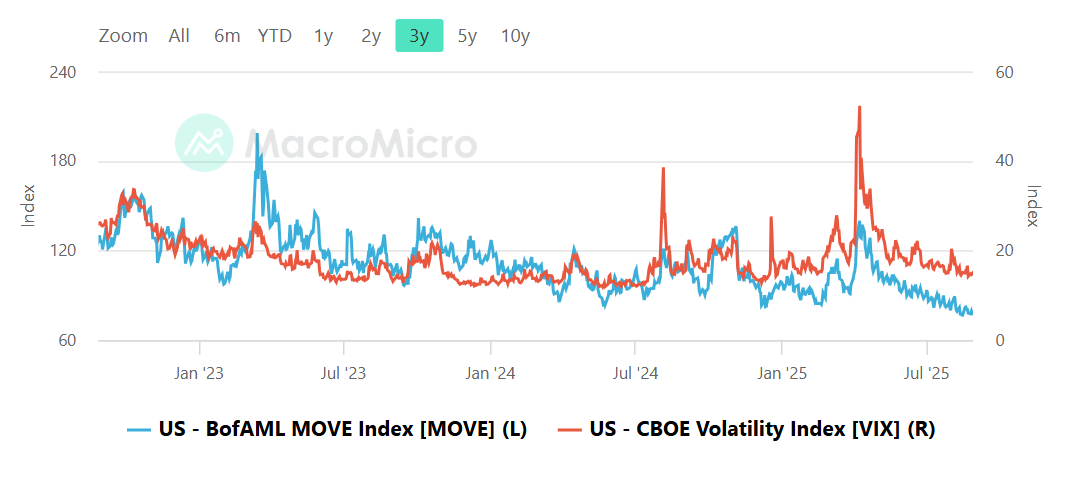
The equity vs. bond volatility spread is flashing a familiar divergence.
On one side, the VIX (red, equities) has cooled back toward the mid-teens, suggesting stock investors are relaxed, if not complacent, after Powell’s dovish lean. On the other, the MOVE index (blue, bonds) has ground steadily lower but remains well above pre-2022 norms, a reminder that rates markets are still digesting persistent crosscurrents in inflation, growth, and policy.
Historically, when the MOVE runs rich relative to the VIX, it implies equity markets are underpricing risk. We’ve seen this movie before: October ’23 and March ’24 both featured wide spreads that preceded sharp equity drawdowns as bond volatility proved the truer signal.
Right now, the spread tells us two things:
Equities are leaning heavily on the “soft landing plus Fed cut” story. Positioning and sentiment confirm this.
Bonds aren’t quite buying it. Even with Powell’s nod, term premium and supply concerns keep rate volatility sticky.
That leaves equities vulnerable if bonds prove right again. This isn’t a timing tool, but it’s a setup worth flagging: when one asset class is relaxed and the other still nervous, the nervous side usually wins.
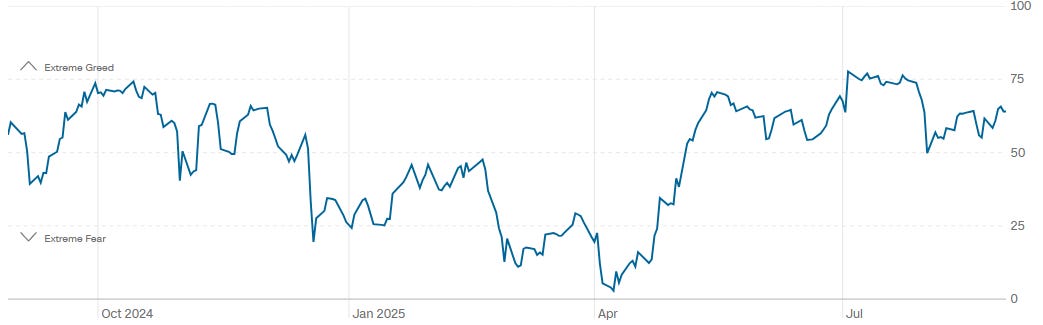
CNN Fear & Greed Constituent Data Points & Composite Index
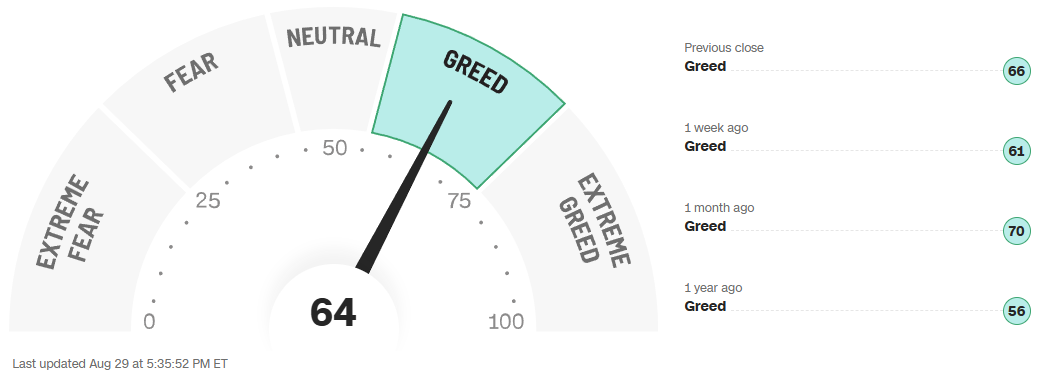
The CNN Fear & Greed Index is sitting at 64 (Greed), basically unchanged from last week’s 61 and slightly softer than a month ago when it touched 70. The year-over-year shift is notable: last August, the reading was 56, still in Greed but far more restrained than today. In other words, investors are more comfortable chasing risk than they were a year ago, but they haven’t tipped into the kind of runaway “Extreme Greed” that usually precedes near-term pullbacks.
Looking at the rolling history, the index has spent most of the summer above 60, suggesting sentiment has been steadily optimistic since the post-spring rally. We did see a wobble in late July when tariff headlines and labor revisions spiked volatility, but Powell’s dovish lean at Jackson Hole seems to have quickly restored animal spirits.
The takeaway is that risk appetite remains firm—investors are leaning into the Fed pivot narrative, hunting for upside in cyclicals and laggards, not just crowding into megacaps. But sentiment is not at euphoric extremes, which leaves room for the tape to run further before contrarian signals start flashing red.
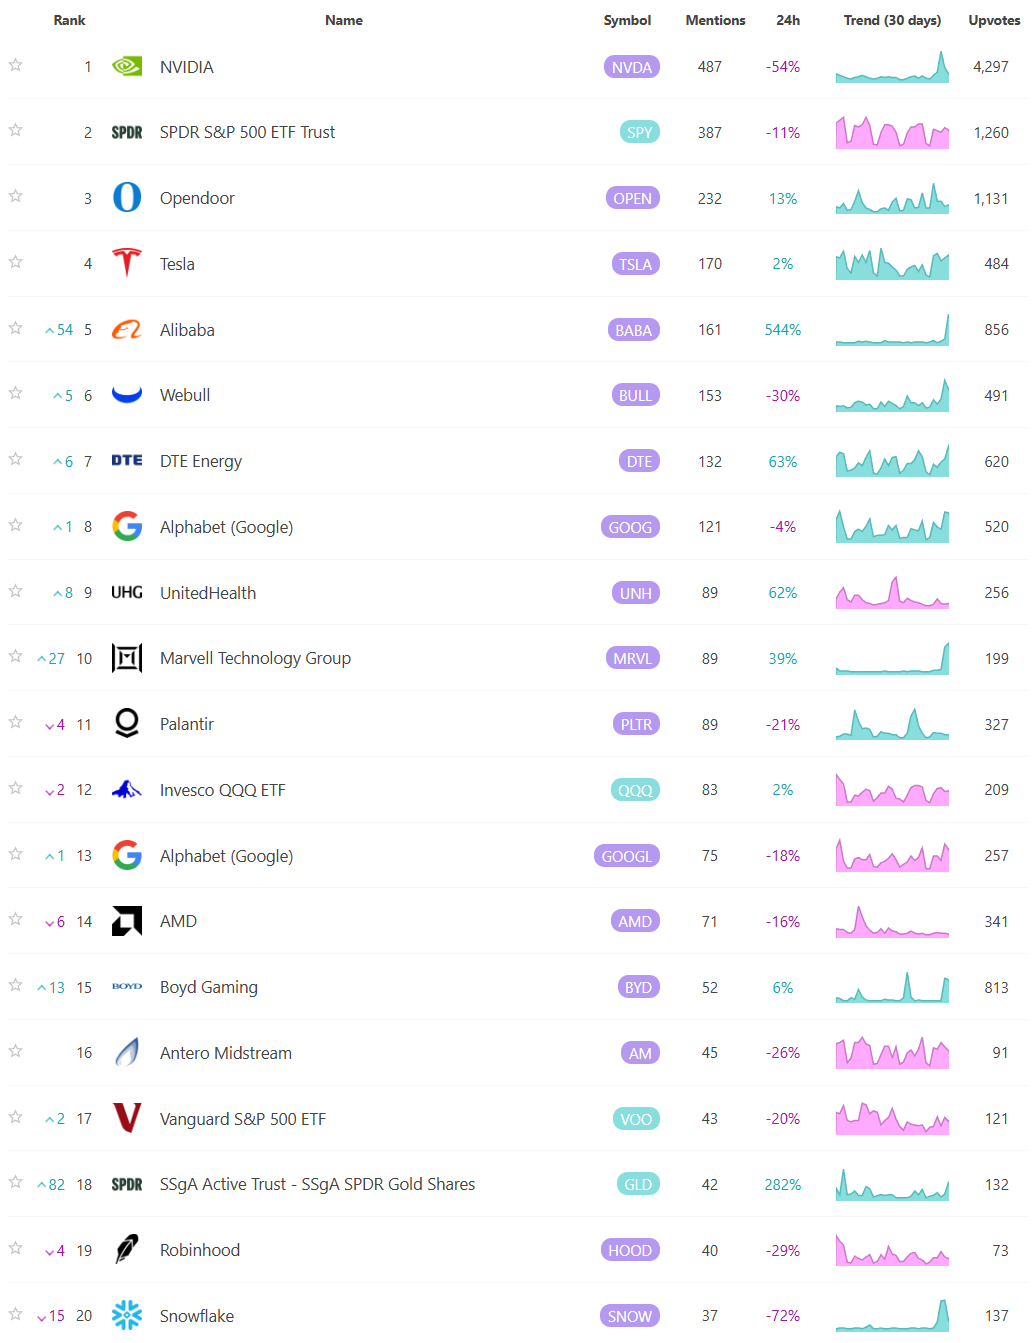
Social Media Favs
Social sentiment offers a real-time view of investor mood, often revealing market shifts before traditional indicators. It can signal momentum changes, spot emerging trends, and gauge retail investor impact—especially in high-volatility names. Tracking sentiment around events or earnings provides actionable insights, and when layered with quantitative models, can enhance predictive accuracy and risk management. Sustained sentiment trends often mirror broader market cycles, making this data a valuable tool for both short-term trades and long-term positioning.
Institutional S/R Levels for Major Indices
When you’re a large institutional player, your primary goal is to find liquidity - places to do a ton of business with the least amount of slippage possible. VolumeLeaders.com automatically identifies and visually plots the exact spots where institutions are doing business and where they are likely to return for more. It’s one of the primary reasons “support” and “resistance” concepts work and truly one of the reasons “price has memory” - take a look at the dashed lines in the images below that the platform plots for you automatically; these are the areas institutions constantly revisit to do more business.
Levels from the VolumeLeaders.com platform can help you formulate trades theses about:
Where to add or take profit
Where to de-risk or hedge
What strikes to target for options
Where to expect support or resistance
And this is just a small sample; there are countless ways to leverage this information into trades that express your views on the market. The platform covers thousands of tickers on multiple timeframes to accommodate all types of traders.
SPY
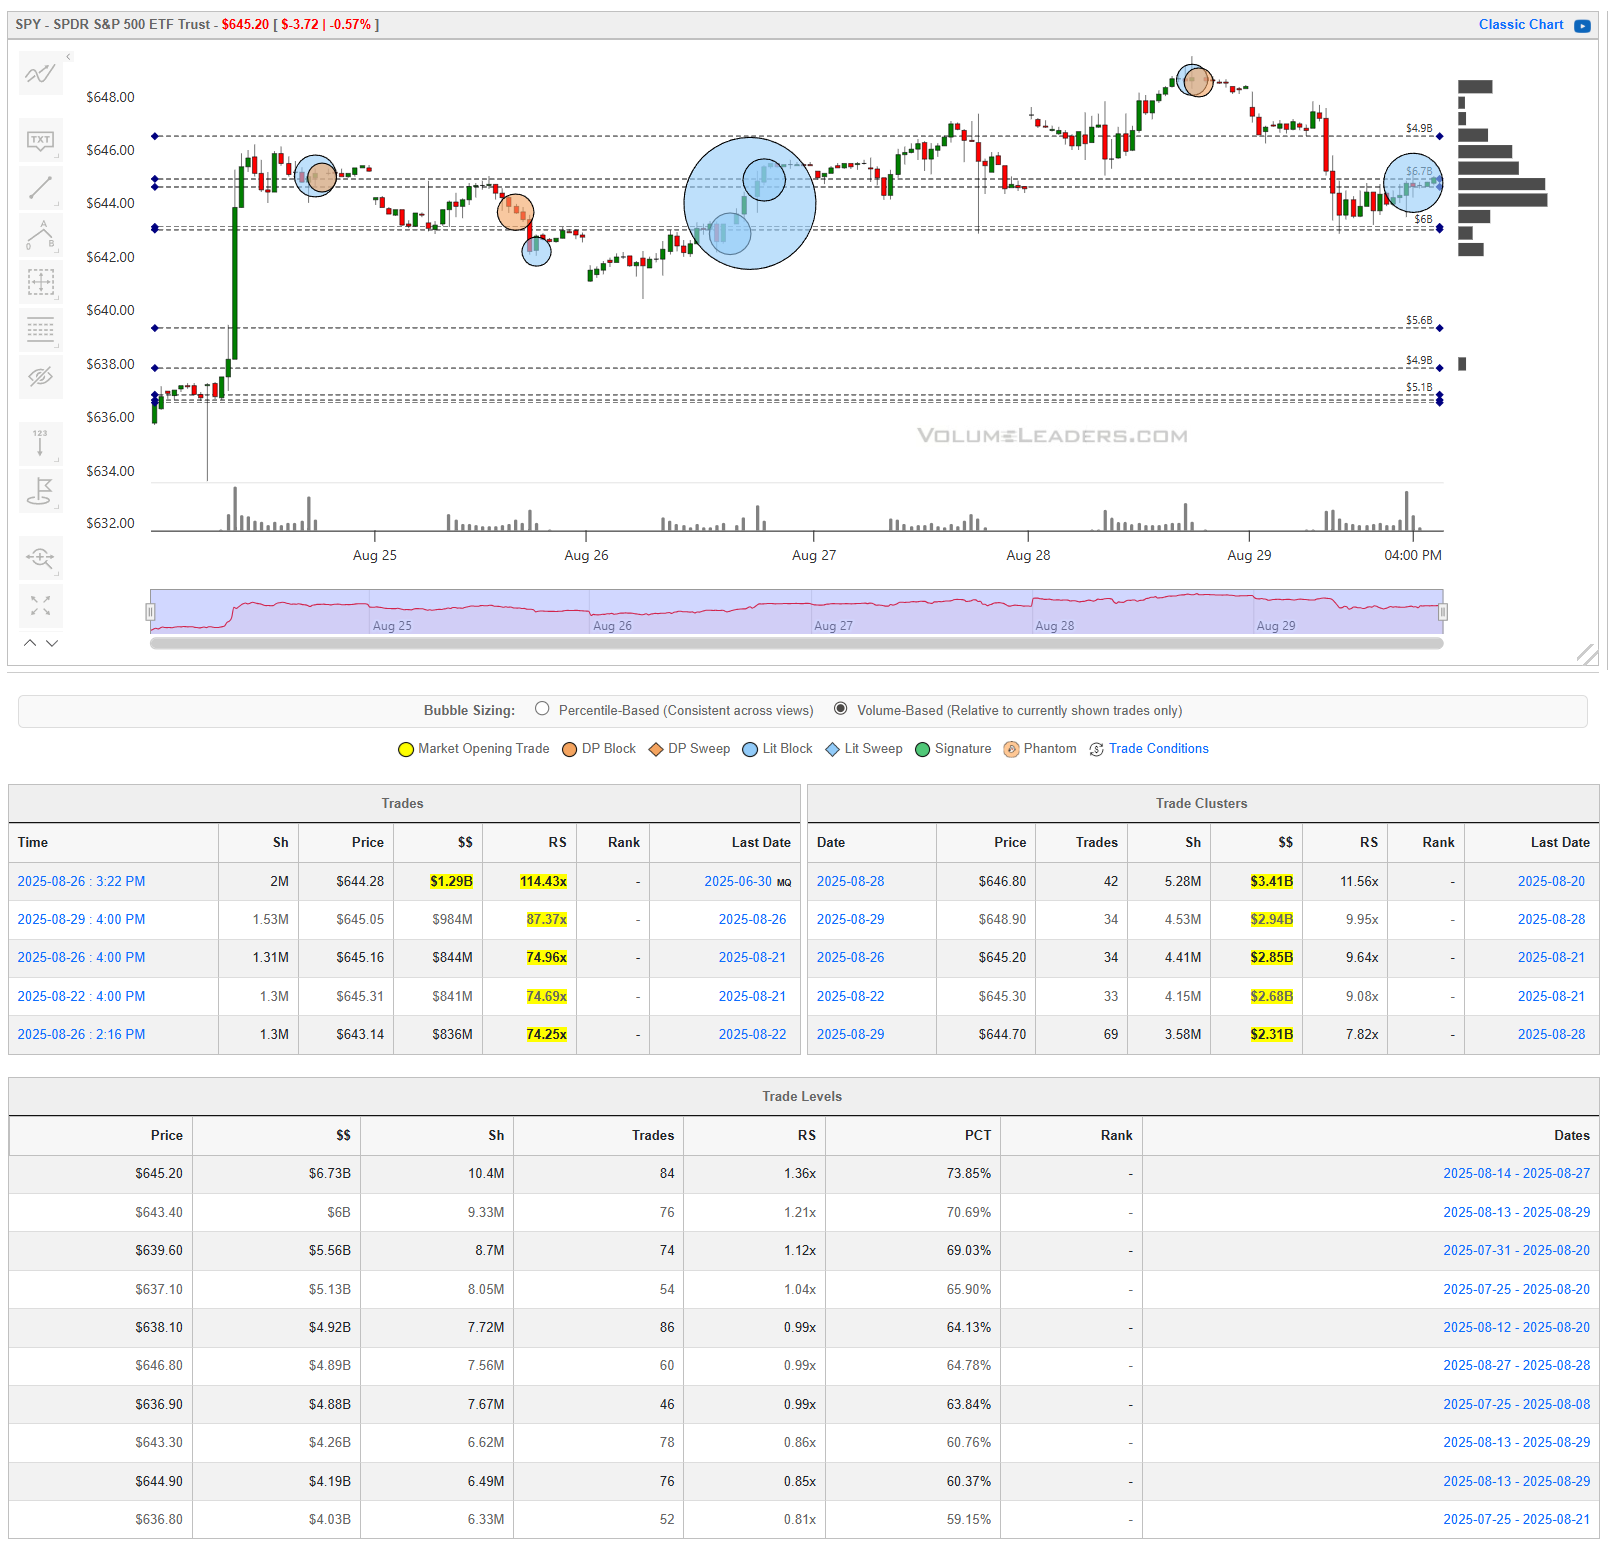
The SPY spent the past week carving out a clear institutional balance zone. The week began with a sharp gap higher into the mid-640s, immediately drawing out multi-billion-dollar blocks around $644–$646. The heaviest of these was a $1.29B print at $644.18 — a level that’s acted as a gravitational center ever since.
From there, we saw a stair-step pattern: each attempt higher met by clustered supply between $648–$650, where three separate billion-dollar trade groups hit. That area now stands as the short-term ceiling.
On the downside, $640–$641 has been the pivot zone, repeatedly absorbing tests with high-capacity buying. Beneath that, $635–$636 emerges as structural support, where $5B+ in flows changed hands — a must-hold if bulls want to keep control.
Taken together, this was not speculative chop but measured two-way positioning. Big accounts are bracketing price, laying in liquidity on both sides of Powell’s Jackson Hole pivot and building September exposure.
Key levels from the tape:
$648–650: Supply wall, capped advances.
$644–646: Core battleground, anchored by $1.29B flow.
$640–641: Pivot, responsive demand.
$635–636: Structural support.
Until one of those edges breaks on size, SPY remains in balance — a base-building exercise before the next leg.
QQQ
The Qs opened the week with strength, gapping higher into the mid-$560s before running directly into heavy-handed institutional supply. The dominant prints came in at $571–$573 and $577, where billion-dollar blocks ($1.15B, $1.12B, and $1.11B) stacked within a two-day window. That area now stands as the capstone supply zone.
Despite multiple probes, the tape couldn’t push through. Each attempt higher bled back as sellers leaned into those clusters, leaving $577 as the week’s high-water mark.
On the downside, demand revealed itself into the $565–$566 band, where $3.6B in flow changed hands with 90%+ relative size. Beneath that, $561 is the structural shelf — a level tested late in the week with absorption that stopped the slide.
In short, QQQ is compressed between a $561 floor and a $577 ceiling, with an especially heavy concentration of supply just under the highs. The balance here feels more top-heavy than SPY: institutions were willing to defend their selling zones aggressively, while support is thinner and more price-sensitive.
Key levels from the tape:
$577–$573: Capstone supply, billion-dollar saturation.
$571: Core battle line, multiple large flows.
$565–$566: Demand zone, >90% RS prints.
$561: Structural shelf, last line before breakdown.
The read: Institutional sellers have the upper hand for now. Bulls must reclaim and hold above $573 to reset momentum; otherwise, pressure builds toward $561.
IWM
The Russell put on a show early in the week, gapping violently higher into the $234–$236 range before immediately colliding with an institutional wall. The largest single prints of the week were here: $243.48 ($232M), $236.26 ($198M), and $234.93 ($187M) — monster-sized, high-relative-size trades (20–25x). This zone is now unmistakably the ceiling supply band.
From there, IWM bled sideways, with bulls trying multiple times to push above $236 but each attempt was capped by heavy sell clusters. The mid-week trade activity instead began consolidating around $231–$233, where $319M and $356M blocks were absorbed, creating a more balanced battleground.
By Friday, flows clustered near $235–$236, smaller in size but still defensive — showing institutions continue to fade rallies into the same shelf they defended earlier.
Support-wise, demand sits lower at $229–$230, where $5.17B of flow has exchanged hands historically with a 90%+ participation rate. This is the first true structural cushion beneath spot.
Key levels from the tape:
$234–$236: Immediate and heavy supply; multiple billion-dollar cumulative prints.
$231–$233: Near-term balance zone; institutions actively probing.
$229–$230: Strong demand base, high RS, last structural shelf.
The read: IWM looks heavier than both SPY and QQQ. Small-caps ripped hard, hit a wall, and are now consolidating just under resistance. Without a decisive reclaim of $236, risk builds for a rotation back toward $229–$230.
DIA
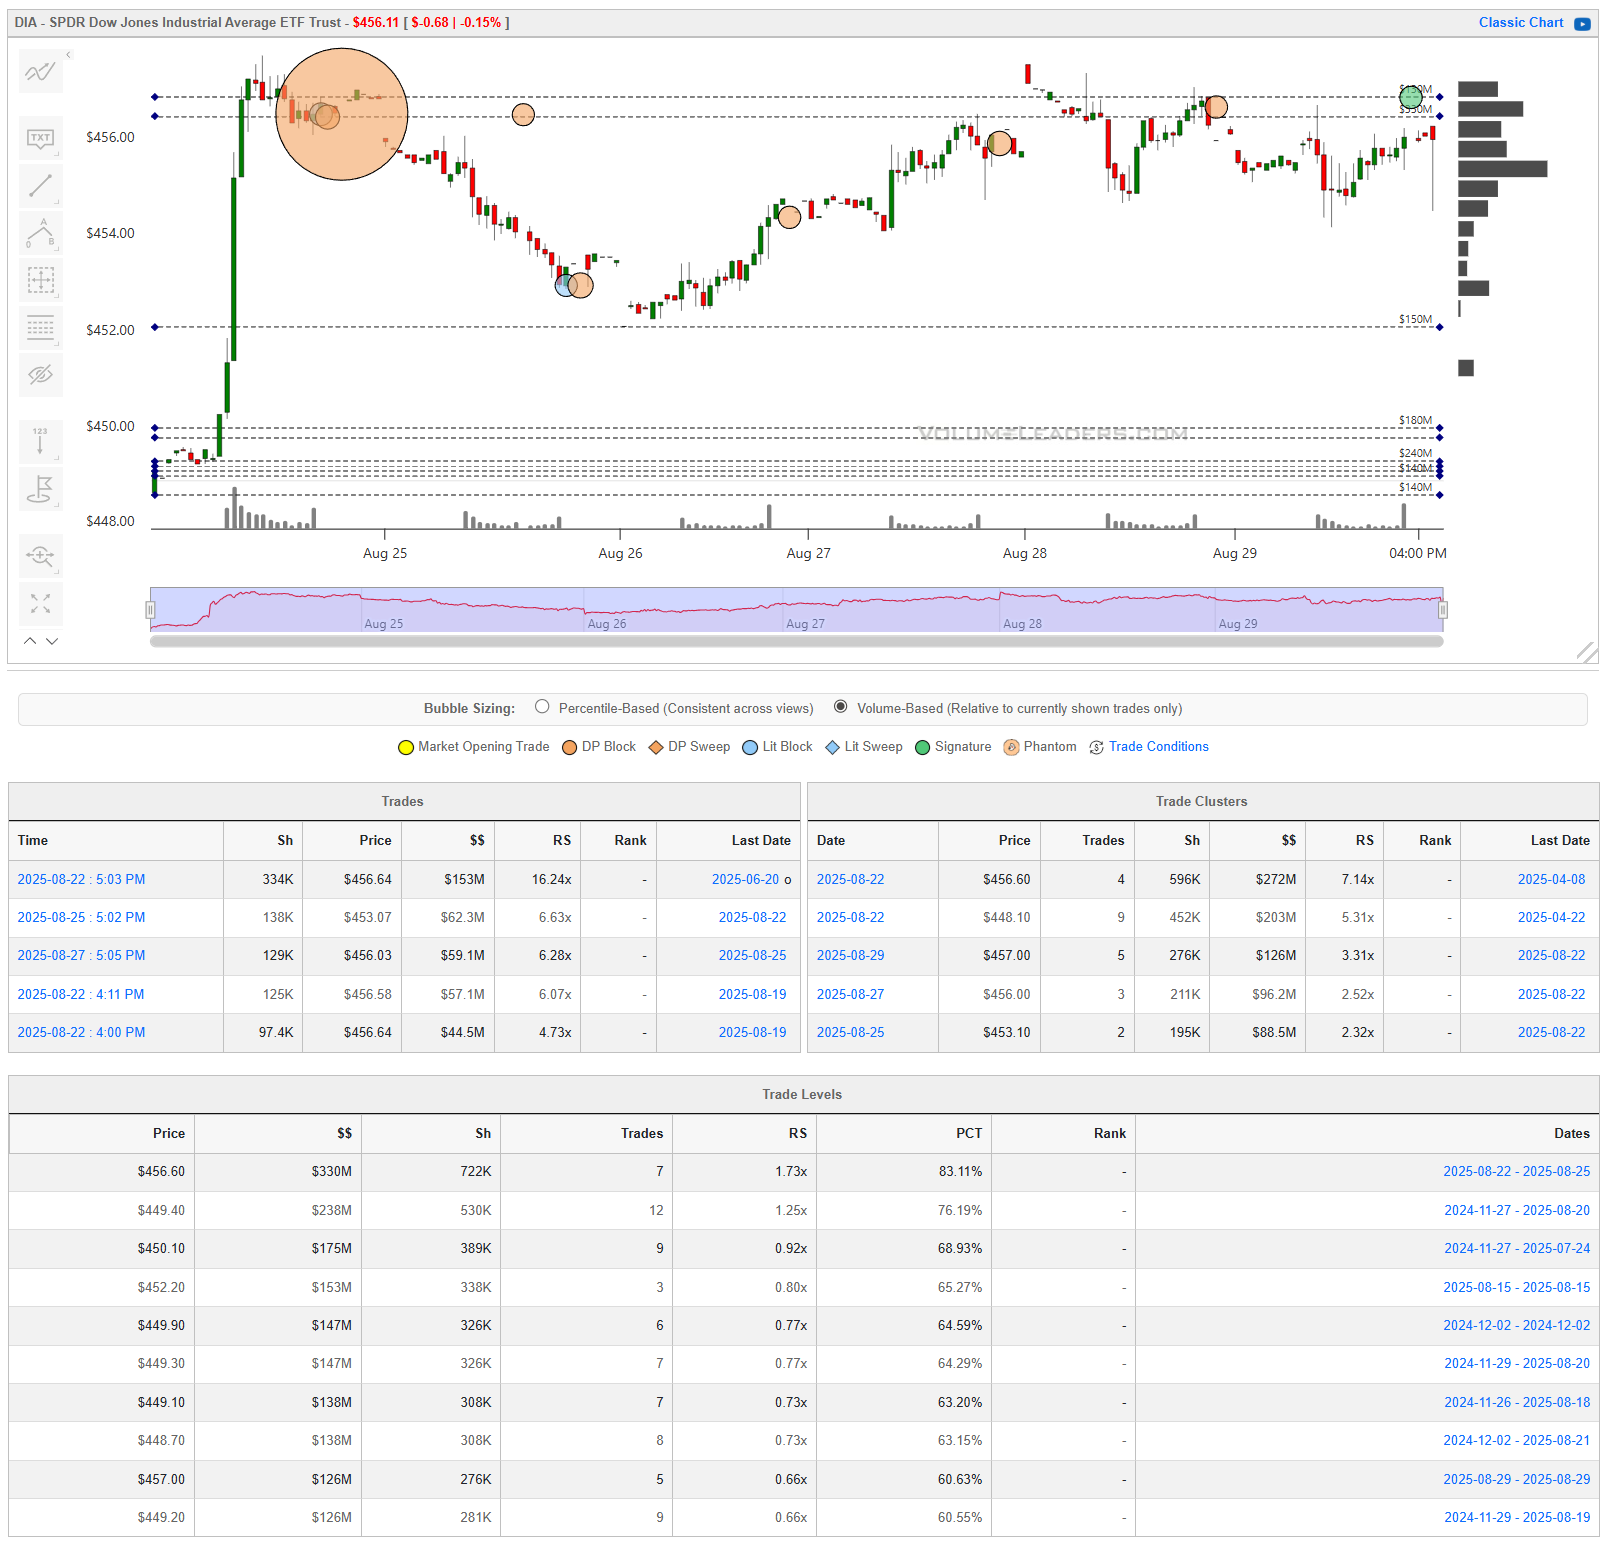
The Dow carried a different tone than SPY, QQQ, and IWM this week: less about broad distribution, more about a single dominant defense zone.
The big tell came August 22nd at $456.64, where a $155M block (16.2x relative size) hit — the largest and most outsized print of the week across the Dow tape. That trade defined the top of the range. Price immediately stalled and drifted lower through midweek, with supply layering again between $453–$454 ($44–$62M blocks, 5–7x RS).
On the way back up, bulls managed to test $456 again into Friday’s close, but volume was thinner ($272M clustered across 596k shares, RS 7.1x), suggesting resistance is still firm but not reinforced by fresh sellers of the same size as earlier in the week.
Support is visible at $449–$450, where cumulative flows ($175M+ across multiple prints) anchored earlier in August. Beneath that, $447 becomes the pivot shelf, but that’s a step lower than this week’s action.
Key levels from the tape:
$456–$457: Primary resistance, capped by the largest block of the week.
$453–$454: Secondary supply zone, still defended.
$449–$450: First support, holding firm.
$447: Structural pivot if sellers press lower.
The read: DIA looks healthier than IWM but less constructive than SPY, consolidating just under resistance but without the same distribution pressure. The market wants a clean break above $456 to open air — but until then, it’s rangebound, leaning heavy at the top.
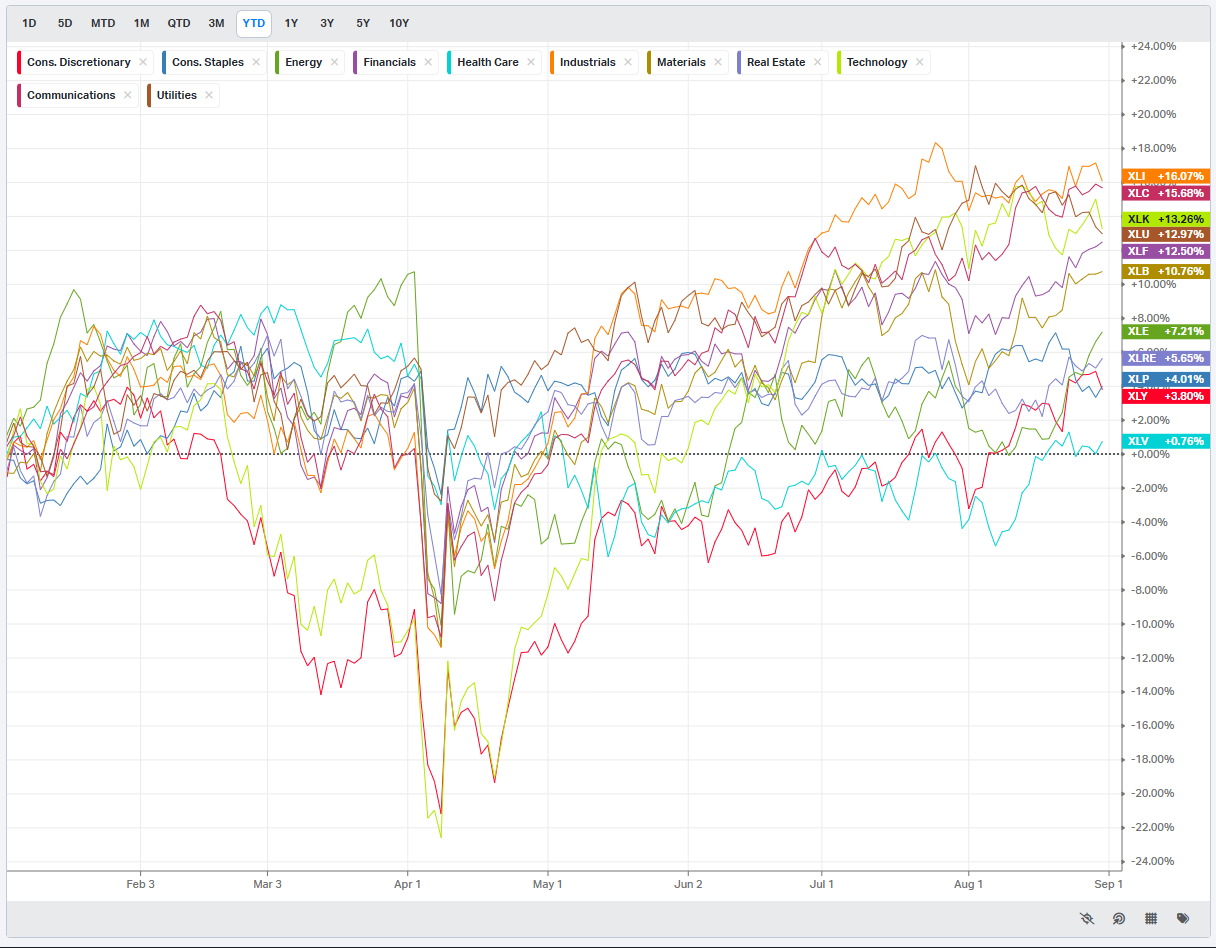
Summary Of Thematic Performance YTD
VolumeLeaders.com offers a robust set of pre-built thematic filters, allowing you to instantly explore specific market segments. These performance snapshots are provided purely for context and inspiration—think about zeroing in on the leaders and laggards within the strongest and weakest sectors, for example.
S&P By Sector
S&P By Industry
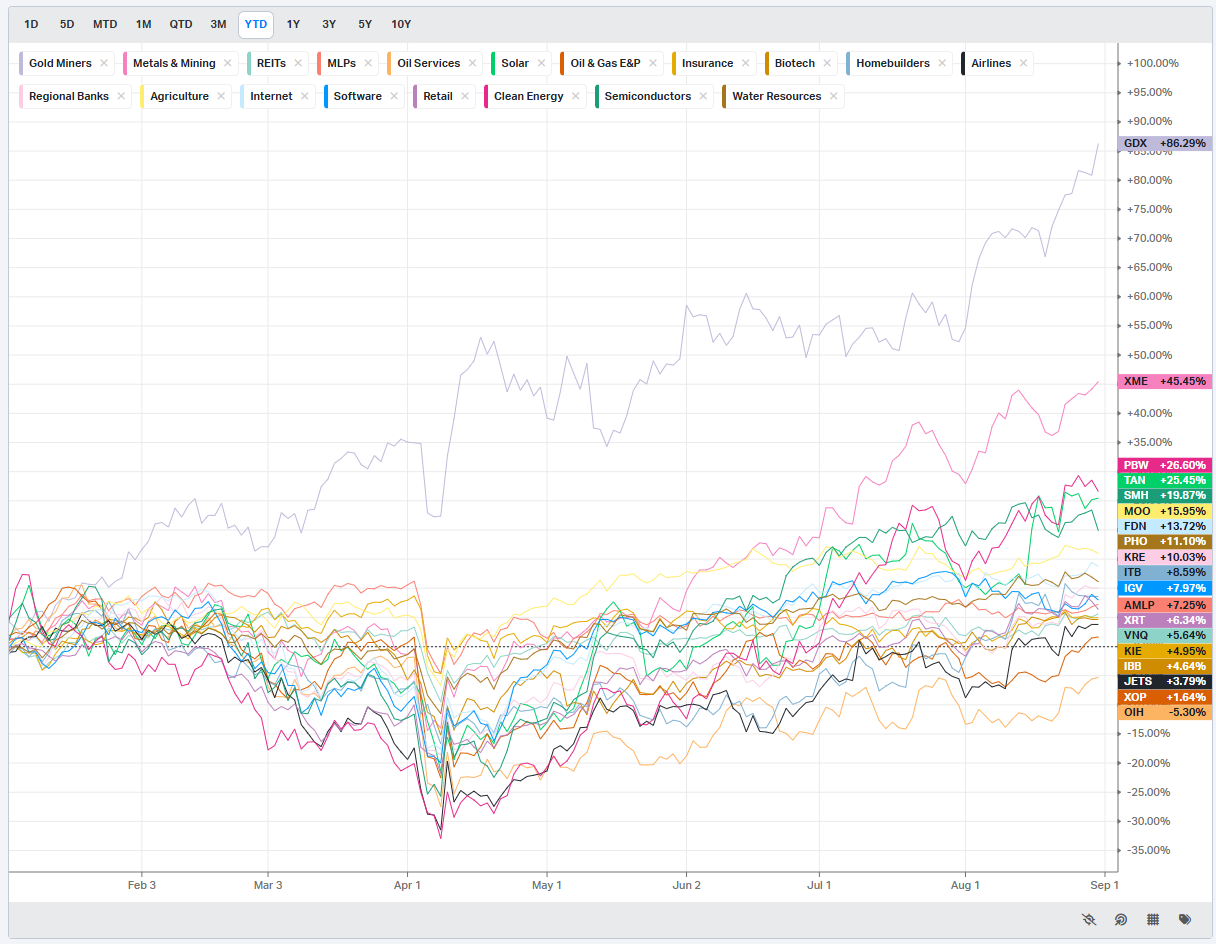
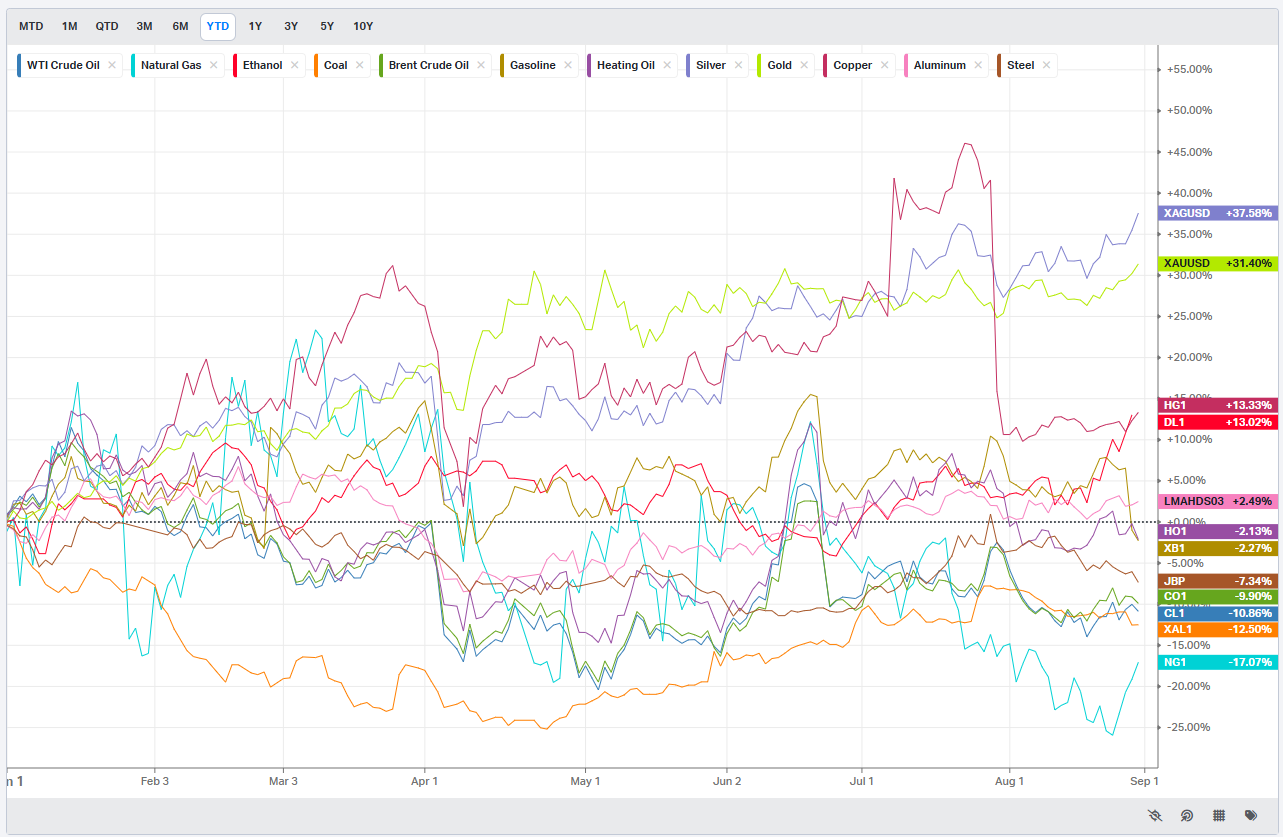
Commodities: Energy & Metals
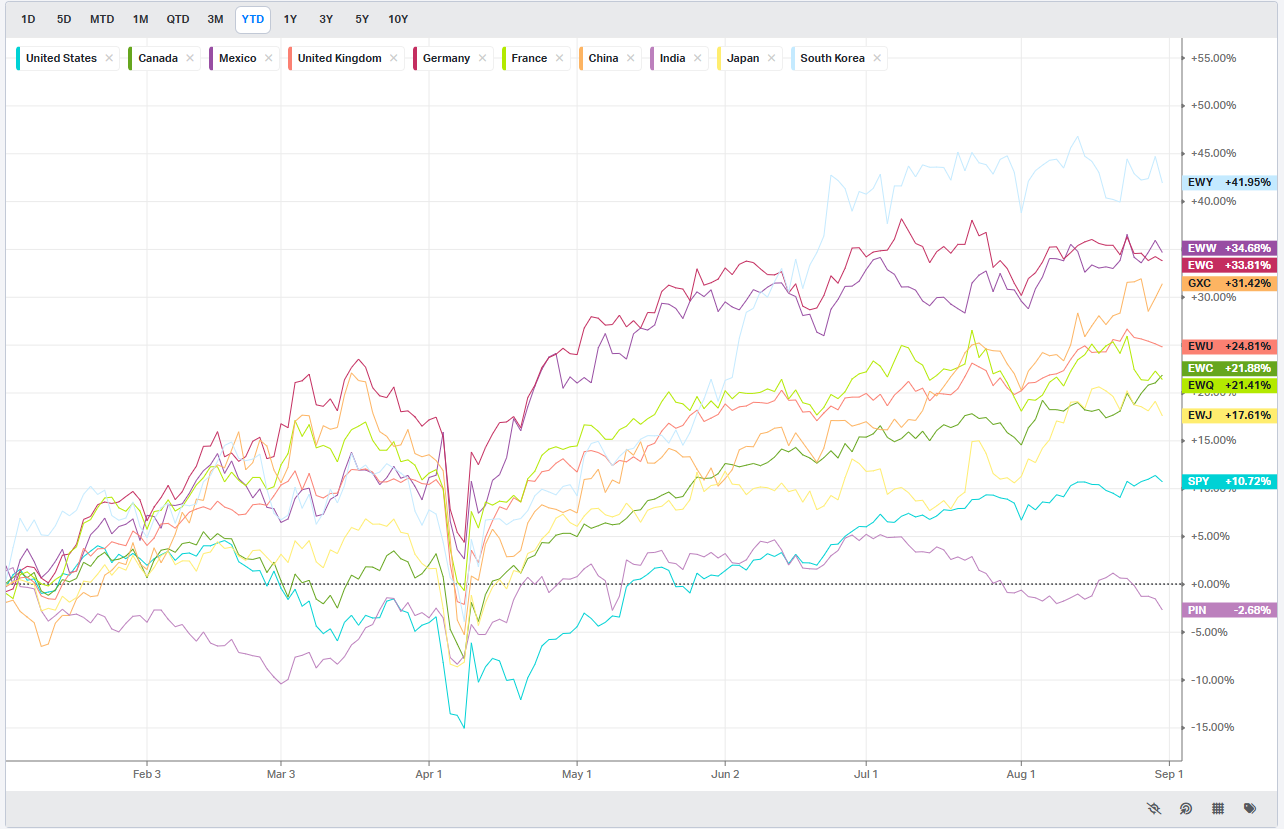
Country ETFs
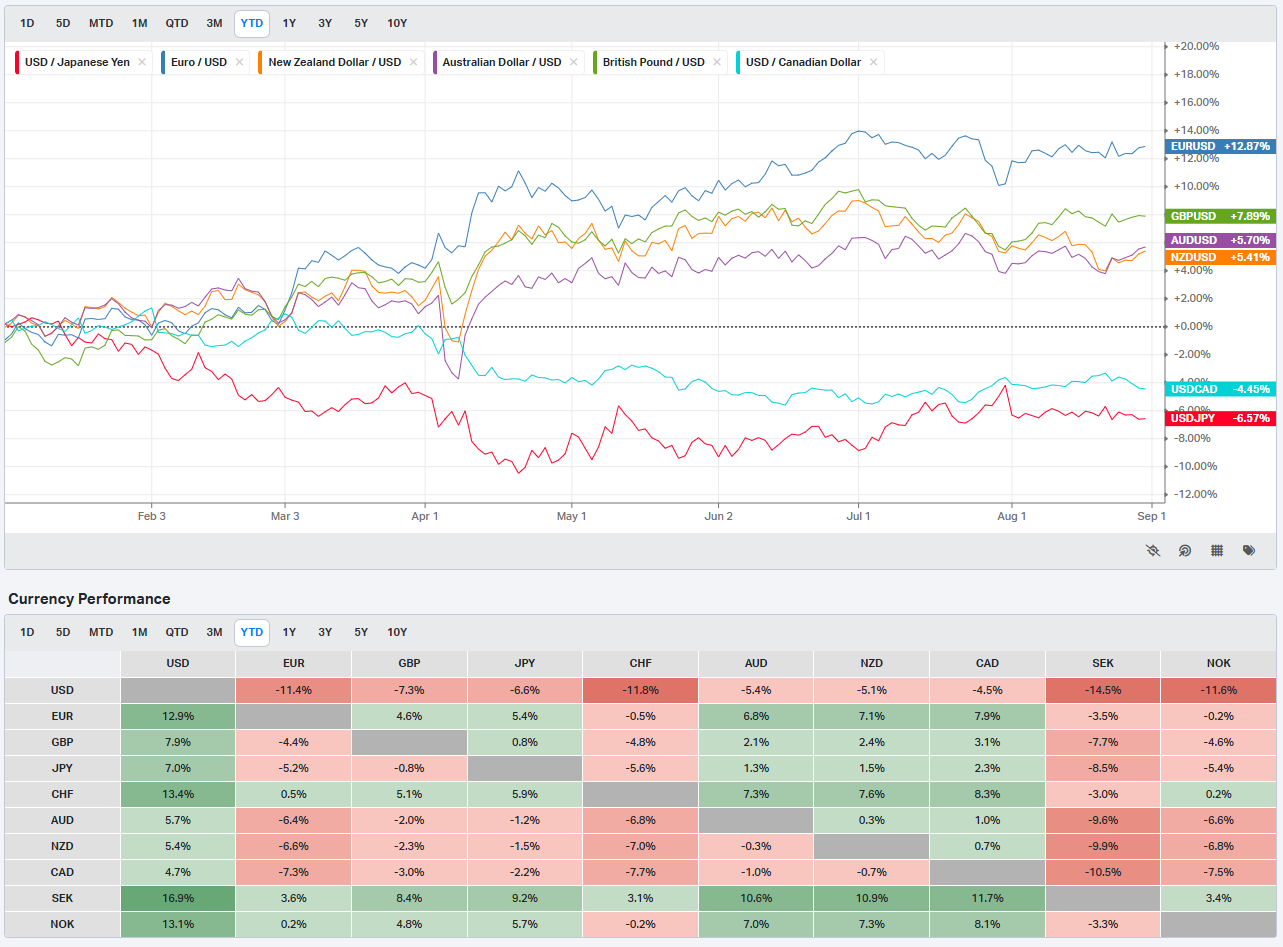
Currencies/Major FX Crosses
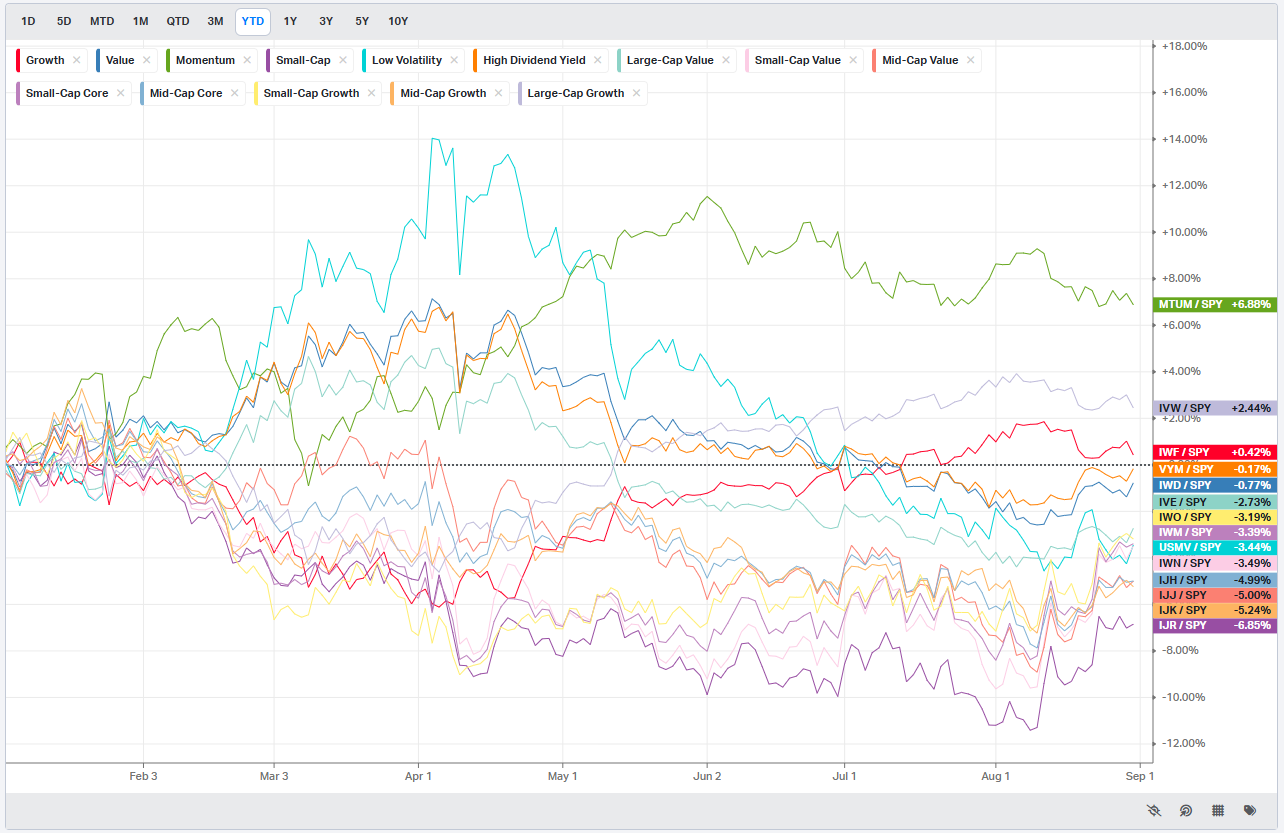
Factors: Style vs Size-vs-Value
Events On Deck This Week
Here are key events happening this week that have the potential to cause outsized moves in the market or heightened short-term volatility.
Econ Events By Day of Week
Next week’s calendar has all the ingredients to inject volatility into what’s usually a seasonally tricky stretch for markets.
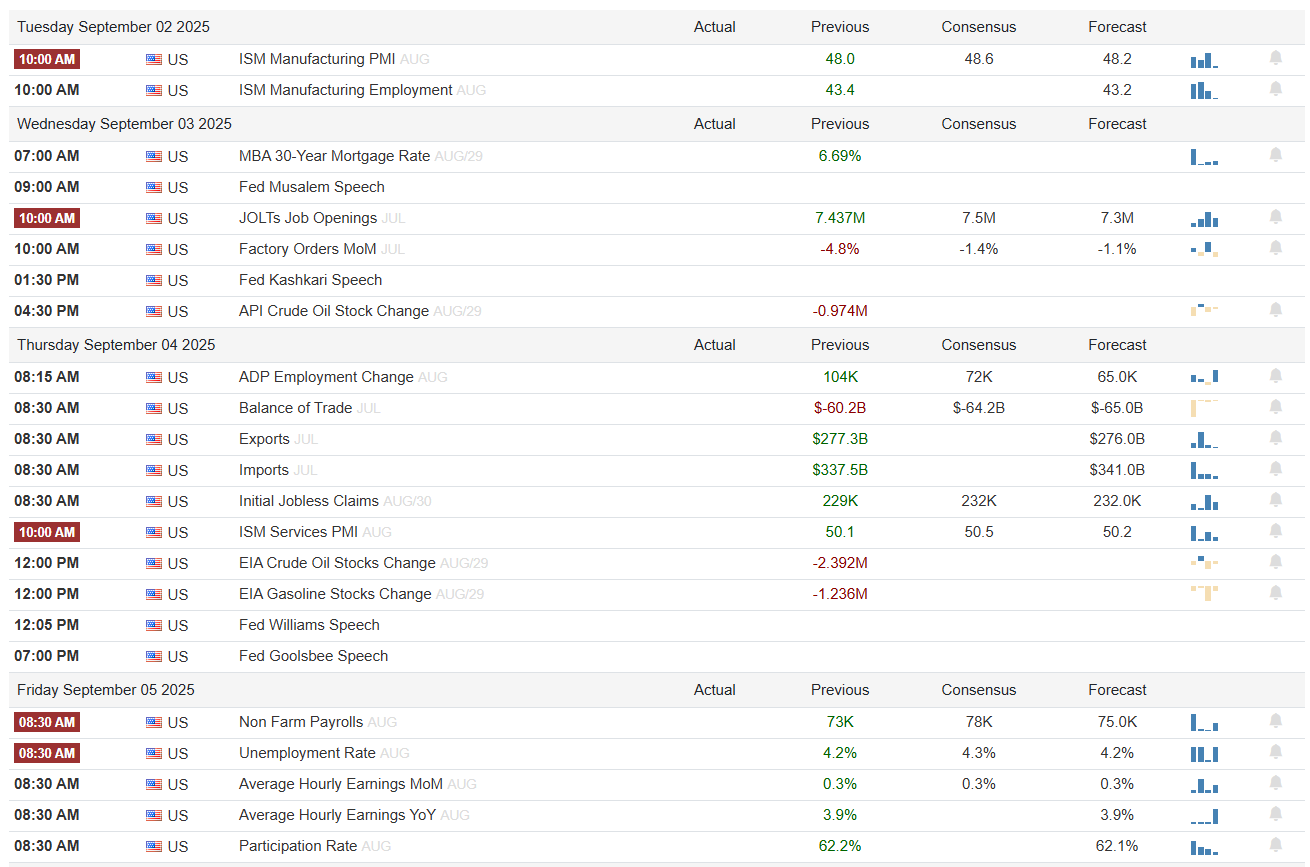
On the economic side, the focus sharpens around labor data and services activity. Tuesday brings the ISM Manufacturing PMI, which last printed at 48.0 — still signaling contraction — alongside the employment sub-index that traders will use as a tell ahead of Friday’s all-important jobs report. Wednesday gives us JOLTs job openings, factory orders, and Fed speak, capped by the weekly API crude stock change. Thursday leans heavy: ADP employment, weekly claims, the ISM Services PMI, and multiple Fed officials at the podium. But it’s Friday morning that matters most — nonfarm payrolls, unemployment rate, hourly earnings, and participation rate will tell the story of whether Powell’s Jackson Hole concern about “downside risks to employment” is showing up in the data.
Anticipated Earnings By Day of Week
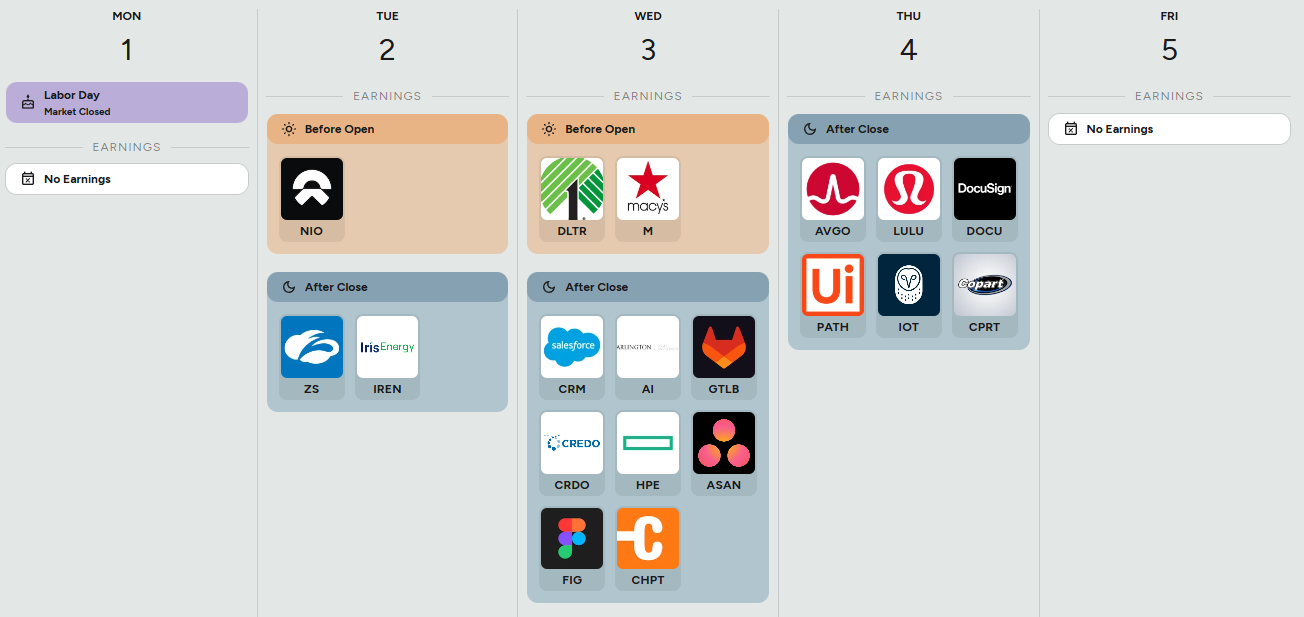
Earnings are lighter but still feature names that can swing sentiment. Tuesday kicks off with NIO before the bell, then Zscaler (ZS) and Iris Energy (IREN) after close. Wednesday is busier: Dollar Tree (DLTR) and Macy’s (M) in the morning, followed by Salesforce (CRM), C3.ai (AI), GitLab (GTLB), Hewlett Packard Enterprise (HPE), and Asana (ASAN) in the evening. Thursday after the close will be the headline — Broadcom (AVGO), Lululemon (LULU), DocuSign (DOCU), UiPath (PATH), and Copart (CPRT) all report.
In sum, next week sets up as a collision between macro and micro. The payrolls print and ISM surveys will guide expectations for the September FOMC, while a cluster of high-beta tech and retail earnings will help determine whether last week’s rotation out of mega-cap leaders has legs. It’s a setup where volatility can resurface quickly — especially with the Fed’s “data dependence” mantra in play.

Market Intelligence Report
MIR Part 1: The Backdrop
Who Came Back Early and Where They Put Their Chips
Labor Day weekend is usually when the tape quiets down, liquidity thins, and you can feel the big desks phoning it in from the Hamptons. Not this year. Institutional flows picked up sharply a full week before the holiday, and the data shows a meaningful return of positioning activity — not just passive rebalancing, but deliberate capital allocation across sectors and names. When the heavyweights step back in this early, it’s worth paying attention.
Institutions Came Back Early
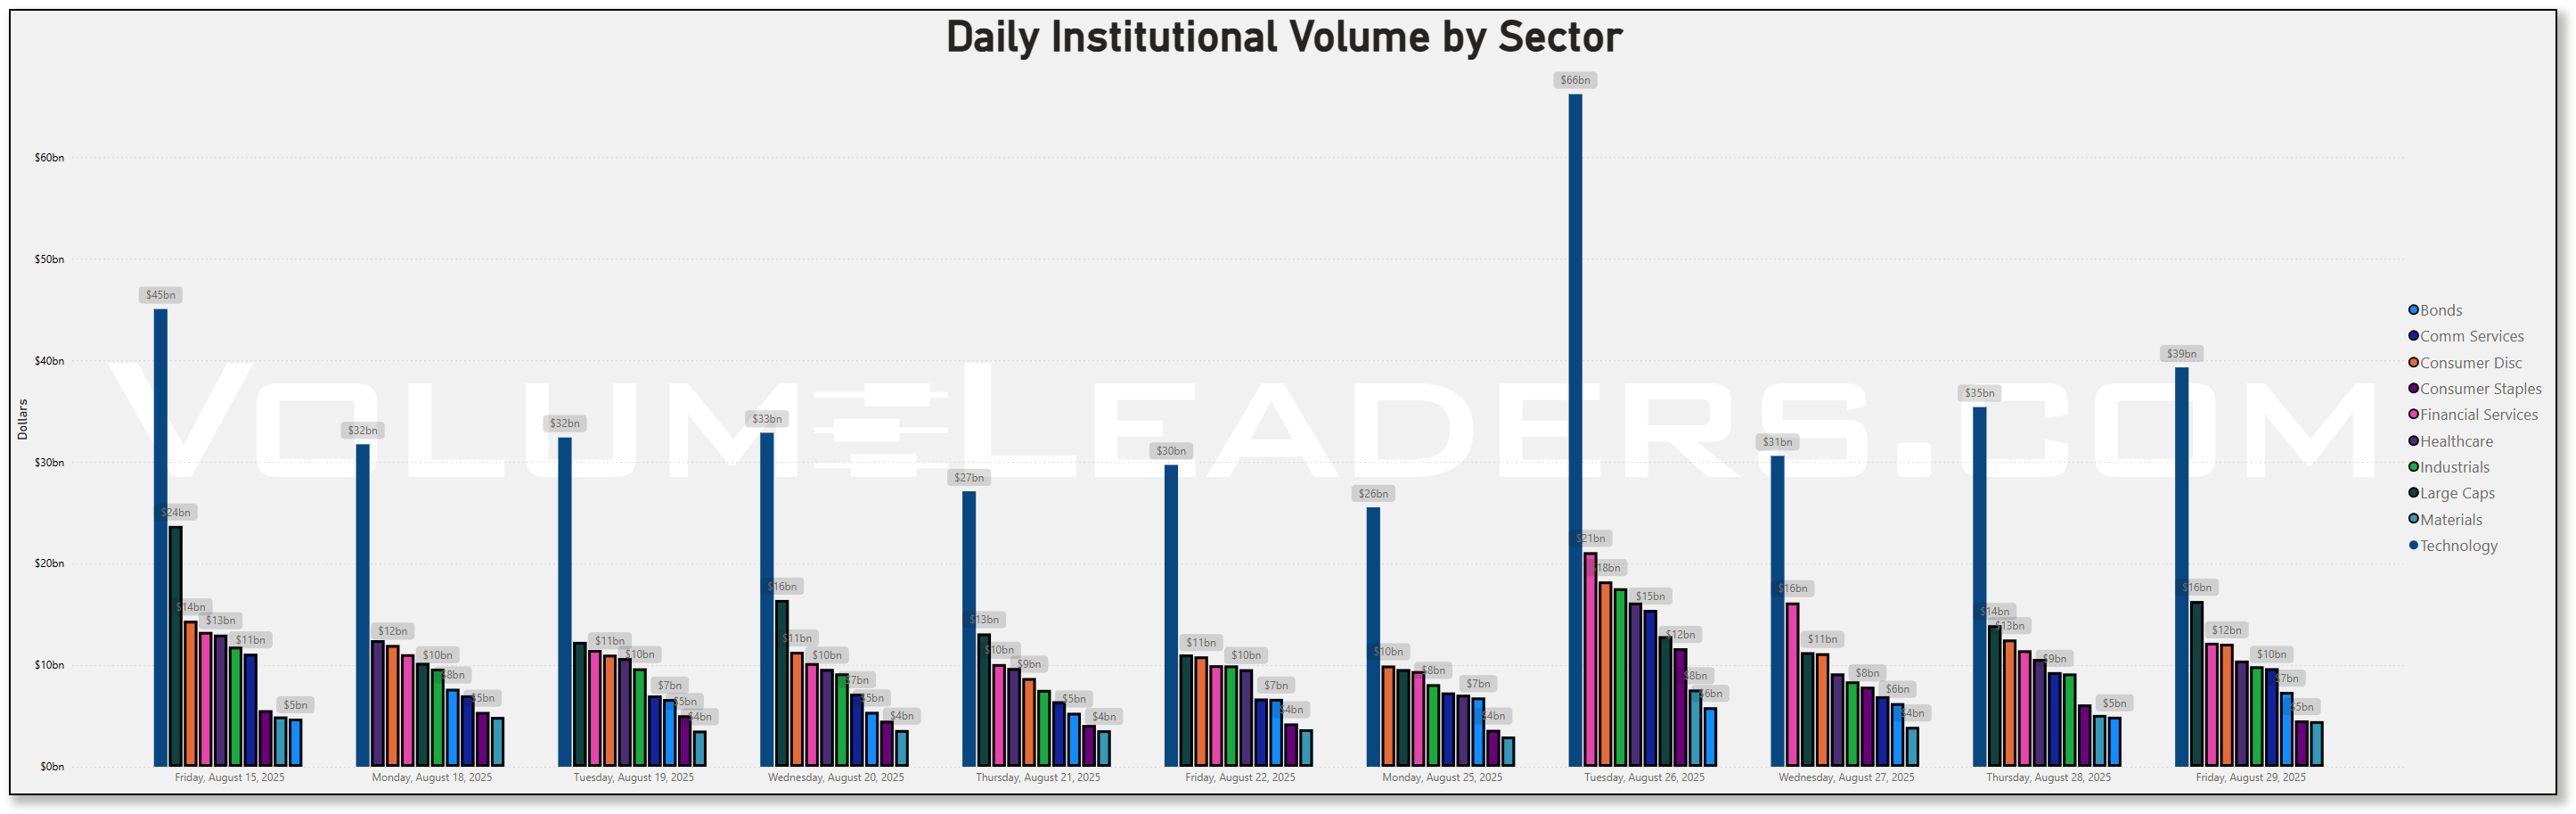
The Institutional Liquidity by Day chart makes the point clearly: we’ve gone from midsummer dribbles to $200–300bn spikes that rival the busiest parts of earnings season. August 26th saw a monster $220bn day, exaggerated by the MSCI rebalance, but the key isn’t just that single print — it’s the persistence. Even after the rebalance, liquidity didn’t fall back to $100bn holiday levels; it held at $133bn and ramped into the weekend.
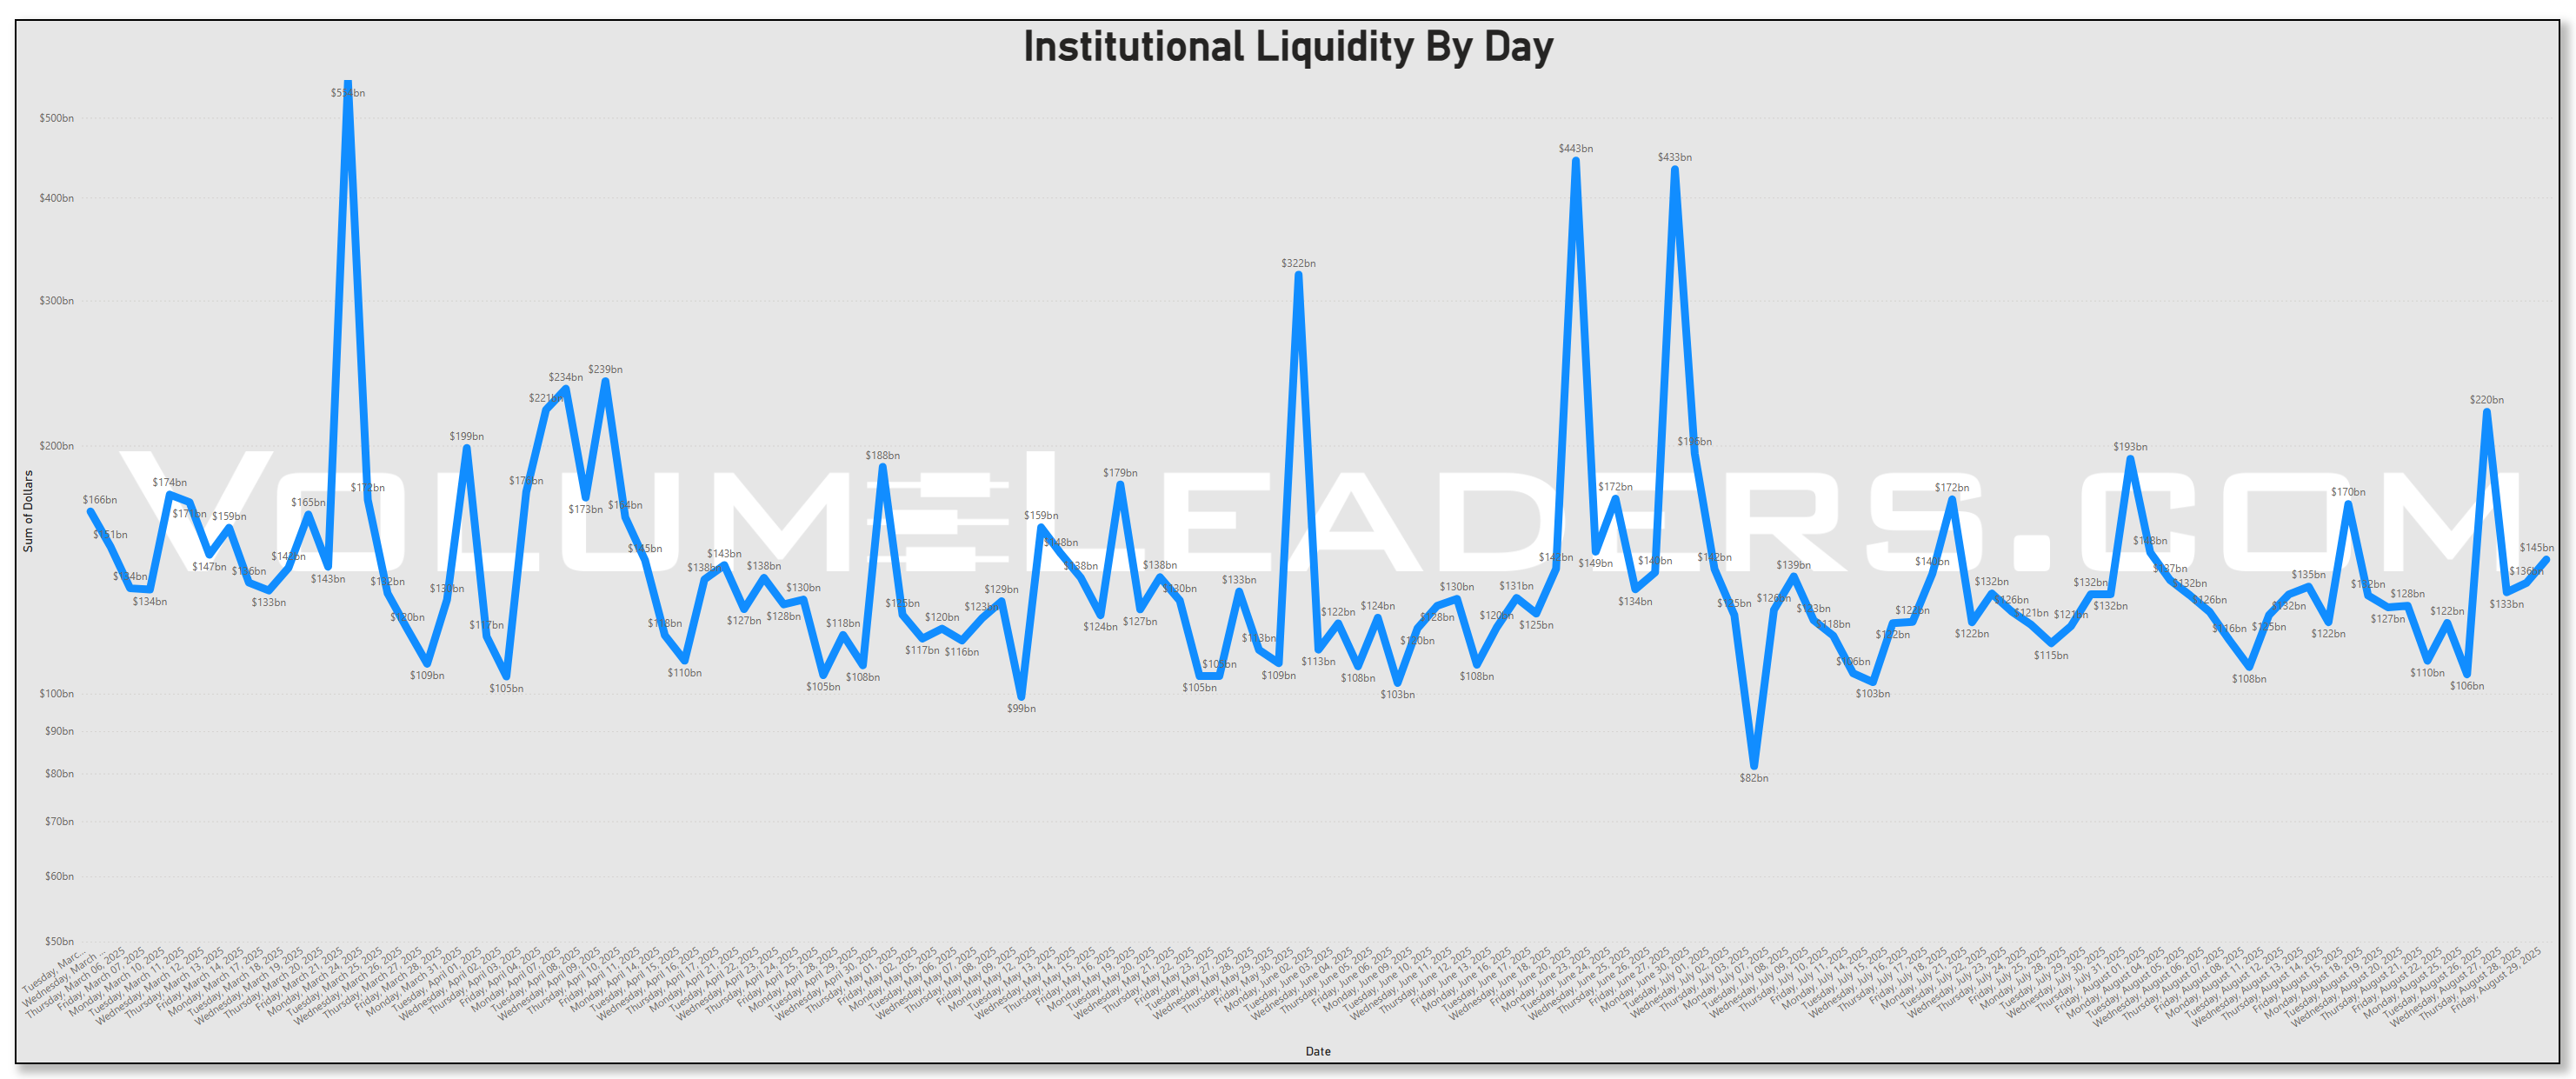
That’s the signal: institutions aren’t waiting until after Labor Day to start building books. They’re already back in size, and they’re putting money to work in very specific ways.
Technology’s Quiet Accumulation
The sector volume bars show it: Tech volume ramped this week, even as QQQ underperformed SPY. That divergence is important. When you see the Nasdaq lag the S&P yet institutional dollars are still pouring into semis, software, and cloud, it often means positioning is being built under the surface — might this suggest a catch-up bid staged for September?
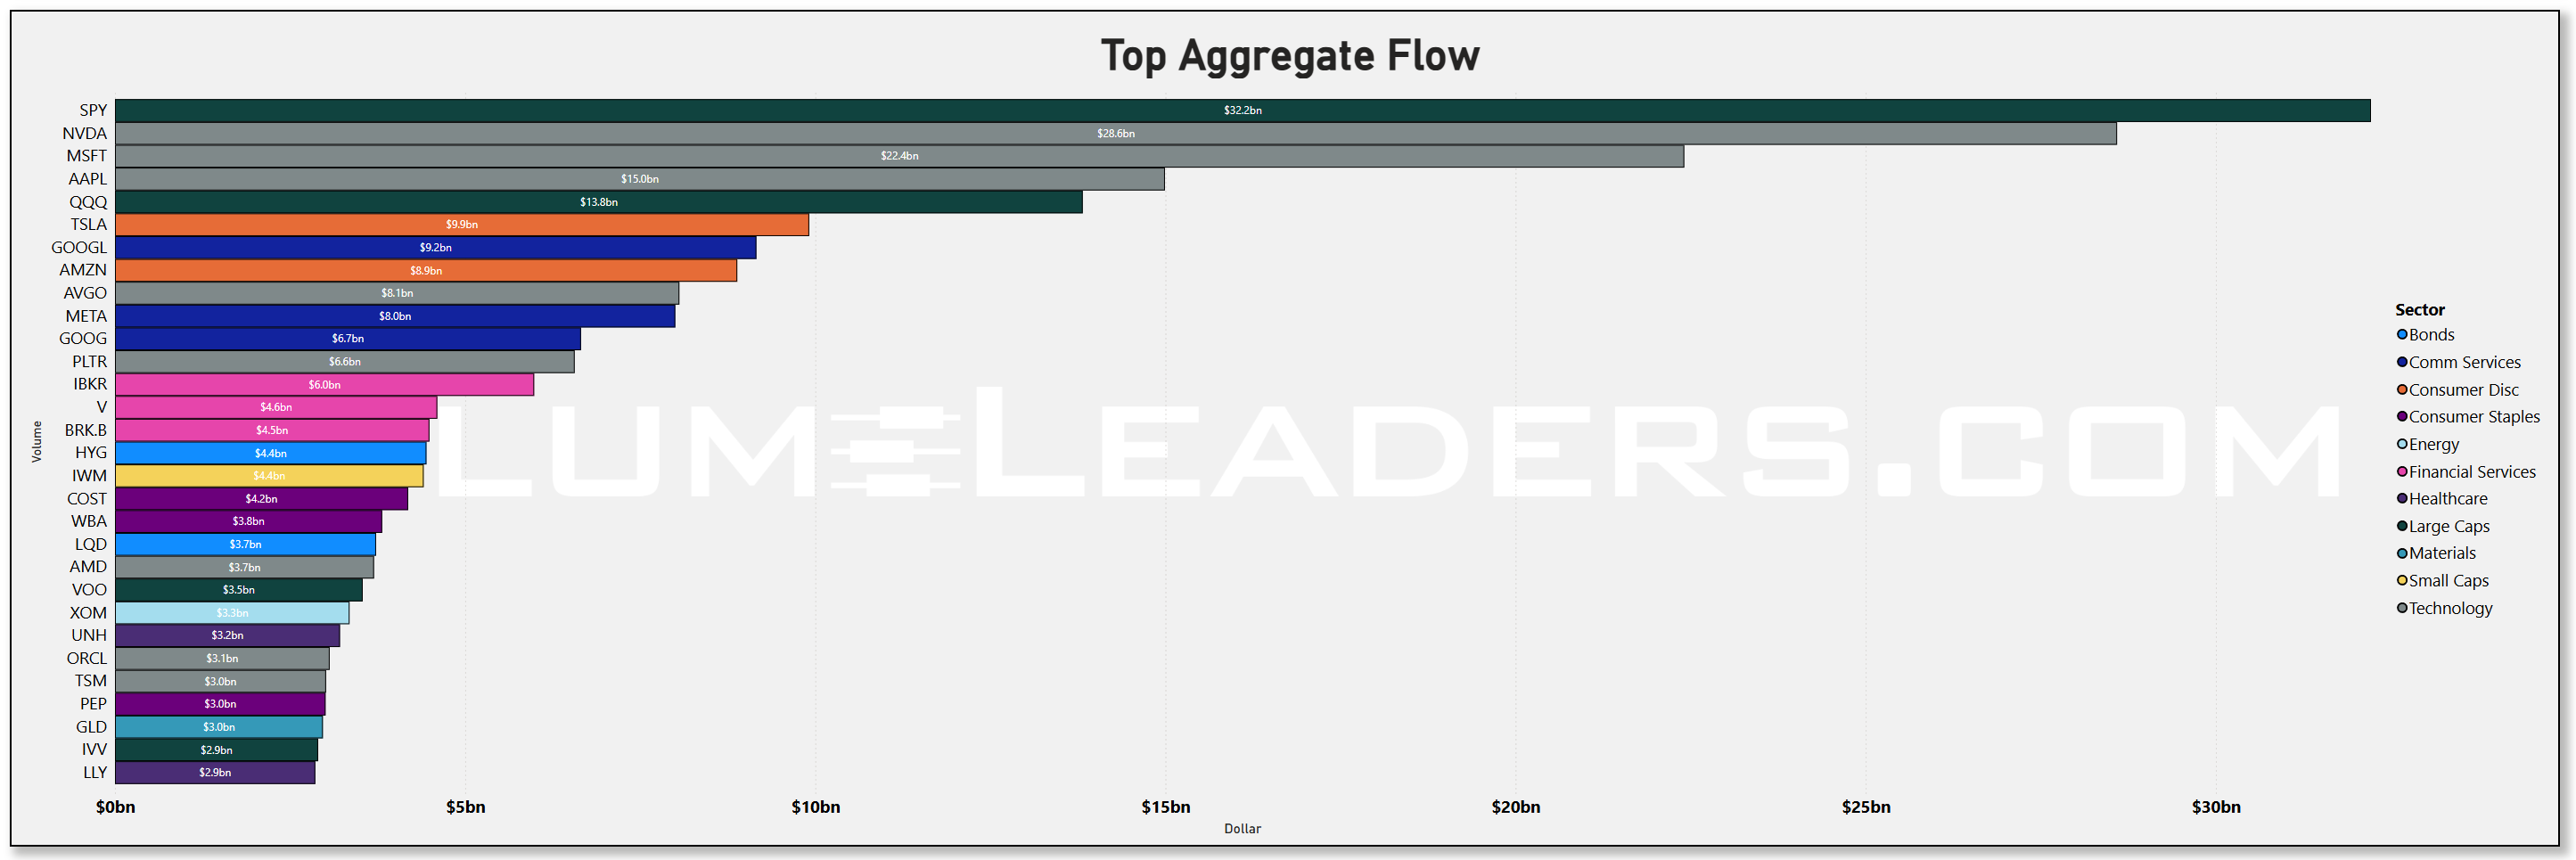
The tree map of aggregate dollars confirms it: NVDA ($29bn), MSFT ($22bn), AAPL ($15bn), and AVGO ($8bn) were all top recipients of institutional flow. Add in Palantir, AMD, TSM, and ORCL, and the list reads like a who’s who of the AI and semiconductor complex. QQQ itself saw $14bn, meaning the allocation wasn’t just ETF hedging — it was single-name, targeted positioning.
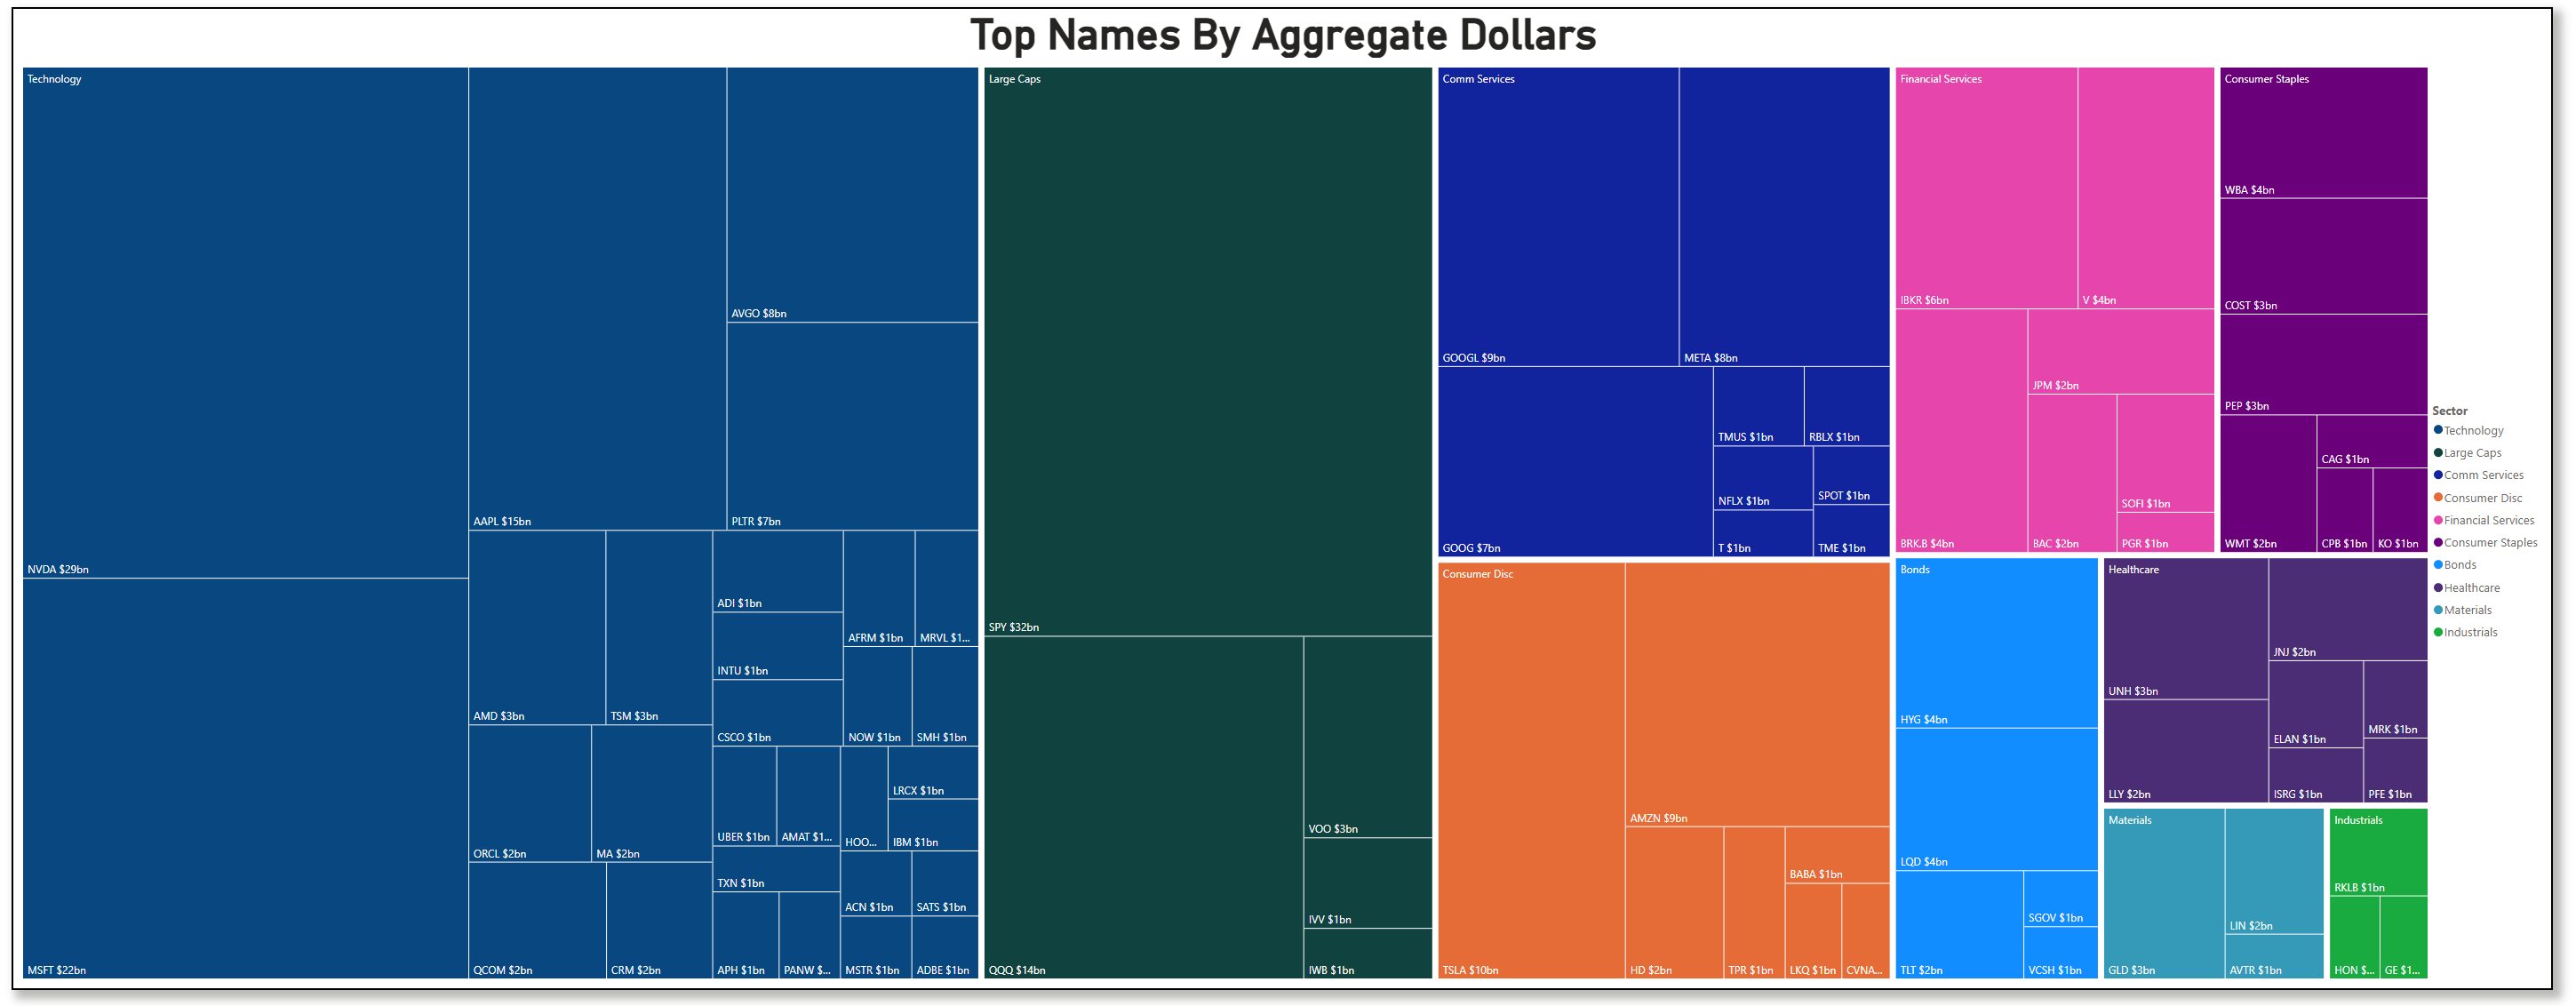
That matters. If institutions were simply hedging exposure, you’d see flow cluster in SPY, QQQ, and HYG. Instead, they leaned hard into individual Tech names. This isn’t protection; it’s pre-staging.
Event-Driven Signals: WBA, IBKR, KDP
The flow vs dollar value scatter adds texture.
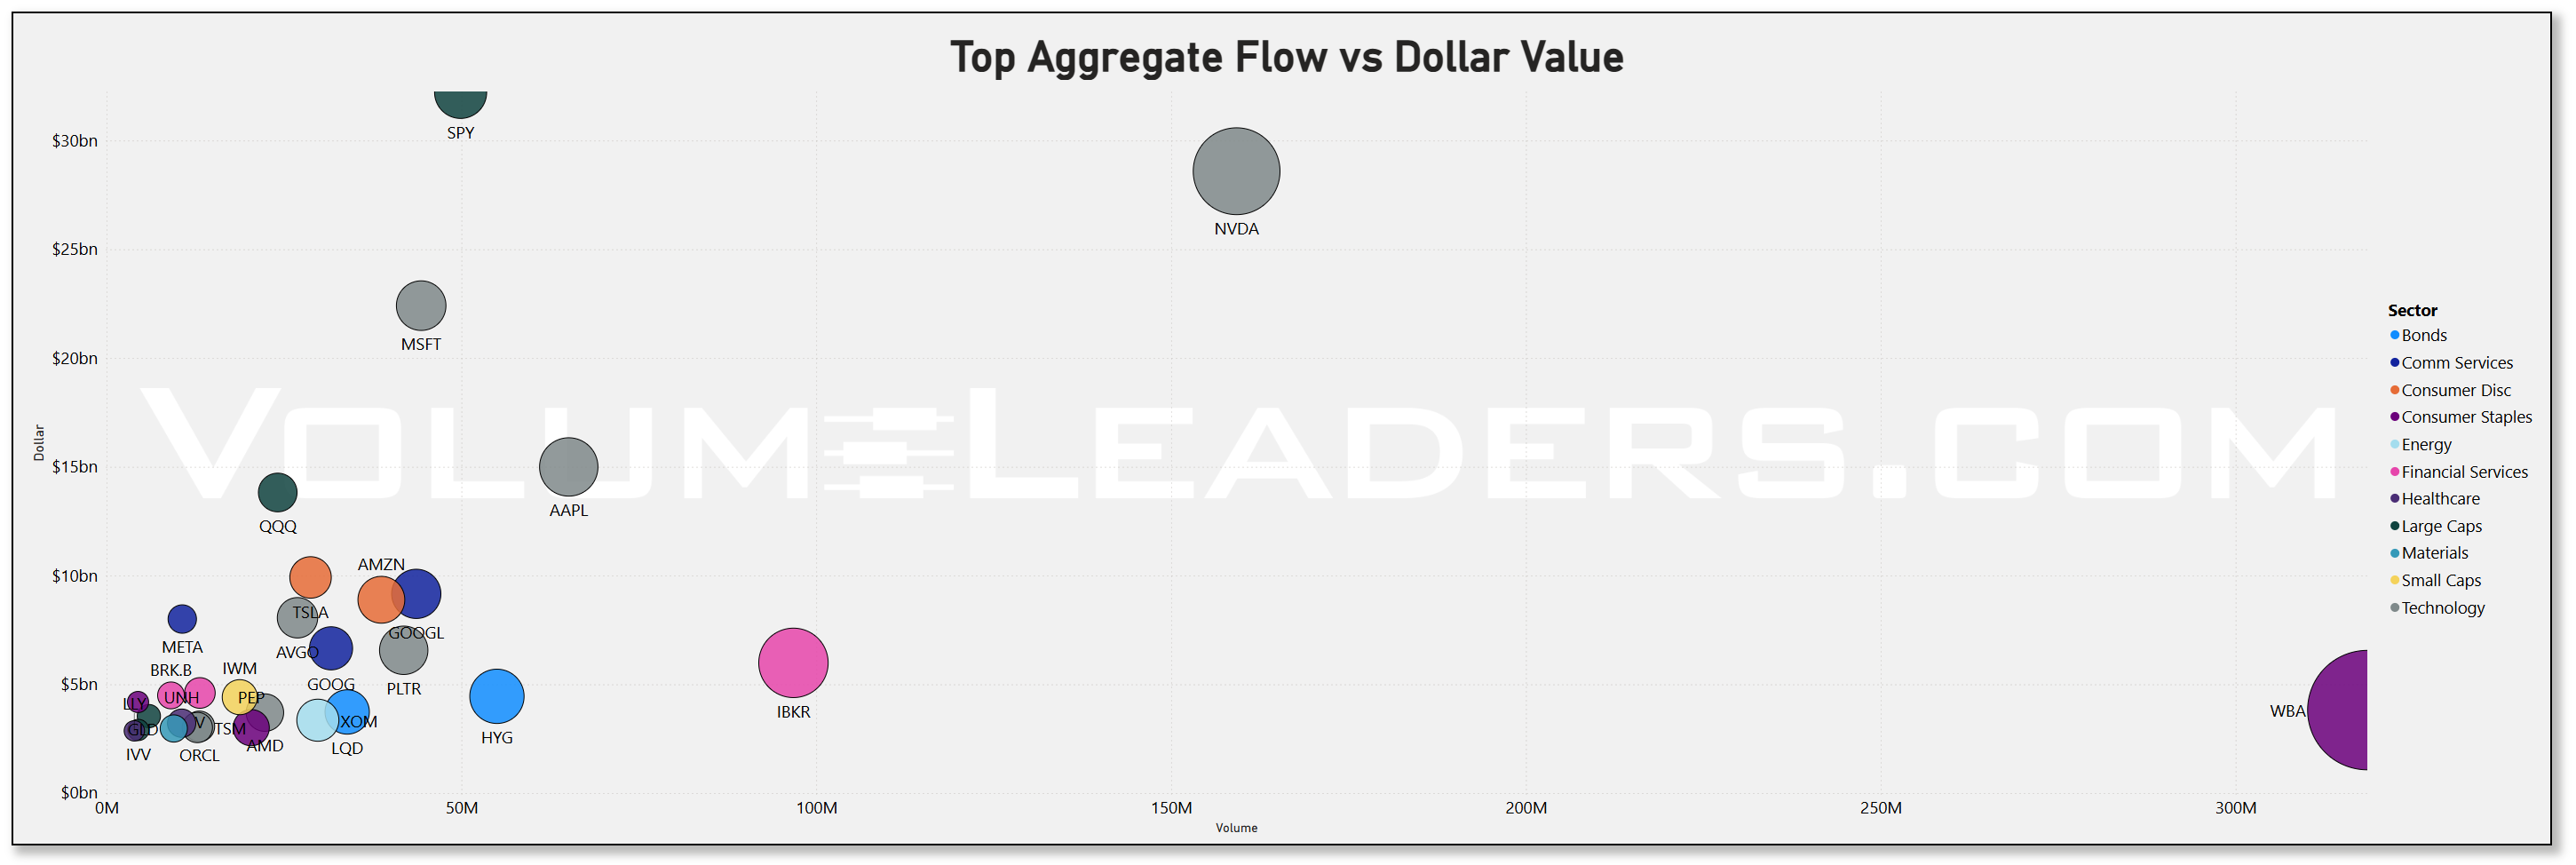
WBA (Walgreens Boots Alliance): The going-private deal with Sycamore created a liquidity outlier. Institutions piled in because the deal forces capital recycling, not because of fresh conviction in pharmacy retail. Still, the sheer size reminds us: event risk is a magnet for positioning.
IBKR (Interactive Brokers): Its S&P 500 inclusion explains the spike. Passive flows guarantee demand, but the size of institutional activity suggests active desks leaned into it too — a nod to the brokerage’s steady fundamental momentum.
KDP (Keurig Dr Pepper): The sweeps were a standout. Announcing the JDE Peet’s acquisition and split just as coffee prices run 30% y/y is no accident. Institutions hit KDP in sweeps, meaning urgency — they weren’t waiting for liquidity. The news came with an analyst downgrade and the flows tell you real money cared.
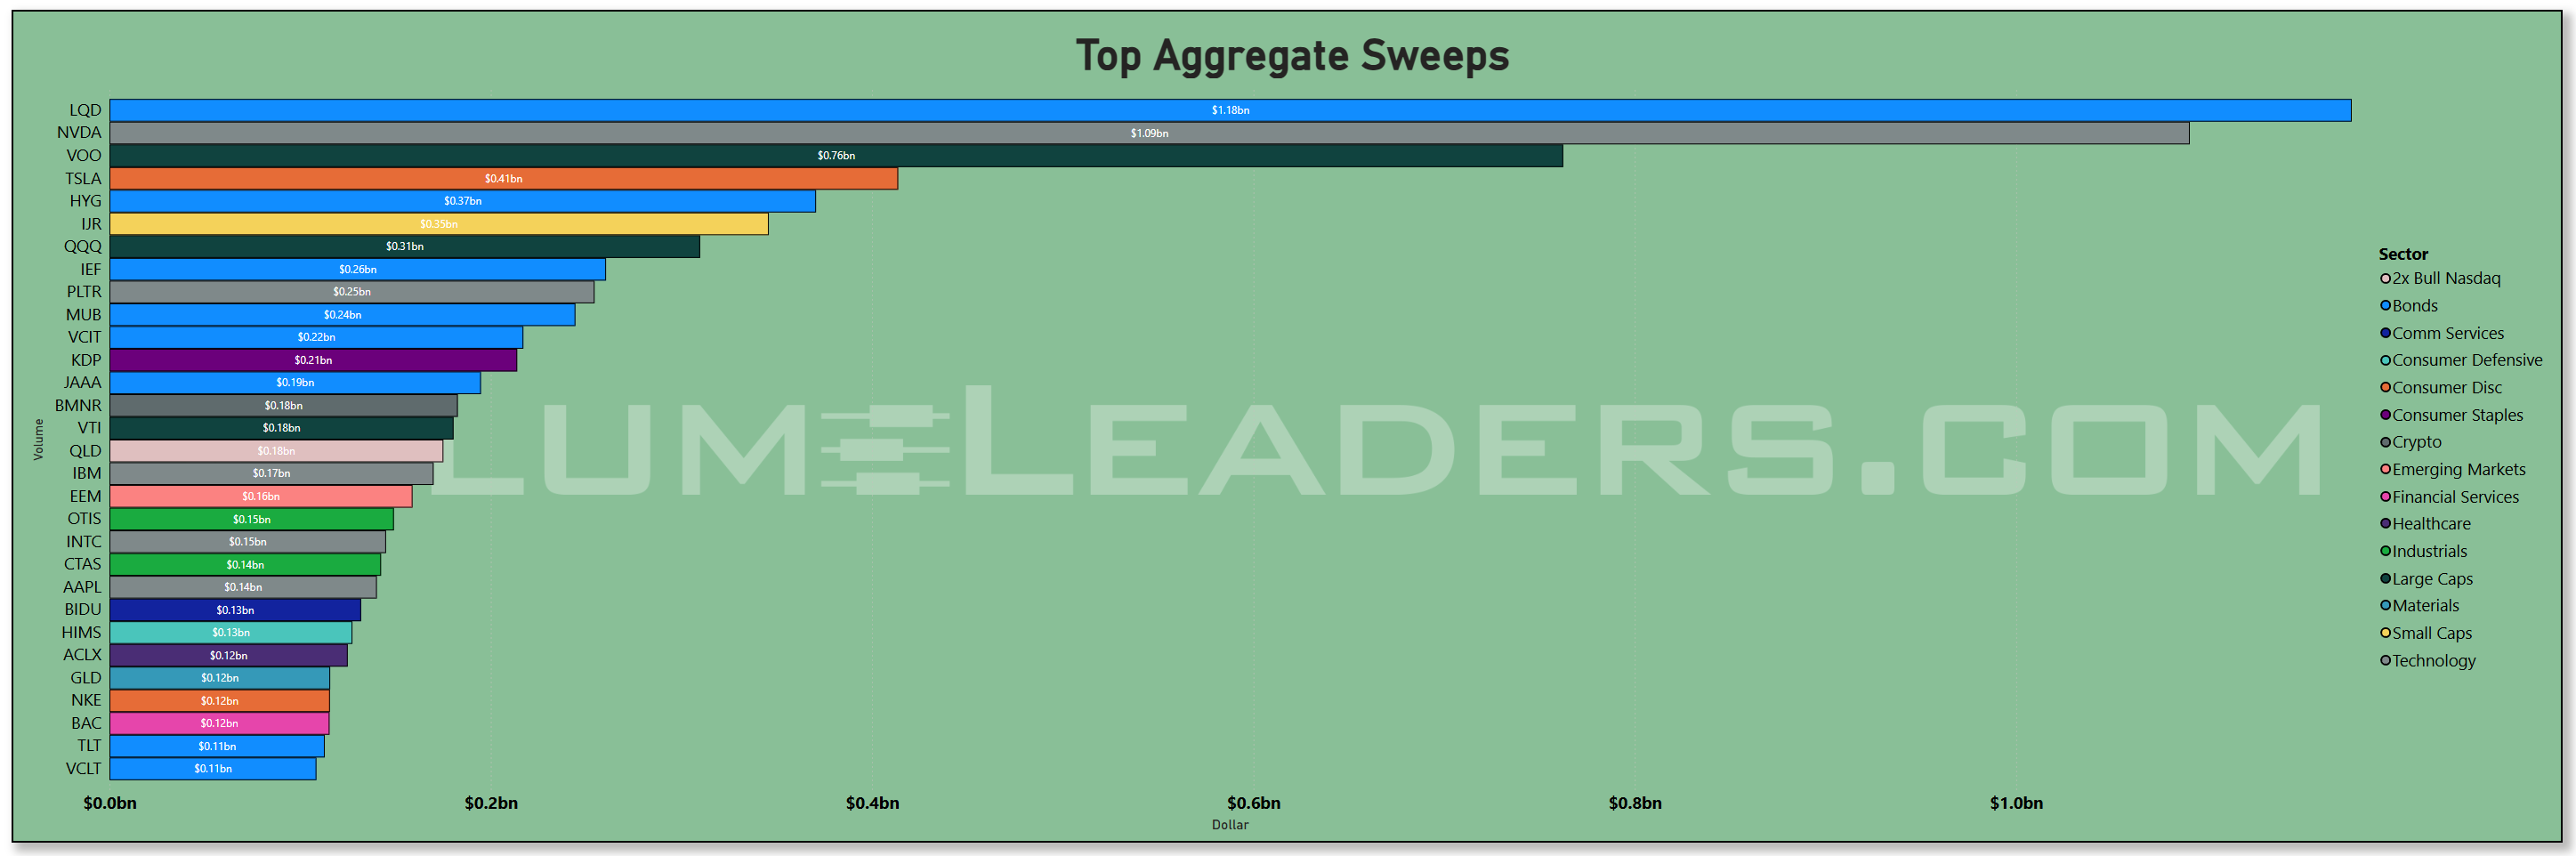
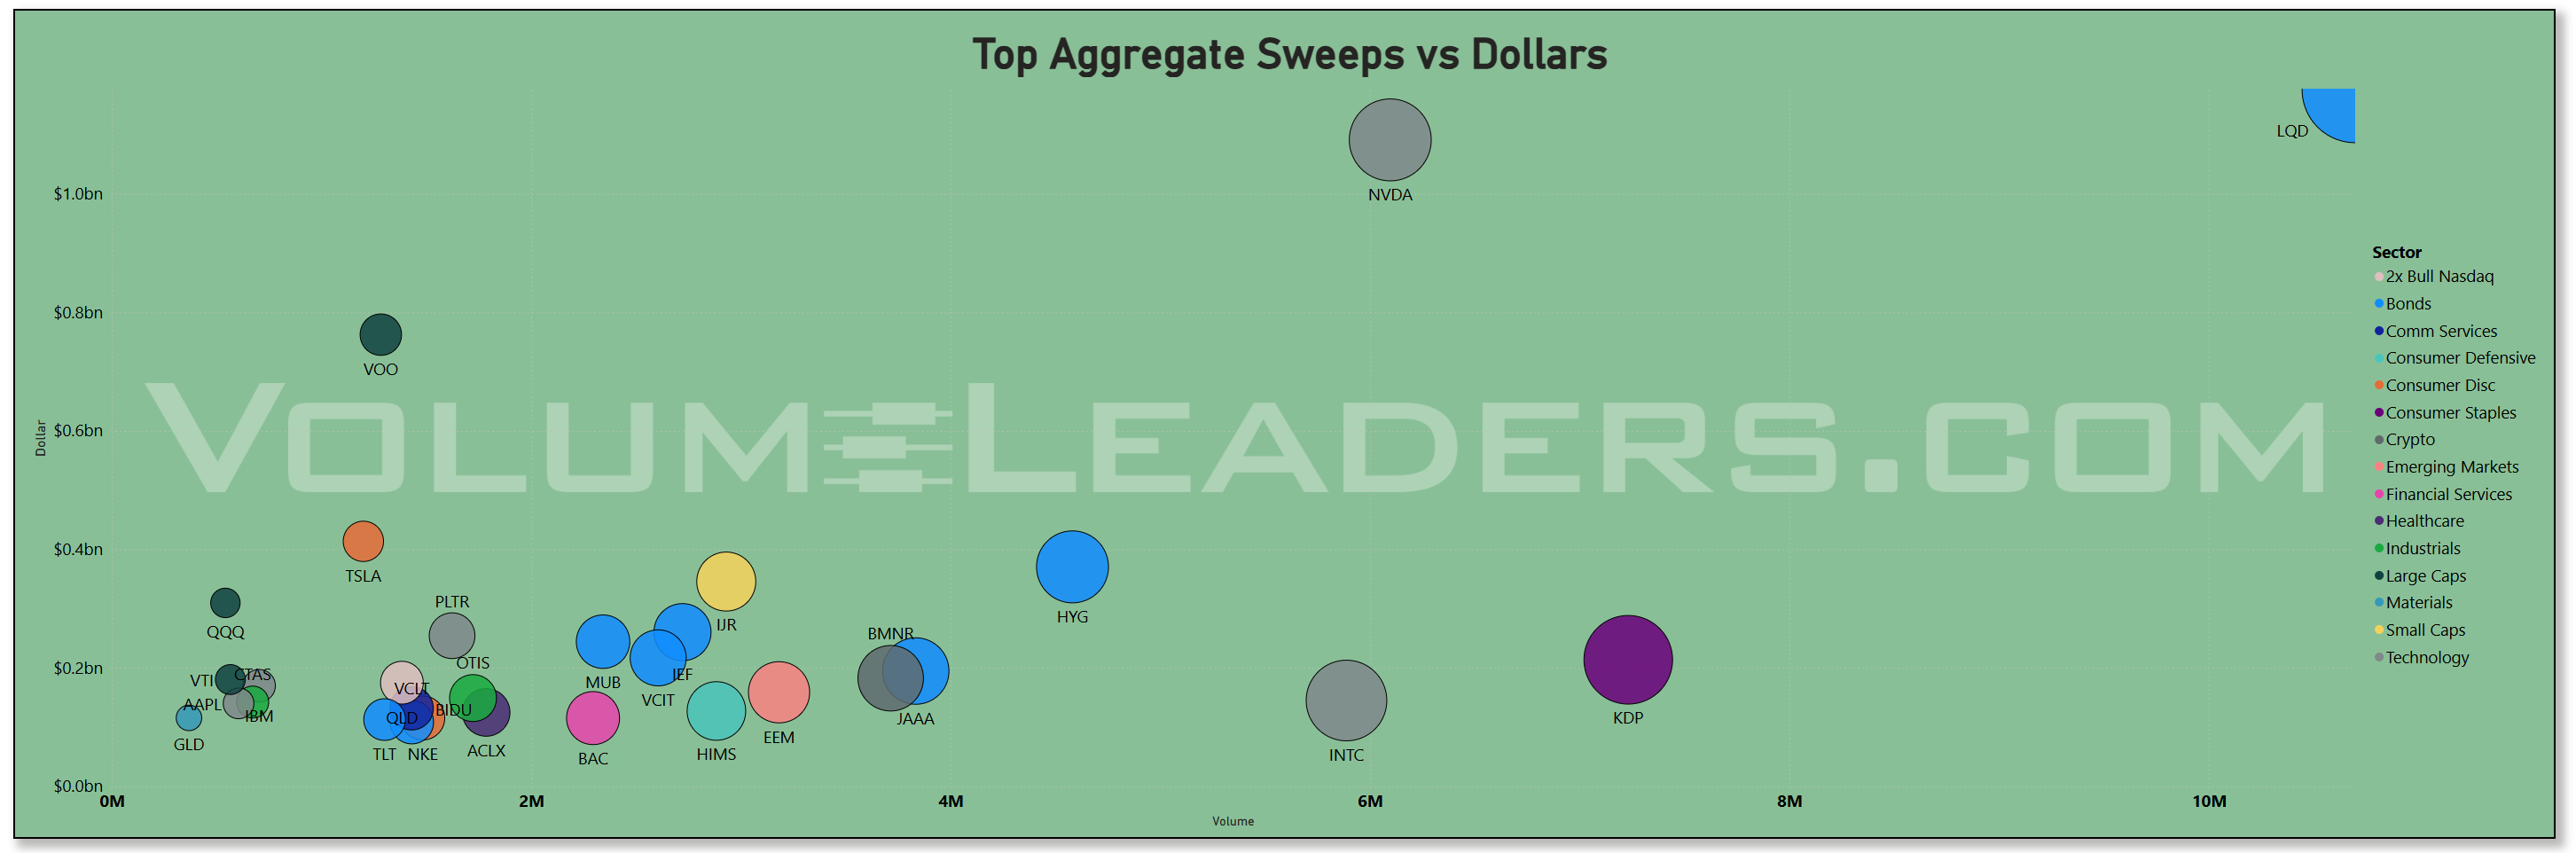
These three case studies highlight a theme: when broad conviction is thin, institutions still reflexively chase liquidity around catalysts.
Dark Pools Confirm the Story
The dark pool charts don’t tell a different story — they confirm the same one. SPY, NVDA, MSFT, AAPL, and QQQ dominate both lit and dark venues. The consistency across venues matters: it means the flows aren’t retail noise or opportunistic hedge funds. This is the steady hand of large asset managers building or rebalancing.
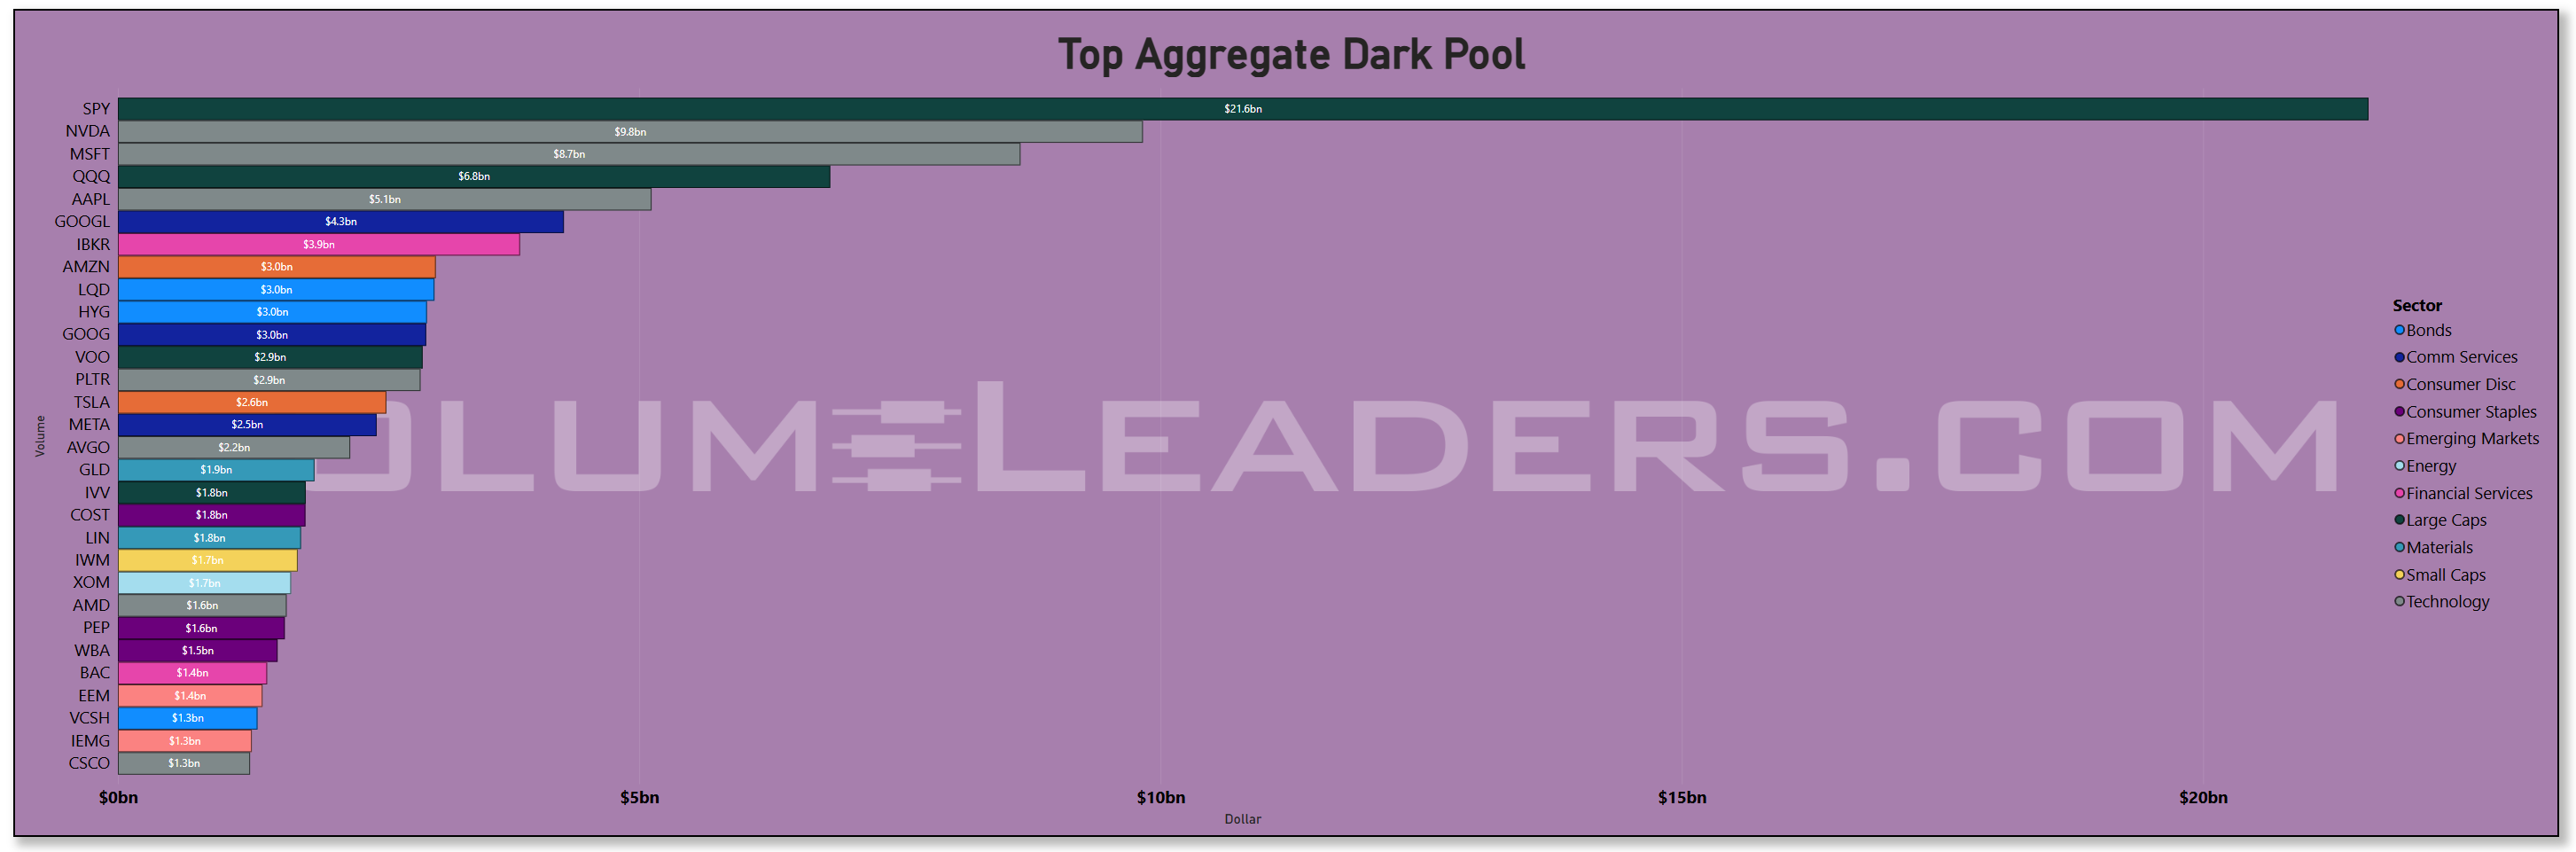
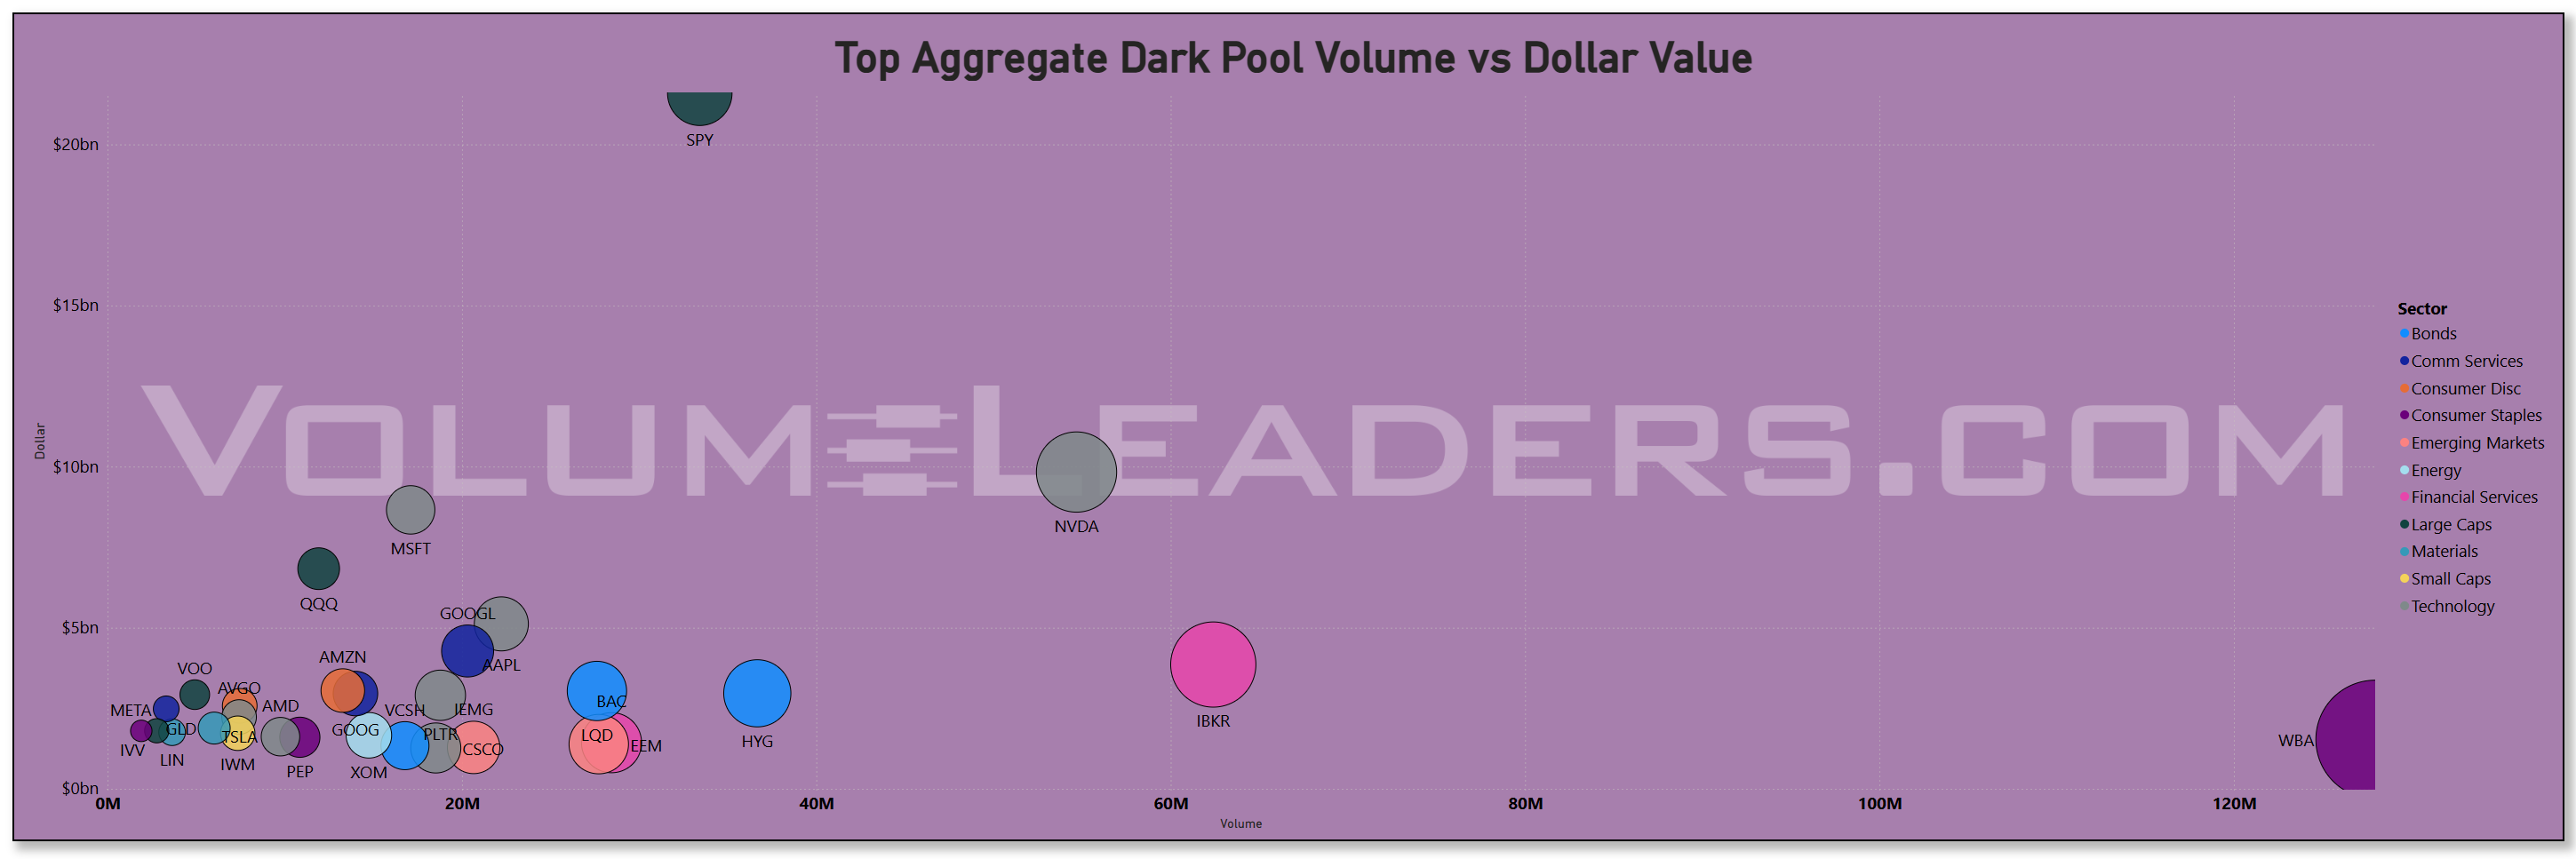
NVDA again stands out, and IBKR shows up in dark pools as well, reinforcing that the S&P inclusion wasn’t just a surface event — institutions wanted exposure in size, and they wanted it across venues.
Liquidity and Seasonality
This is where context matters. September has the weakest average seasonal profile of any month — the S&P has been down five years in a row into September, averaging a 5.4% drawdown. And yet, institutions are already back.
One way to interpret it: they’re positioning early to front-run that volatility. Think of it as stocking up ahead of a storm. If you know liquidity is going to be tested in September and October, you don’t wait until the first squall to put risk on — you scale in ahead.
The fact that flows ramped before Labor Day is itself, I’m guessing, a bullish tell.
Conviction Scores: Who Really Holds the Baton?
The ICS sector scores round out the story. Remember: ICS measures institutional conviction. Rising scores = support, falling scores = deterioration.
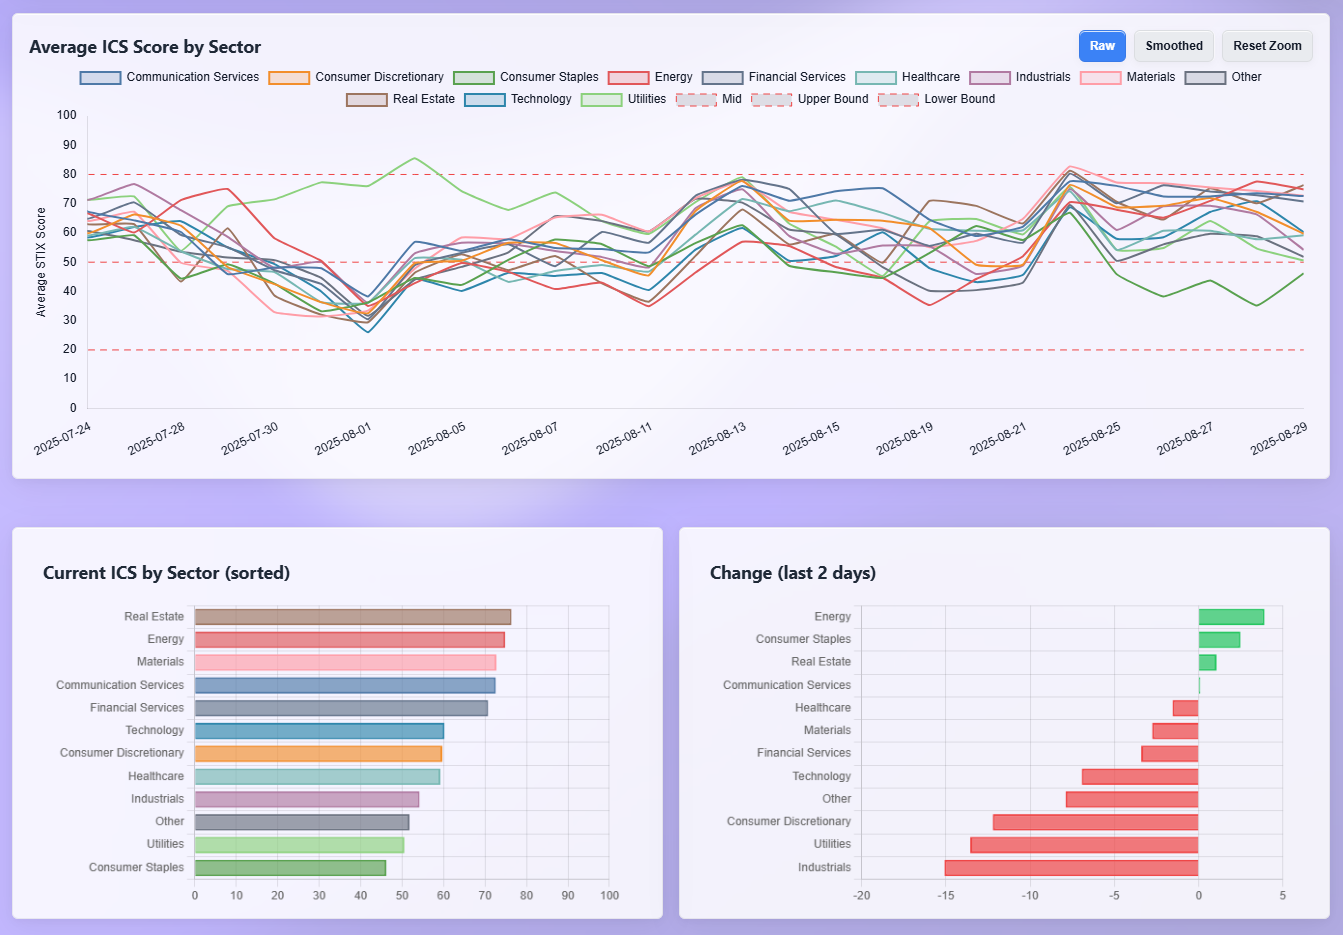
Energy and Real Estate: Both sit near the top, with Energy in particular showing strength the past two days. That matches the seasonal bid in crude and confirms institutions are rotating into the space.
Technology: Back on the upswing, which dovetails with the volume data. Institutions aren’t walking away from Tech — this is one few and very best clues that they’re likely doubling back.
Consumer Staples and Utilities: Scores deteriorated hard. That’s not what you see when institutions are hunkering down defensively. It tells us this isn’t a broad “risk-off.”
So the baton isn’t being passed to defensives. It’s still in the hands of cyclical growth sectors.
Macro Cross Currents
The positioning makes sense against the macro backdrop:
Fed: Rate-cut expectations are climbing. Waller and Daly both signaled cuts are coming, and fed funds futures now price an 88% chance of a cut in September. If the Fed is easing, Tech and Real Estate are natural beneficiaries.
Tariffs: Trump’s tariff expansions are a headwind for Industrials and multinational manufacturers, but they also push flows toward domestically-driven sectors (Real Estate, Energy, small caps).
AI Cycle: Capex is still ramping. NVDA, MSFT, and AAPL don’t need blow-out guidance to justify allocation; they just need the structural story to remain intact.
Dollar & Commodities: A softer dollar supports Energy and Materials. Rising oil adds to Energy’s ICS strength. Gold’s resilience ($3,500+) is also drawing quiet institutional interest.
The currents are messy, but they rhyme with the flows we’re seeing.
How I’m Thinking About Positioning:
If you told me I had to put risk on, here’s how I’d sketch it based on this week’s institutional data:
Lean Into:
Technology — specifically the Mag7, with NVDA, MSFT, and AAPL at the core. The catch-up bid is a lower-risk/higher-reward bet, as QQQ lags SPY. With improving ICS and QLD shown in the green-Sweeps chart above, it’s not something I want to try and fight when BOM flows hit on Tues.
Energy — seasonal tailwinds, high ICS scores, and oil’s structural bid make it the clearest cyclical play.
Real Estate — early innings of rate-cut positioning. Selective REIT exposure makes sense if the Fed follows through.
Hedge / Protect:
Consumer Staples — deteriorating ICS makes them unattractive offensively, but they still function as partial hedges if September volatility hits.
Long-duration bonds or gold — both offer ballast against a policy or macro shock.
What to Watch for Confirmation:
QQQ/SPY ratio turning higher.
Tech ICS staying elevated even as prices chop.
Energy ICS holding >70 into mid-September.
What Would Invalidate the Thesis:
Defensives (Staples, Utilities) suddenly leading ICS while Tech rolls over.
Liquidity spikes resolving into lower highs for SPY.
Fed rhetoric flipping back hawkish on a strong jobs print.
Bottom Line
Institutions came back early, and they came back selectively. Technology is still the main artery of flow, Energy is quietly gaining sponsorship, and Real Estate is being pre-positioned for rate cuts. Staples and Utilities are losing institutional conviction, which means this isn’t a defensive rotation.
The thesis is simple: this is positioning, not chasing. Institutions are laying groundwork before September volatility, and the weight of evidence suggests they’re leaning into growth and cyclicals, hedging with partial defensives and bonds, and keeping flexibility for policy risk.
If I had to choose: I’d lean long Tech and Energy, hedge with Staples and gold, and keep a sharp eye on whether QQQ/SPY confirms or rejects the catch-up bid. That ratio, more than anything else, will tell us whether the early return of institutional liquidity turns into a September tailwind or another seasonal stumble.
MIR Part 2: Individual Names From The Institutional Tape
VolumeLeaders tracks several proprietary signals designed to spotlight names drawing significant institutional interest. Below, we’ve surfaced the latest results and analyzed them in aggregate to highlight emergent themes. If any of the sectors, narratives, or positioning trends resonate, the names mentioned here offer a strong starting point for deeper research and watchlist consideration in sessions ahead.
VL Trade Rank Velocity™ (TRV)
TRV is a proprietary metric that measures the recent acceleration or deceleration in institutional trading activity for a given stock by comparing its average trade rank over the past few days to its average in recent weeks. A sharp improvement in TRV typically reflects a notable shift in positioning, often accompanied by sustained trade activity, suggesting institutions are actively engaging with the name and that intensity of activity is rising. This often precludes meaningful price or narrative shifts. This isn’t a buy-list or sell-list; it’s meant to draw your eyes to names where institutions are putting money to work.
Looking at the TRV readings this week, the first impression is how broad the acceleration is across very different corners of the market, but there are some themes cutting through the noise. Technology remains the backbone — not just the usual mega-cap AI suspects, but a wider net of names like TLS, SATS, VSAT, ARTY, CYBR, and even niche AI proxies like CHAT and WTAI. The fact that so many smaller, less liquid technology names are showing sustained TRV strength suggests institutions are combing further down the cap structure, not just hugging the big liquid bellwethers. That’s often how early leadership rotations start.
What’s striking too is the presence of leveraged thematic products alongside the single-name activity. You’ve got SOLT (levered Solana), PLTU (2x Palantir), DFEN (aerospace and defense bull), and even UBT (levered TLT). That speaks less to day-trader froth than to institutions actively positioning with structured vehicles where liquidity pools are deep enough to mask size. It tells you the rotation into “new” themes — AI, defense, crypto proxies — is happening both in the cash equity layer and in the derivatives/levered ETF layer, which often amplifies underlying conviction.
Energy is another recurring thread. Clean energy via ACES, uranium exposure through URNJ and UUUU, oil and gas with NEXT, INVX, and VNOM — all lit up with meaningful acceleration. After a quiet summer, that kind of cluster in TRV suggests money is probing for cyclicals that can run if the Fed really does move to cut and the dollar softens. The uranium bid in particular has been sticky, showing up in multiple signals over the past month.
Financials also register, though with a slightly different flavor. TRV names here include asset managers (BN, WT), brokers and exchanges (TW, HLI), mortgage finance (AGM), and a smattering of capital markets players like NEWT. It doesn’t look like a single-sector surge so much as steady accumulation across the plumbing of the financial system. If we’re really entering a rate-cut cycle, that makes sense — the market is preparing for activity to flow back into these channels.
You also see a long tail of industrials — JOBY in air mobility, SXI and ESE in machinery, KTOS in defense — which rounds out the cyclical tone. And peppered through the list are consumer discretionary one-offs like SHAK and BKE, which might be read less as a broad sector call and more as institutions taking selective shots where fundamentals align with macro tailwinds.
If you stitch this together, the emergent theme is that institutional acceleration is no longer narrow. Earlier in the summer, AI semis dominated every list. Now TRV shows a widening circle: still plenty of tech, but also energy, financials, industrials, and even some consumer names. That breadth is exactly what you’d expect to see if the market were setting up for a broader rally on the back of easier financial conditions. The hedges are visible too — products like GDXD (3x bear gold miners) and UBT tell you that not everyone is unhedged, but the thrust is still expansionary.
The read-through is that institutions aren’t abandoning the AI trade, but they’re actively layering in cyclicals and secondary themes — energy transition, defense, select financials — that would thrive if the macro narrative really does bend toward rate cuts and softer inflation. For traders, that suggests the tape may get noisier in September, but the leadership rotation underneath is real and increasingly hard to ignore.
VL Institutional Outliers™ (IO)
Institutional Outliers is a proprietary metric designed to spotlight trades that significantly exceed a stock’s recent institutional activity—specifically in terms of dollar volume. By comparing current trade size against each security's recent normalized history, the metric flags outlier events that may indicate sudden institutional interest but may be missed because the activity doesn’t raise any flags/alerts when comparing the activity against the ticker’s entire history. For example, it’s conceivable that a ticker today receives the largest trade it has had in the last 6 months but the trade is unranked and would therefore be missed by current alerts built off Trade Ranks. Use “Realized Vol” to identify tickers with large price displacement and to size your risk appropriately.
When you line up the outliers this week, the first thing that jumps off the page is how heavily the financial sector features. Regional and mid-tier banks like PPBI, COLB, BHLB, BRKL, and TOWN all printed flows six sigma above normal. That’s not a small quirk in the data — that’s real size showing up in a part of the market that has been largely ignored since the post-SVB retracement. And it wasn’t isolated: the KBE ETF itself showed up as well. Taken together, it’s hard not to read this as a coordinated repositioning into financials, whether as a rate-cut beneficiary trade or simply recognition that valuations are cheap relative to where the cycle might be heading.
Healthcare had its own outlier streak. Elanco (ELAN) traded with conviction, as did Sarepta (SRPT), InMode (INMD), and a host of smaller-cap biotech names. This comes at the same time the sector’s realized volatility remains elevated, but what’s unusual is that these prints didn’t come in “fast money” fashion — the trades were large, repeated, and near current marks. Institutions are clearly starting to treat biotech not as optional speculation but as something worth scaling into while the broader market debates macro.
Technology naturally had its share of outliers — Ambarella (AMBA), Marvell (MRVL), Pure Storage (PSTG), and the SMH ETF itself. This was the week semis cracked lower on Marvell’s miss, and yet the positioning data says big money was stepping in size. To me, that looks like classic accumulation: volatility is still in play, guidance was soft, but institutions appear more interested in the long-term AI and infrastructure narrative than in one or two weak quarters.
There were also idiosyncratic stories worth flagging. Walgreens Boots (WBA) is going private, but we saw similar dynamics here in unusual activity across Interactive Brokers (IBKR) after its S&P 500 inclusion and Keurig Dr Pepper (KDP) around its JDE Peet’s deal. In the outlier set this week, Walgreens’ cousins in consumer staples — Unilever (UL), MGPI, and even Tyson (TSN) through different lists — all showed excess size, reinforcing that staples are still being used as a positioning anchor.
Energy wasn’t left behind either. Midstream name Kinetik (KNTK) and producers like CVE, MGY, and NXE printed way outside their norms. Given the steady bid in crude and the renewed chatter around geopolitics, that fits with the idea of institutions getting back in front of what’s still the cleanest macro hedge — long energy, long cash flow, long visibility.
The picture that emerges isn’t random. It’s banks, biotech, and energy on one side — cyclical, policy-sensitive, and real-asset linked. On the other, it’s semis and infrastructure tech names, where investors appear willing to look through noise and keep layering into AI and compute. That’s not a defensive posture. It looks more like a forward-rotation, where capital is probing under-owned sectors ahead of a Fed easing cycle while maintaining exposure to the secular AI story.
If I had to translate that positioning into a thesis: institutions are rebalancing early for a September cut, and they’re doing it by re-engaging in rate-sensitive financials and selectively pressing into biotech and energy, while using tech weakness as an excuse to add. That leaves the tape with a broader base than it had earlier this summer. Confirmation would come if we see the Russell 2000 and equal-weight indices continue to outperform into September. Invalidation would be if these outliers revert quickly and semis lose structural sponsorship.
VL Consensus Prices™
These are the most frequently traded #1-Ranked Levels in VL this week. Trades occurring at the highest volume price in a ticker’s history are significant because they represent institutional engagement at a key price memory level—where the market once found consensus. These areas act as liquidity hubs, enabling large players to transact efficiently, and often signal a reassessment of fair value. This activity may precede major moves, mark equilibrium zones, or reflect broader portfolio shifts, making these price levels important to watch even without yet knowing how price will resolve. (Note: many Bond products trade in such a tight range that they dominate the top positions and are therefore omitted to provide better clarity around other flows. The bonds data is still available in the VL platform.)
When I look at this list of consensus prices through a forward lens, the first conclusion is straightforward: semiconductors are still the fulcrum. They’re the sector that institutions keep circling back to, and that means any broad market move will be tethered to whether these levels hold or fracture. If semis stabilize and start to build higher against these consensus zones — names like Qualcomm, Marvell, ON, Microchip — you’ll see breadth improve, QQQ begin to catch back up to SPY, and risk appetite expand down the cap scale. But if they can’t hold, the weakness won’t stay confined; it’ll ripple out into the AI complex and eventually drag the broader tape with it. That’s the first axis to watch.
The second is energy. When oil-linked names like BP, CVE, and Phillips 66 show up with this kind of institutional footprint, it’s not just passive positioning — it’s an insurance policy. If semis falter or macro data turns stagflationary, energy becomes the natural hedge. My base case is that institutions will continue to fund their higher-beta bets with a core allocation here. If crude holds above its recent pivot zones, this hedge could morph into outright leadership.
Financials are trickier, but just as important. Seeing capital markets firms (IBKR, XP), mortgage REITs, asset managers, and regional banks all clustered tells you institutions are preparing for a policy shift. Rate cuts would be a tailwind for credit services and mortgage finance, but a deeper slowdown would punish the regionals. The way these consensus levels resolve will give us an early read on how institutions really view the Fed’s next move. If IBKR, SOFI, and the mortgage names start lifting cleanly, that’s confirmation the market is leaning into easing without panic. If instead we see repeated failures at these levels, expect that to be the canary for cracks in financial stability.
The ballast comes from staples, healthcare, and utilities. KDP, WBA, KMB, and TSN in staples; a scatter of biotechs and healthcare services; and the usual yield proxies in utilities. These aren’t sectors you chase for growth, but they’re where institutions dig in when they’re nervous about volatility. If you start to see those names outperform while semis or financials stall, it’s a rotation signal — institutions getting defensive without going to cash. Conversely, if these lag while tech and financials recover, it means money is rotating back toward offense.
So if forced to put a sketch together: I’d lean into semis as the core directional tell, with energy as the hedge. I’d keep one eye on financials as the Fed barometer and another on staples/utilities for signals of defensive rotation. Invalidation would come if semis fail to hold and energy can’t pick up the slack — in that case, the whole market’s structure looks vulnerable. Confirmation would come from semis reasserting leadership while financials grind higher, signaling institutions are comfortable with rate cuts without fearing recession.
And the macro cross-currents? Tariffs and Fed policy dominate. Tariffs are already showing up in consumer and industrial names, while Powell’s dovish lean at Jackson Hole cracked the door for cuts. That’s the backdrop institutions are positioning against, and the consensus prices here reflect exactly that push and pull — growth hopes colliding with inflation and policy uncertainty.
In plain English: semis decide the tape, energy hedges the risk, financials tell you whether the Fed has room to cut, and staples/utilities signal whether institutions are quietly ducking for cover. That’s the roadmap I’d use heading into September.
MIR Part 3: Framing-Up A Trade
Here’s how I’d stitch this together the institutional positioning story right now, drawing on the Consensus Levels, the Outliers, and the TRV themes.
What really jumps out first is how concentrated the Consensus Levels are in areas that institutions tend to treat as structural – semiconductors, mega-cap tech, energy majors, and the bedrock of consumer staples. When Apple, Qualcomm, Marvell, and UMC all light up together, it tells you that even amid rotation, semis and hardware remain the heartbeat of institutional structure. Layer on BP, CVE, and CVI from energy, plus household names like KDP and KMB in staples, and what you’ve got is a foundation. These are levels where institutions have done the bulk of their business historically, and the fact they’re being interacted with again means those battlegrounds are active. It’s not froth – it’s where the biggest players want to set their pivots.
Now, look at the Outliers. You’ve got big surprise flows into banks (PPBI, COLB, BRKL), healthcare (ELAN, SRPT, AMBA, INMD), and midstream energy like KNTK. These aren’t just noise – they’re statistically off-the-charts moves. When multiple regional banks print 6σ+ activity in the same week, you know positioning is shifting fast in that corner. Same thing with biotech: SRPT, MYGN, FTRE, and others popping up tells me institutions are quietly legging into speculative healthcare just as broader volatility is low. Outliers don’t give you the whole trend, but they’re your “tells” for where conviction is changing.
Then, the TRV data stitches it all together. The acceleration is unmistakably broadening. Technology still dominates – niche AI names, infrastructure plays, satellite communications – but what’s new is the cluster in energy (ACES, URNJ, UUUU, NEXT, VNOM) and financials (AGM, BN, TW, WT, NEWT). Industrials like JOBY and KTOS show up too, which tells me cyclicals are getting pulled into the mix. This isn’t just “AI plus everything else at the margins” anymore; it’s a genuine widening of institutional appetite.
So if I were trading this institutional narrative, my positioning sketch would look something like this:
I’d lean long semiconductors and AI hardware/software, but I’d skew slightly down-cap, because TRV shows acceleration in the satellites of the trade, not just the NVIDIAs and AMDs. Names like SATS, VSAT, TLS, and even niche AI software like CYBR are catching the flows that matter.
I’d build an energy sleeve, but I’d be selective. Consensus Levels highlight the oil majors, Outliers show midstream like KNTK, and TRV shows uranium and clean energy. That triangulation suggests the bid is real, but it’s diversified – I’d want exposure across conventional energy (BP, CVE), transition (ACES, NEXT), and nuclear (URNJ, UUUU).
In financials, I’d focus on regional banks and capital markets players. The Outliers scream positioning in PPBI, COLB, BRKL, while TRV backs it up with asset managers and brokers. That’s the kind of confirmation you don’t ignore.
On the hedge side, I’d keep one eye on defensive consumer staples – KDP, KMB, TSN – which Consensus Levels show as active battlegrounds. These give ballast if the broader cyclicals wobble. I’d also pay attention to the hedging footprints in Outliers – products like GDXD, UBT – as they’re signaling institutions aren’t charging in unprotected.
And for confirmation or invalidation, I’d be watching the breadth in TRV. If tech acceleration fades back to just the megacaps and the energy/financials rotation stalls, that would undercut the thesis of broadening leadership. But if the next few weeks continue to show semis plus energy plus financials in lockstep, then I’d treat this as the beginning of a multi-sector leg higher into year-end.
So the emergent narrative is simple but powerful: institutions are defending their structural levels in semis, energy, and staples; they’re taking outsized, statistically rare shots in banks and biotech; and they’re accelerating into a broader set of themes across energy transition, financial plumbing, and defense. That’s not a scatterplot – it’s coordinated. And if I had to put my hypothetical desk behind it, I’d be long semis, diversified energy, and regional banks with a hedge in staples and a close eye on breadth to make sure the expansion continues.
Thank you for being part of our community and for dedicating your time to this edition. Your insights and engagement drive everything we do, and we’re honored to share this space with such committed, thoughtful readers. Here’s to a week filled with clear opportunities and strong performance. Wishing you many bags 💰💰💰
—VolumeLeaders